OATAO is an open access repository that collects the work of Toulouse
researchers and makes it freely available over the web where possible
Any correspondence concerning this service should be sent
to the repository administrator:
[email protected]
This is an author’s version published in: http://oatao.univ-toulouse.fr/20479
To cite this version: Oliot, Manon
and Chong, Poehere
and
Erable, Benjamin
and Bergel, Alain
Influence of the electrode
size on microbial anode performance. (2017) Chemical Engineering
Journal, 327. 218-227. ISSN 1385-8947
Official URL : http://doi.org/10.1016/j.cej.2017.06.044
Open Archive Toulouse Archive Ouverte
Influence of the electrode size on microbial anode performance
Manon Oliot
⇑, Poehere Chong, Benjamin Erable, Alain Bergel
Laboratoire de Génie Chimique CNRS – Université de Toulouse (INPT), 4 allée Emile Monso, 31432 Toulouse, France
h i g h l i g h t s
!Microbial anodes were scaled-up from 9 to 50 cm2surface area.
!Kinetics curves showed significant performance loss.
!The distribution of the potential over the anode surface was modelled numerically.
!Ohmic drop was responsible for only a part of the performance loss.
!Heterogeneity in biofilm development matched with the potential distribution.
Keywords: Bioanode Microbial fuel cell Scale-up
Numerical modelling Bioelectrochemical system
a b s t r a c t
The performance of microbial fuel cells and other related microbial electrochemical processes is seen to deteriorate severely when they are scaled up. This crucial problem is addressed here by comparing the kinetics of microbial anodes with projected surface areas of 9 and 50 cm2under well-controlled electro-chemical conditions. The microbial anode kinetics were characterized by low scan rate voltammetry. The 9-cm2anodes showed Nernstian behaviour, while the 50-cm2anodes showed significantly lower perfor-mance. The distribution of the electrostatic potential in the experimental set-up was modelled numeri-cally. The model predicted the general trend of the voltammetry curves recorded with the 50-cm2anodes well, showing that part of the performance deterioration was due to ohmic drop and to non-uniformity of the local potential over the anode surface. Furthermore, the biofilm presented slightly different electro-chemical characteristics when grown on the 9-cm2or 50-cm2anodes, and the difference in local potential over the 50-cm2anodes induced spatial heterogeneity in biofilm development. The effect of local poten-tial on biofilm characteristics was an additional cause of the lower performance obtained with the 50-cm2anodes. In the current state of the art, the soundest way to design large-sized microbial anodes is to adopt the dual main aim of minimizing the ohmic drop while keeping the most uniform possible potential over the electrode surface. Modelling potential distribution inside the reactor should make an essential contribution to this.
1. Introduction
For around 15 years, microbial biofilms developed on anode surfaces have revealed an amazing capacity to catalyse the electro-chemical oxidation of a large variety of organic compounds[1,2]. Microbial anodes have shown very high performance in terms of current density produced[3–5]and have opened up avenues for a huge number of new electrochemical processes[6,7]. Interesting applications have been predicted in various application sectors. Microbial fuel cells (MFCs) have been the pioneering systems implementing microbial anodes for the local production of small
amounts of electrical energy [8–12] and its storage [13,14]. In microbial electrolysis cells (MECs), microbial anodes reduce the energy cost of hydrogen production [15–17]. Microbial anodes have also been envisioned in the design of new wastewater treat-ment processes [18–20]. Extremely simplified processes, called electro-microbial snorkels, have been derived, based on short-circuiting a microbial anode with a cathode in order to maximize the organic matter consumption rate[21]. Such low-cost and low maintenance electrochemical systems may have promising futures in wastewater treatment [22] and environmental depollution
[23,24].
These thrilling perspectives will only become reality when the difficulty of scaling-up laboratory devices to large-sized industrial equipment has been overcome [8]. Many attempts have been made, particularly with MFCs and MECs, but with only modest suc-⇑Corresponding author.
E-mail addresses:[email protected](M. Oliot),[email protected]
cess [25–27]. In the case of MFCs equipped with air-breathing cathodes, which are the archetype of electro-microbial devices, the maximum power densities reported so far are 4.7[28] and 6.4 W.m"2[29], but the maximum performance has been observed to fall to 2 W.m"2when the volume of the MFC is increased, even modestly, to 100 mL [30]. The problem is so tricky that some research teams think that the best way to develop MFC applica-tions at reasonable scale should be to stack several small MFCs rather than increasing the size of a single cell [31]. Impressive results have been reported in this way, by stacking up to 400 indi-vidual small MFCs[32].
Nevertheless, the interest of the stacking approach should not discourage us from attempting scale-up. Little success has been reported so far in this domain, probably because scaling-up attempts have been carried out with whole reactors[8,33]. Consid-ering microbial electrochemical reactors as a whole and trying to directly increase their size is a tough challenge because of the com-plex interactions that occur in these reactors. The performance decrease of the reactor can be due to the microbial anode itself, which may lose a part of its catalytic efficiency when its surface area increases, but it may also be caused by any other element of the reactor: cathode kinetics, ion transport through the elec-trolyte(s)[34] and any coupled effects such as the cross-over of substrates and metabolites between anode and cathode. Actually, scaling-up complex technological systems such as cars, planes or industrial chemical equipment is never carried out by considering the system as a whole and trying to increase its size from a small laboratory device to industrially-sized equipment. For example, planes are not constructed by increasing their size from a child’s toy to a final long-haul aircraft, but by characterizing materials, hydrodynamics, motors, tyres, electric and hydraulic systems, etc. separately and then organizing all the information with numerical models in order to design the optimum prototype. Designing chemical equipment, e.g., catalytic hydrogenation columns or fuel cells, follows the same strategy: the reaction kinetics, the nature and the structure of the catalyst are firstly determined in analytical conditions according to well-defined analytical methods. In paral-lel, the hydrodynamics is characterized in so-called ‘‘cold proto-type” by specific experiments performed in the absence of reaction. All these pieces of information are then used to design a numerical model that allows first prototype to be made. The deviations between the numerical predictions and the experimen-tal data produced by the prototype are analysed in order to identify and quantify non-anticipated behaviours and non-anticipated interactions. Some gaps in fundamental knowledge may thus be pointed out, which must be overcome. It can consequently be decided to go back to some analytical investigations with specific experimental set-ups or to make another prototype to refine the model. When numerical predictions and experimental data are sat-isfactorily consistent, the size of the prototype can be increased. Finally, when the numerical model is assessed to be sound and accurate enough it is used to design the final industrial equipment. The large number of studies that have demonstrated the diffi-culty of scaling up microbial electrochemical reactors show that it is now time to consider such reactors as complex technological devices. Some microbial electrochemical reactors, e.g., MFCs, are easy to build and it is pretty simple to get the first interesting results. This apparent simplicity, which is an asset in some respects, should not mask the real complexity of microbial electro-chemical reactors and the need to use a rigorous engineering approach if the objective is to scale them up.
The purpose of the present study is to contribute to the strategy for scaling up electro-microbial processes starting from the very first step. The study focuses on the microbial anode, just looking at how its performance drops when the electrode size is increased from 9 to 50 cm2. The study was performed under well-controlled
electrochemical conditions, i.e., using a three-electrode analytical set-up, to extract the microbial anode from the interactions occur-ring in complete microbial electrochemical reactors, such as MFCs or MECs. In a three-electrode set-up, the potential of the anode is controlled accurately with respect to a reference electrode so that the evolution of the cathode kinetics or of some other steps of the system does not impact the value of the anode potential. For the same reason, the temperature was controlled so that the bioanodes were characterized in conditions that were as reproducible as pos-sible. Experimental and numerical approaches were combined to unravel the causes of the performance degradation. Finally, practi-cal suggestions were drawn for the design of analytipracti-cal set-ups and on how progress could be made in scaling up microbial anodes.
2. Materials and methods
2.1. Microbial anode formation
Microbial anodes were formed under constant polarization in 3-electrode set-ups. Flat carbon cloth (PaxiTech, Grenoble, France) connected to a platinum wire was used as the anode support (working electrode). The platinum wire was woven into the carbon cloth to form three stitches and the part outside the carbon struc-ture was protected by an insulating heat shrink sleeve. Two elec-trode sizes were compared, with 9 cm2(3 cm # 3 cm) and 50 cm2 (5 cm # 10 cm) projected surface area. Unless otherwise stated, current densities were calculated by using the total surface areas, which included both sides of the electrode and the edge area due to the electrode thickness of 1 mm [35]. The total surface areas used for all calculations were consequently 19.2 and 103 cm2for the 9- and 50-cm2anodes, respectively.
A platinum grid was used as the auxiliary electrode and a satu-rated calomel reference electrode as the reference (SCE, potential + 0.24 V/SHE). Microbial anodes were formed under constant polarization at "0.2 V/SCE using a VSP potentiostat (Bio-Logic SA, Claix, France) and current was recorded as a function of time. Reac-tors had a volume of 1.8 L and were kept in a heat chamber at 40 !C. The microbial anodes were firstly formed in garden compost leachate prepared by filtering a mix of 1.5 L of garden compost and 2.25 L of water containing 60 mM KCl through a loose-weave cloth
[36]. This leachate served as both the culture medium and the inoculum for the first phase of microbial anode formation. Once the anodes were supplying constant current, the compost leachate was replaced by a synthetic medium. The synthetic medium con-tained bicarbonate buffer 50 mM, 10 mL.L"1 macronutrients, 1 mL.L"1 micronutrients, 1 mL.L"1 vitamins, 4.5 g.L"1 KCl and 2.4 g.L"1 NaH
2PO4. pH was adjusted to 7.0. Sodium acetate was used as the substrate in both media. Its initial concentration of 20 mM was maintained by supplementation according to the need revealed by periodic measurements (enzymatic kit K-ACETAK, Megazyme, Ireland).
Cyclic voltammetry (CV) curves were recorded from "0.2 V/SCE to +0.2 V/SCE and then back to "0.5 V/SCE at 1 mV.s"1. Three suc-cessive cycles were achieved between the upper and lower poten-tial limits. The first cycle was generally slightly different from the two others, which were perfectly matched. Only the second cycle is presented here. Faradaic yields (/e) were calculated as the amount of electrons collected by the electrochemical reaction with respect to the amount provided to the reactor by the successive additions of acetate:
/e¼
D
CVnFR idt ð1Þ
where DC (mol.L"1) is the concentration of acetate consumed between two additions, V = 1.8 L is the reactor volume,
F = 96,485 C.mol"1is the Faraday constant, the denominator is the integral of current between the two acetate additions, and n = 8 is the number of electrons produced by each acetate molecule: CH3COO"þ 4H2O ! 2HCO"3þ 9H
þþ 8e" ð2Þ
The electrolyte resistances between the microbial anode (work-ing electrode) and the reference electrode and between the auxil-iary and reference electrodes were measured by electrochemical impedance spectroscopy (EIS). EIS was performed in potentiostatic mode by applying several potentials at the anode (0.8, 1 and 1.3 V) and the auxiliary electrode ("0.34, "0.78, "1.1 V), which spanned the range of operational potential values. Frequency ranged from 100 kHz to 10 mHz with a sinusoidal perturbation amplitude of 10 mV. EIS was not implemented to characterize the electron transfer mechanisms at the biofilm/electrode interfaces but only as a fast, accurate method to determine the ohmic resistances in the experimental set-ups. The ionic resistances measured were 3.4X and 2X for the 9-cm2 and 50-cm2 anodes, respectively, and 2.5Xfor the auxiliary electrode.
2.2. Microbial anode analysis
At the end of the experiment, the microbial anodes were exam-ined by scanning electron microscopy (SEM, Leo 435 VP-Carl Zeiss SMT SEM) and epifluorescence microscopy. For SEM, samples were fixed in phosphate buffer (400 mM, pH = 7.4) with 4% glutaralde-hyde, and rinsed in phosphate buffer containing saccharose (400 mM). They were dehydrated by immersion in solutions with increasing concentrations of acetate (50%, 70%, 100%), then in ace-tone and hexamethyldisilazane (HMDS) (50:50), and finally in 100% hexamethyldisilazane. The last batch of HMDS was dried until complete evaporation.
For epifluorescence microscopy, samples were stained with acridine orange 0.01% (Becton, Dickinson and Company, Ireland) for 10 min, then washed and dried at ambient temperature. The samples were imaged with a Carl Zeiss Axiomalger M2 microscope equipped for epifluorescence with an HBO 50 W ac mercury light source and the Zeiss 09 filter (excitor HP450-490, reflector FT 10, Barrier filter LP520). Images were acquired with a monochrome digital camera (evolution VF) every 0.5
l
m along the Z-axis and the set of images was processed with the Axiovision"software. Biofilm volume coverage ratios were assessed from images obtained by epifluorescence microscopy, as described elsewhere
[37]. For each electrode surface zone to be characterized, three spots were selected at random. For each spot, the microbial volume ratio was measured on the basis of a stack of n images taken from the upper surface along the z-axis of the bioanode with a constant distance (d = 3.9
l
m) between focal planes. The number of images (n) varied from 30 to 50 depending on the biofilm thickness. For each image, the local biofilm volume was assessed by multiplying the proportion of surface area covered by the biofilm (hi) by the thickness d and by the image surface area (Aimage). The total biofilm volume was the sum of all the local biofilms, and the biofilm vol-ume ratio was obtained by dividing the total biofilm volvol-ume by the total volume of the n layers:Biofilm volume ratio ¼ Pn i¼1hi# d # Aimage n # d # Aimage ¼ Pn i¼1hi n ð3Þ 3. Numerical modelling
3.1. Electrostatic potential distribution
Numerical modelling was based on the calculation of the sec-ondary potential distribution in the electrolyte by solving the
Laplace equation. The theoretical basis has already been detailed elsewhere [38]. The model was provided with the geometry of the experimental set-up, the ionic conductivity of the electrolyte (1.3 S.m"1) and the anode and auxiliary electrode kinetics. The experimental kinetics of the microbial anode and the auxiliary electrode were characterized by low scan rate voltammetry (1 mV.s"1) and fed into the model as boundary conditions. The experimental voltammetry curves were firstly corrected for the ohmic drop measured by EIS (3.4X for the 9-cm2 anode and 2.5Xfor the auxiliary electrode) and then fitted numerically as described elsewhere[35]. It is important to note that numerical fit-ting was used only to transform the experimental kinetics data into equations that could be used as input to the model, but no param-eter was numerically adjusted during the modelling phase.
The microbial anode CVs were fitted with a Nernst-Michaelis equation: j ¼ jmax 1 1 þ exp "F RTðE " EKÞ # $ ð4Þ
where j (A.m"2) is the current density, j
maxis the maximum current density, F = 96,485 C.mol"1 is the Faraday constant, R = 8.314 J.-mol"1.K"1is the universal gas constant, T = 313 K is the tempera-ture, E is the Nernst potential, EKis the potential when j is equal to half jmax.
The kinetics of the platinum grid (auxiliary electrode) was determined by CV at 1 mV.s"1 in the medium obtained at the end of the microbial anode formation. The auxiliary electrode, which worked at potential values lower than "0.6 V/SCE, was assumed to achieve water reduction into hydrogen:
4H2O þ 4e"! 2H2þ 4HO" ð5Þ
The CV curve was fitted with a Tafel equation:
j ¼ "j0exp
"anF
RT ðE " EOCPÞ
% &
ð6Þ where j0(A.m"2) is the exchange current density,
a
is the transfer coefficient, EOCPis the open circuit potential, and n = 4 is the number of electrons consumed per mole of water reduced.The equations were solved with the Comsol Multiphysics soft-ware equipped with the ‘‘Electrochemistry” module (version 5). The model was run by scanning different values of cell voltage (Ucell), defined as the potential difference between the anode and the auxiliary electrode [38]. The model gave the distribution of the electrostatic potential / in the electrolyte and the local values of current on the electrode surface. The total current was calcu-lated by integrating the local current over the whole electrode sur-face area, which means the two sides and the 1-mm edge.
3.2. Nernst potential: local variation and value measured
The Nernst potential of the anode is defined as:
EA¼ /MA" /SA ð7Þ
It is generally assumed that the electrode is conductive enough for the electrostatic potential of the electrode material (/MA) to be considered constant. In contrast, the electrostatic potential of the solution in contact to the electrode (/SA) varies over the electrode surface, so the Nernst potential (EA) also varies over the electrode surface.
Experimentally, the value measured for the anode potential (EA measured) is the difference between the electrostatic potential of the anode material (/MA) and the electrostatic potential of the reference electrode material (/MR):
This equation can be written as:
EA measured¼ ð/MA" /SAÞ þ ð/SA" /SRÞ þ ð/SR" /MRÞ ð9Þ
where /SRis the electrostatic potential of the solution in contact with the tip of the reference electrode. This equation means that the measured anode potential is tainted by the ohmic drop between the anode and the reference electrode (/SA" /SR) and that it must be corrected for the potential of the reference electrode (EREF= /SR" /MR):
EA measured¼ EAþ Ohmic drop " EREF ð10Þ
Here, the potential of the reference electrode was equal to zero (EREF= 0) because the model was fed with potential values expressed with respect to the saturated calomel electrode, the same reference as was used for the experiments (if the potentials were expressed with respect to the SHE in the model, the value EREF= 0.243 V should be used here to compare the numerical values with the experimental data). Consequently, Eq.(9)becomes:
EA measured¼ /MA" /SR ð11Þ
The value of the anode potential measured experimentally is the difference between the electrostatic potential of the anode material and the electrostatic potential of the solution in contact with the tip of the reference electrode.
For each value of Ucell, the model gave the value of the current and the values of /MAand /SR. The current was thus reported as a function of the measured anode potential (EA measured). In this way, the calculated current-potential curves could be directly com-pared with the voltammetry curves recorded experimentally.
4. Results and discussion
4.1. Microbial anode formation: 9-cm2vs 50-cm2anodes
Two electrode sizes were compared, with projected surface areas of 9 and 50 cm2. Microbial anodes were formed under stant polarization at "0.20 V/SCE in compost leachate with a con-stant acetate concentration of 20 mM. Two independent experimental runs were performed, each with 2 anodes of 9 cm2 and 2 anodes of 50 cm2. After around 20 days, current densities reached 5–10 A.m"2and the compost leachate was replaced by a synthetic medium. Current density values were always expressed with respect to the total surface areas, i.e., 19.2 and 103 cm2for the 9-cm2and 50-cm2anodes, respectively.
In the second phase of microbial anode development, the per-formance increased in all reactors, reaching 7–17 A.m"2 after around 10 days. Such an increase in performance is commonly observed with this procedure (data not shown). It may be due to a resupply in vitamins and nutrients favouring microbial activity and/or to the simplification of the medium content. Actually, the compost leachate used during the first phase is an excellent med-ium to initiate the formation of microbial anodes[39,40,41]but it is a rich medium, which probably contains dissolved electron acceptors such as nitrates, sulfates and humic acids that compete with the anode[36]. Many side-reactions can occur and induce the development of non-electroactive bacteria and acetogenic methanogen Archae [42]. This is the cause of the experimental deviations observed on the maximum current densities, as already reported when using rich natural media to form microbial anodes
[36,43,44].
Acetate was more quickly consumed with the 50-cm2anodes than with the 9-cm2ones. Based on 12 different measurements made before acetate was added to restore its concentration to 20 mM, Faradaic yields were 32.7 ± 5.1% and 83.0 ± 11.5% on aver-age with the 9-cm2and the 50-cm2anodes, respectively. Acetate
was consumed either by electroactive bacteria that released the electrons to the anode or by non-electroactive bacteria that used other electron acceptors than the anode. The amount of electrons released to the electrode (Qelec) is proportional to the anode surface area, while the amount of electrons released to soluble acceptors (QV) is proportional to the reactor volume. Faradaic yields are equal to:
/e¼
Qelec
Qvþ Qelec
ð12Þ For the 9-cm2anodes, the value /
e= 0.327 led to Qelec-9cm2= 0.49 QV-9cm2. When switching from the 9-cm2to the 50-cm2anodes, it can be assumed that the QVparameter was not affected because the reactor volume did not change, and that Qelecwas multiplied by the ratio of surface areas, from 19.2 to 103 cm2. This simple approach led to Qelec-50cm2= 103/19.2 # 0.49 QV, so the Faradic yield (Eq.(12)) would be 72%.
Firstly, this value was of the same order of magnitude as the experimental value of 83%, which means that the considerable increase in Faradaic yield obtained with the 50-cm2anodes was mostly explained mathematically by the increase of the anode sur-face area. The difference between the calculated Faradaic yield and the experimental value was probably due to the faster consump-tion of acetate in the reactors equipped with the 50-cm2anodes, which resulted in lower acetate concentration being reached between two additions and consequently reduced the QVpart. In conclusion, the large difference observed in the Faradaic yields according to the anode surface area seemed considerable at first glance, but an elementary mathematical approach evidenced its relevance.
CV curves were recorded at the end of anode development. The CV curves always exhibited a general sigmoid shape, which dif-fered depending on the anode size (Fig. 1, triplicates presented in
Fig. 1 of Supplementary Data). The j-E slope was markedly lower for the 50-cm2than for the 9-cm2anodes. This meant that, to reach a given current density value, a higher overpotential was needed with the 50-cm2than with the 9-cm2anodes. It can be concluded that the 50-cm2microbial anodes were less efficient than the 9-cm2anodes. As a first rough observation, it may be noted that scal-ing up microbial anodes, even in well-controlled electrochemical conditions, led to lower performance.
All the CV curves recorded with the 50-cm2anodes showed a small superimposed oxidation peak in the potential range between
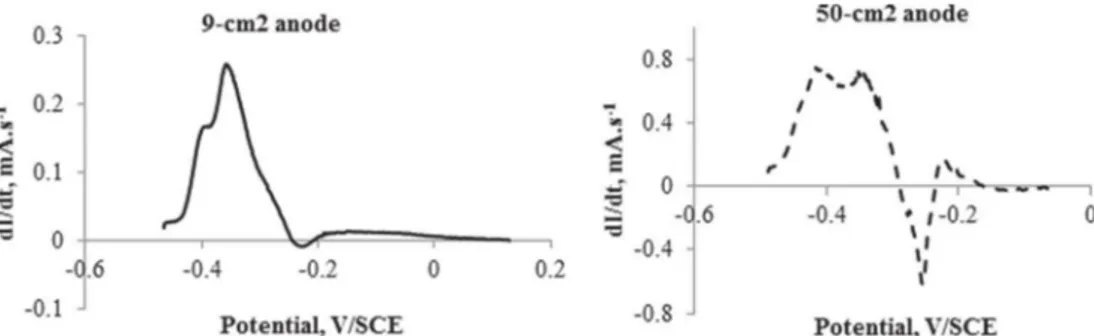
Fig. 1. Experimental cyclic voltammetries of the 9-cm2(continuous line) and
50-cm2(dotted line) microbial anodes after 10 days’ polarization at "0.2 V/SCE in a
synthetic medium (1 mV.s"1
"0.15 and 0.0 V/SCE, but this peak appeared on only one of the CVs recorded with the 9-cm2 anodes (Fig. 1, triplicates presented in
Fig. 1 of Supplementary Data). A similar peak shape has already been observed in previous studies[41,45]. It cannot be attributed to a transient effect, which would be revealed at high potential scan rate, because its shape does not correspond to theoretical transient curves[46]. This superimposed peak was probably due to a redox system that was not (or not efficiently) involved in the electrocatalytic process. If this redox system had been involved in the catalytic process, the current would not have decreased when the potential increased. The current decrease at increasing potential indicated a non-turnover behaviour. This system was detected in the 50-cm2microbial anodes but generally not in the 9-cm2microbial anodes (only in one of the four anodes).
The CV curves were corrected for the ohmic drop by removing the term RS.i (where RS (X) is the resistance between the anode and the reference electrode that was measured by EIS and i (A) is the current) from each value of potential. The corrected CVs were then derived in order to identify the different redox systems involved in the electrocatalysis[47]. At the highest potential val-ues, the CVs of the 50-cm2 anodes were strongly disturbed by the presence of the superimposed peak (Fig. 2) and the first deriva-tive revealed that a redox system could also be present in a similar potential range on the 9-cm2anodes, but with considerably lower intensity.
The first derivative of the 9-cm2-anode CVs revealed a main peak centred at "0.36 ± 0.06 V/SCE. Two other peaks were identi-fied as shoulders close to the main peak on either side. The 50-cm2 anodes exhibited two well-defined peaks centred at "0.34 ± 0.04 V/SCE and "0.15 ± 0.04 V/SCE. A third peak appeared as a shoulder at lower potential. For both electrode sizes, the first derivative of the CV curves identified three redox systems involved in the catalytic pathways, but with slightly different locations in terms of potential. Actually, attempts to accurately interpret the first derivative obtained with the 50-cm2 anodes should be avoided, because the global correction of the ohmic drop on large electrodes may warp the curve and taint the potential values. To sum up, three similar catalytic redox systems were detected what-ever the electrode size, but with different peak heights. Assuming that the peak heights of the first derivatives depended on the con-centrations of the different redox systems, it can be speculated that the three redox systems were present at different concentration ratios depending on the electrode size.
4.2. Numerical model
4.2.1. Validation of the numerical model with the 9-cm2anode After correction of the ohmic drop, the experimental CV curves recorded with the 9-cm2 microbial anodes were fitted with the Nernst-Michaelis equation (Eq.(4)). Although the fine analysis of the experimental curves revealed three redox systems, it was
possible to fit them numerically with a single redox system equa-tion. This approach was sufficient to obtain accurate anode kinetics. Here, the objective was not to establish a theoretical explanation of the kinetics curves but to provide the model with accurate anode kinetics. Considering a single system simplified the numerical fitting process as it was sufficient to introduce two parameter values into Eq.(4): the maximum current density (jmax) and the half-wave potential (EK). The experimental values jmax= 10.2 A.m"2and EK= "0.353 V/SCE, allowed the experimental CV curve to be fitted perfectly.
The platinum auxiliary electrode was fitted with a Tafel law (Eq.
(6)). The parameters j0and
a
were numerically adjusted by a least-squares procedure. The values j0= 0.135 A.m"2anda
= 0.82 led to perfect fitting of the experimental CV curves. The model was also provided with the ionic conductivity of the electrolyte, which was measured experimentally (1.3 S.m"1), and the geometry of the experimental set-up. The 9-cm2anode was in front of a larger auxiliary electrode (3.5 cm # 6.5 cm) placed in front of the anode at a distance of 7 cm. The reference electrode was centred on the anode and at a distance of 2 cm from its surface. The integration space was a cube of side 25 cm. It was verified that the volume of the integration space was large enough not to affect the results, for instance the model run in a cubic integration space of 50 cm sides gave exactly the same results.The current was calculated for different values of the cell volt-age and the CV curves were drawn by plotting the current density (relating to total surface area) as a function of EA measured(Eq.(11)). The numerical CV curve (solid line) matched the experimental data perfectly (dotted line) (Fig. 3A), which confirmed the validity of the numerical approach. It should be recalled here that no parameter was numerically adjusted to calculate the CV curves from the experimental kinetics of each electrode.
4.2.2. From 9 cm2to 50 cm2
The set-up with the 50-cm2anode was modelled with an auxil-iary electrode of dimensions 6 cm # 22 cm, to keep a configuration and surface area ratio similar to that with the 9-cm2anode. The distance between anode and auxiliary electrode and the position of the reference electrode were not changed. Consequently, except for the electrode sizes, nothing was changed with respect to the previous run. This meant that the kinetics determined experimen-tally with a 9-cm2anode was used to model the 50-cm2 configura-tion. This is a first step of numerical scale-up. The model provided a CV with a current-potential slope lower than that of the 9-cm2 anode (solid line,Fig. 3B). The model confirmed the experimental trend: increasing the electrode size led to decreasing performance. Nevertheless, the modelled CV overestimated the experimental curve.
The performance decrease induced by increasing the electrode size can be understood by looking at the current provided by the anodes at the same potential Emeasured, for instance "0.25 V/SCE
(Fig. 4A). Both sides of the 9-cm2anode provided similar current density (8.6 and 8.5 A.m"2), whereas the two sides of the 50-cm2 anode provided smaller current densities (Fig. 4B) and the back worked less efficiently than the side in front of the auxiliary elec-trode (7.25 against 8.0 A.m"2).
The distribution of the electrostatic potential of the solution in contact with the anode surface (/SA) was different in the two cases. For comparison, the values were extracted from the model at the middle and at 1 mm from the extremity of the front and the back sides of the anode. The front side was defined as the anode side that faced the auxiliary electrode (Fig. 4A). For each local electro-static potential, the corresponding Nernst potential was calculated according to Eq.(7)(Table 1). The front side and the back side of the 9-cm2anode worked with an identical range of Nernst poten-tials from "0.303 to "0.320 V/SCE. The electrode worked at local potential values significantly different from the measured value Emeasured= "0.25 V/SCE, because of the ohmic drop, but the poten-tial over the electrode surface was fairly uniform, with a maximum difference of only 17 mV, and both sides produced similar current densities, of 8.63 and 8.5 A.m"2(Fig. 4A). The situation of the 50-cm2anode was different. It showed a significantly broader distri-bution of potentials, of 58 mV (from "0.287 to "0.345 V/SCE), and produced lower current densities. Each side worked at a slightly different potential, which resulted in different current den-sities, of 8.0 and 7.25 A.m"2.
Because of a broader distribution of local potential, the 50-cm2 anode produced lower current density than the 9-cm2anode. The current lines could easily reach the entire back surface of the 9-cm2 anode, so only a small potential distribution occurred and the back side produced current similar to that of the front side. In contrast, the current lines struggled to reach the back surface of the 50-cm2anode, which was consequently less efficient than the front.
In summary, although the applied potential was equal in the two cases (Emeasured= "0.25 V/SCE), the anodes worked in different local potential conditions depending on their size. Both sides of the
Fig. 3. Experimental (dotted lines) and modelled (solid and dashed lines) CV curves of (A) 9-cm2and (B) 50-cm2anodes with the experimental electrolyte conductivity
of 1.3 S.m"1. Dashed line: modelled CV curve of the 50-cm2anode with ionic
conductivity of 0.2 S.m"1. The straight grey line gives the slope of the 9-cm2-anode CV.
Fig. 4. Values of the electrostatic (/) and Nernst (E, V/SCE) potentials and current densities (j, A.m"2) along a 9-cm2(A) and a 50-cm2 (B) microbial anode for
9-cm2anode provided similar current density, while the two sides of the 50-cm2anode provided lower and different current densi-ties. The 50-cm2anode worked in less favourable electrochemical conditions than the 9-cm2electrode. This effect was stronger here than an ‘‘abiotic electrochemist” would intuitively anticipate, because of the low ionic conductivity of the media used in electro-microbial systems in comparison to that of the electrolytes implemented in conventional electrochemical processes.
The model illustrates the drastic effect of the ionic conductivity. For instance, with an ionic conductivity of 0.2 S.m"1, as encoun-tered when wastewaters are used as the electrolyte [16,48], the 50-cm2 anode would display a drastic performance loss (dashed line, Fig. 3B). In this case, always for Emeasured= "0.25 V/SCE, the Nernst potential at the middle of the back side fell to "0.404 V/SCE. With ionic conductivity of 0.2 S.m"1, the 50-cm2 anodes would thus work far from the potential value applied by the experimentalist. Nevertheless, the potential distribution over the anode surface would be of 49 mV (Table 1), i.e., slightly less large than with the conductivity of 1.3 S.m"1, and both anode sides would produce fairly similar current densities (2.46 for the front side and 2.03 A.m"2for the back). Actually, ohmic drop consider-ably impacted the anode operating conditions by holding the local potentials away from the applied value. In counterpart, it flattened the potential distribution.
The model predicted the general evolution trend of the CV curve when the anode was scaled up from 9 to 50 cm2but the perfor-mance loss predicted by the model (Fig. 3) was smaller than that observed on the experimental curves (Fig. 1). The difference in local potentials due to the low conductivity of the medium explained the performance loss linked to scaling up to some extent, but not fully. Actually, the position of the anode was not strictly controlled in the experimental set-ups and the anode was not strictly parallel to the auxiliary electrode. The angle may have been up to around 30! with respect to the vertical axis in some reactors. The model was run by tilting the 50-cm2anode by 30! with respect to the vertical axis. Tilting the anode exacerbated the performance loss (Fig. 5). The potential distribution range over the anode surface was reduced to 46 mV (vs. 58 mV when the anode was vertical) but potentials were globally farther from the applied potential Emeasured than with the vertical anode (Table 1). As a result, the anode per-formance decreased significantly. The model showed that keeping the anode and the auxiliary electrode strictly parallel became essential when implementing large electro-microbial devices. Small laboratory prototypes can tolerate some small geometric deviations without significant impact being detected on electrode performance, but geometric deviation is no longer acceptable in large reactors.
In summary, the model showed that the differences in local potential were responsible for a part of the performance loss when microbial anodes were scaled up from 9 to 50 cm2. The non-parallel positioning of the anode relatively to the auxiliary
electrode worsened the performance loss and the modelled curve was thus closer to the experimental one. Nevertheless, the model still predicted more efficient CV curves than were recorded experimentally.
4.3. Biofilm development
The 9-cm2and 50-cm2microbial anodes were observed by SEM and epifluorescence microscopy at the end of the experiments. Two different areas were imaged: close to the middle and close to the extremity of the electrode surface (Fig. 6) and, for each area, three neighbouring spots selected at random were imaged on two different anodes. The average values and standard deviations given below are thus the result from 6 measurements. For each spot, a stack of 30–50 images was obtained along the z-axis in order to assess the biofilm volume ratio. Epifluorescence imaging was per-formed by using acridine orange so that both intracellular and extracellular nucleic acids were stained and epifluorescence gave a fair representation of the global biofilm.
The 9-cm2anodes presented dense, uniform colonization of the surface whatever the location of the spots. The microbial volume ratios were of the same order of magnitude close to and far from the middle of the electrode: 49.1 ± 7.1% and 45 ± 4%, respectively. In contrast, SEM imaging of the 50-cm2 anodes showed a non-uniform biofilm, which was thick close to middle of the electrode and thinner farther away. The volume coverage ratios extracted from epifluorescence imaging confirmed the SEM observation, with a microbial volume ratio of 60.3 ± 11.2% close to the middle and 51.7 ± 5.6% far away. Actually, the difference of visual impres-sion given by SEM imaging seemed even more marked than the difference expressed by the quantitative assessment of the biofilm volume ratios. The biofilm was denser on the zones were the model showed less negative local potentials. A comparison of the
Fig. 5. Experimental (dotted line) and modelled (solid line) (i-E) curves of a 50-cm2
anode. The modelled anode was tilted by 30! with respect to the vertical axis. Table 1
Values of the Nernst potentials and current densities along a 9-cm2and a 50-cm2microbial anode for E
measured= "0.25 V/SCE, in different conditions.
Front side Back side
Bottom Centre Top Bottom Centre Top
9-cm2anode (Fig. 4) E (V/SCE) "0.303 "0.317 "0.303 "0.305 "0.320 "0.305 j (A.m"2 ) 8.63 8.5 50-cm2anode (Fig. 4) E (V/SCE) "0.287 "0.332 "0.287 "0.293 "0.345 "0.293 j (A.m"2) 8 7.25 50-cm2anode at 0.2 S.m"1 E (V/SCE) "0.355 "0.393 "0.355 "0.36 "0.404 "0.36 j (A.m"2) 2.46 2.03
50-cm2anode tilted of 30! E (V/SCE) "0.322 "0.345 "0.31 "0.324 "0.356 "0.318
j (A.m"2
theoretical potential distribution over the anode surface and the observed biofilm development suggests that the potential gradient along the electrode may impact biofilm development.
4.4. Discussion
It is well known that the best electroanalytical set-up to charac-terize electrochemical kinetics consists of an electrode of small surface area and with only one side working in front of an auxiliary electrode of larger surface area. This configuration can be easily achieved with a plane electrode by insulating one side and the edges, as is done for rotating disk electrodes for example. It is more difficult, or even impossible, to achieve such a one-sided configura-tion with porous electrodes (felt, foam, etc.) and electrodes such as carbon cloth, which are used for the development of the most effi-cient electroactive biofilms. In this case, the best electroanalytical strategy is to use a small electrode and to consider the two sides, without forgetting the edge, as the working surface area. It has already been demonstrated experimentally that, in such a configu-ration, both sides of the anode work in similar conditions[49]. This was confirmed here by the numerical modelling of the 9-cm2 anode.
It should be kept in mind that the potential applied (Eq.(11)) was measured as the difference between the electrostatic potential of the anode material (/MA) and the electrostatic potential of the solution in contact with the tip of the reference electrode (/SR). In a relevant electro-analytical system, two conditions must be validated:
– the electrostatic potential of the solution in contact with the tip of the reference electrode must not be significantly different from that of the solution in contact with the anode (/SA), i.e., the ohmic drop between the anode and the reference electrode must be negligible (Eqs.(9) and (10)),
– the electrostatic potential of the solution must not vary signifi-cantly over the electrode surface.
If these two conditions hold, the electrode can be considered as a uniform surface working at the applied potential. This is the sit-uation that should be ensured in an appropriate electroanalytical set-up. Relevant characterization of the electrode kinetics can thus
be performed by expressing the current density relative to the total surface area (both sides and edge)[35].
In the case of electro-microbial technologies, which commonly use electrolytes with low ionic conductivity, the ohmic drop often taints experimental measurements. The ohmic drop can be cor-rected as a whole, as was done here for the CV curves recorded with the 9-cm2anodes. The simplest way to do this is to measure the global ionic resistance, RS, experimentally and to correct each potential value of the current-potential curve using the RS.i term. In terms of electrostatic potential, this operation removes the (/SA" /SR) term from Eq.(9). In this way, the electrode is hypoth-esized to be a surface working at the same potential everywhere. This assumption was reasonable here for the 9-cm2anode operat-ing in the 1.3 S.m"1electrolyte but modelling showed that such an assumption could no longer be made for the 50-cm2 anode, because of the significant distribution of local Nernst potentials (Fig. 4). The 50-cm2 anode operating in the 1.3 S.m"1electrolyte could not be considered as a uniform electrode.
The scaling-up step investigated in this study was based on a modest scaling ratio, from 9 to 50 cm2, and was carried out in well controlled electrochemical conditions. Despite these favourable circumstances, the experiments showed a marked loss of perfor-mance from 9 to 50 cm2. Such clear performance deterioration with such a modest scaling-up ratio and well-controlled electro-chemical conditions provides a basis to approach the drastically low performance reported so far when larger microbial electro-chemical reactors have been used under more complex conditions. The model showed that the decrease of the anode performance, when passing from 9 to 50 cm2surface area, was explained by the difference in the local Nernst potential to some extent. At large size, the anode worked at potentials significantly far from the applied value and presented a broad distribution of local potential. The performance deterioration was exacerbated by non-parallel positioning of the anode with respect to the auxiliary electrode. Nevertheless, even with a tilting angle of 30!, which was the max-imum that might be encountered in the present experiments, per-formance predicted by the model for the 50-cm2anodes remained higher than the experimental data.
The remaining difference between the numerical and experi-mental CV curves can be explained by differences in the character-istics of the electroactive biofilms. The 9-cm2 anodes presented
uniform microbial colonization, while the 50 cm2 anodes pre-sented differences in local biofilm volumes, which matched the dif-ference in local potential predicted by the model. The potential distribution over the anode surface corresponded to some differ-ence in biofilm development. Furthermore, the biofilms exhibited three similar redox systems whatever the electrode size, but with different concentration ratios depending on the anode size.
It can be speculated that biofilm growth is sensitive to the local anode potential and this may be the source of a vicious cir-cle: the potential gradient along the electrode surface impacts the biofilm development, which in turn affects the local potential by establishing patches with different catalytic capabilities. Several informative studies have reported on the relationship between anode potential and electroactive biofilm development
[36,44,50,51]but basic knowledge on this issue remains sporadic and no obvious way has yet been found to correlate the biofilm growth and the development of its electrocatalytic properties with the electrode potential. In the current state of the art, the soundest design of large-sized microbial anodes would follow the main guideline of reducing the ohmic drop while keeping the most uniform possible potential over the anode surface. These two objectives must be pursued concomitantly. For instance, the model run with low ionic conductivity (0.2 S.m"1) showed that increasing the ohmic drop between the anode and the auxiliary electrode reduced the potential distribution over the electrode surface – but it also showed that the anode perfor-mance was severely decreased. Uniformity of the local potential must not be achieved at the price of higher ohmic drop but by appropriate design of the anode-cathode architecture. Modelling the potential distribution inside the reactor will constitute an essential tool for this purpose.
5. Conclusions
Although scaling-up was performed in well-controlled electro-chemical conditions and with a modest scale-up ratio, from 9 to 50 cm2 surface area, marked deterioration in the performance of microbial anodes was observed. The numerical model showed that the performance loss was, to some extent, explained by differences in the local Nernst potential, which depended on the electrode size. The difference in biofilm development was the other contribution to the performance loss. The biofilm develop-ment seemed to be sensitive to the local potential. The biofilm formed on a large anode suffering from broad local potential dis-tribution may develop electrocatalytic properties different from those in a small electroanalytical set-up. In the absence of certain correlation between potential and electroactive biofilm develop-ment, minimizing the ohmic drop while ensuring uniform potential over large-sized electrodes should be considered as the main rule for scale-up.
Acknowledgements
This work benefited from the support of the French state, man-aged by the Agence Nationale de la Recherche (ANR), within the framework of the Bioelec project (ANR-13-BIME-006). P. Chong gratefully thanks the MEGEP doctoral school for the attribution of a Ph.D. grant.
Appendix A. Supplementary data
Supplementary data associated with this article can be found, in the online version, athttp://dx.doi.org/10.1016/j.cej.2017.06.044.
References
[1]D. Pant, G. Van Bogaert, L. Diels, K. Vanbroekhoven, A review of the substrates used in microbial fuel cells (MFCs) for sustainable energy production, Bioresour. Technol. 101 (2010) 1533–1543.
[2]P. Pandey, V.N. Shinde, R.L. Deopurkar, S.P. Kale, S.A. Patil, D. Pant, Recent advances in the use of different substrates in microbial fuel cells toward wastewater treatment and simultaneous energy recovery, Appl. Energy 168 (2016) 706–723.
[3]S. Chen, G. He, Q. Liu, F. Harnisch, Y. Zhou, Y. Chen, et al., Layered corrugated electrode macrostructures boost microbial bioelectrocatalysis, Energy Environ. Sci. 5 (2012) 9769–9772.
[4]S.F. Ketep, A. Bergel, A. Calmet, B. Erable, Stainless steel foam increases the current produced by microbial bioanodes in bioelectrochemical systems, Energy Environ. Sci. 7 (2014) 1633–1637.
[5]A. Baudler, I. Schmidt, M. Langner, A. Greiner, U. Schröder, Does it have to be carbon? Metal anodes in microbial fuel cells and related bioelectrochemical systems, Energy Environ. Sci. 8 (2015) 2048–2055.
[6]A.P. Borole, G. Reguera, B. Ringeisen, Z.-W. Wang, Y. Feng, B.H. Kim, Electroactive biofilms: current status and future research needs, Energy Environ. Sci. 4 (2011) 4813–4834.
[7]H. Wang, Z.J. Ren, A comprehensive review of microbial electrochemical systems as a platform technology, Biotechnol. Adv. 31 (2013) 1796–1807. [8]B.E. Logan, M.J. Wallack, K.-Y. Kim, W. He, Y. Feng, P.E. Saikaly, Assessment of
microbial fuel cell configurations and power densities, Environ. Sci. Technol. Lett. 2 (2015) 206–214.
[9]I.A. Ieropoulos, P. Ledezma, A. Stinchcombe, G. Papaharalabos, C. Melhuish, J. Greenman, Waste to real energy: the first MFC powered mobile phone, Phys. Chem. Chem. Phys. 15 (2013) 15312–15316.
[10] J. Chouler, G.A. Padgett, P.J. Cameron, K. Preuss, M.-M. Titirici, I. Ieropoulos, et al., Towards effective small scale microbial fuel cells for energy generation from urine, Electrochim. Acta 192 (2016) 89–98.
[11]Y.R.J. Thomas, M. Picot, A. Carer, O. Berder, O. Sentieys, F. Barriere, A single sediment-microbial fuel cell powering a wireless telecommunication system, J. Power Sources 241 (2013) 703–708.
[12]A. Schievano, A. Colombo, M. Grattieri, S.P. Trasatti, A. Liberale, P. Tremolada, et al., Floating microbial fuel cells as energy harvesters for signal transmission from natural water bodies, J. Power Sources 340 (2017) 80–88.
[13]J. Houghton, C. Santoro, F. Soavi, A. Serov, I. Ieropoulos, C. Arbizzani, et al., Supercapacitive microbial fuel cell: characterization and analysis for improved charge storage/delivery performance, Bioresour. Technol. 218 (2016) 552–560. [14]C. Santoro, F. Soavi, A. Serov, C. Arbizzani, P. Atanassov, Self-powered supercapacitive microbial fuel cell: the ultimate way of boosting and harvesting power, Biosens. Bioelectron. 78 (2016) 229–235.
[15]Y. Zhang, I. Angelidaki, Microbial electrolysis cells turning to be versatile technology: recent advances and future challenges, Water Res. 56 (2014) 11– 25.
[16]E.S. Heidrich, S.R. Edwards, J. Dolfing, S.E. Cotterill, T.P. Curtis, Performance of a pilot scale microbial electrolysis cell fed on domestic wastewater at ambient temperatures for a 12 month period, Bioresour. Technol. 173 (2014) 87–95. [17]A. Escapa, M.I. San-Martín, R. Mateos, A. Morán, Scaling-up of membraneless
microbial electrolysis cells (MECs) for domestic wastewater treatment: bottlenecks and limitations, Bioresour. Technol. 180 (2015) 72–78. [18]E.S. Heidrich, J. Dolfing, K. Scott, S.R. Edwards, C. Jones, T.P. Curtis, Production
of hydrogen from domestic wastewater in a pilot-scale microbial electrolysis cell, Appl. Microbiol. Biotechnol. 97 (2013) 6979–6989.
[19]W.-W. Li, H.-Q. Yu, Z. He, Towards sustainable wastewater treatment by using microbial fuel cells-centered technologies, Energy Environ. Sci. 7 (2014) 911– 924.
[20] O. Lefebvre, A. Uzabiaga, I.S. Chang, B.-H. Kim, N.Y. Ng, Microbial fuel cells for energy self-sufficient domestic wastewater treatment – a review and discussion from energetic consideration, Appl. Microbiol. Biotechnol. 89 (2011) 259–270.
[21]B. Erable, L. Etcheverry, A. Bergel, From microbial fuel cell (MFC) to microbial electrochemical snorkel (MES): maximizing chemical oxygen demand (COD) removal from wastewater, Biofouling 27 (2011) 319–326.
[22]Q. Yang, H. Zhao, H. Liang, Denitrification of overlying water by microbial electrochemical snorkel, Bioresour. Technol. 197 (2015) 512–514.
[23]D.R. Lovley, Live wires: direct extracellular electron exchange for bioenergy and the bioremediation of energy-related contamination, Energy Environ. Sci. 4 (2011) 4896–4906.
[24]C.C. Viggi, E. Presta, M. Bellagamba, S. Kaciulis, S.K. Balijepalli, G. Zanaroli, et al., The ‘‘Oil-Spill Snorkel”: an innovative bioelectrochemical approach to accelerate hydrocarbons biodegradation in marine sediments, Front. Microbiol. 6 (2015) 881.
[25]B.E. Logan, Scaling up microbial fuel cells and other bioelectrochemical systems, Appl. Microbiol. Biotechnol. 85 (2010) 1665–1671.
[26]A. Dewan, H. Beyenal, Z. Lewandowski, Scaling up microbial fuel cells, Environ. Sci. Technol. 42 (2008) 7643–7648.
[27] C. Santoro, C. Arbizzani, B. Erable, I. Ieropoulos, Microbial fuel cells: from fundamentals to applications. A review, J. Power Sources (2017),http://dx.doi. org/10.1016/j.jpowsour.2017.03.109.
[28]W. Yang, B.E. Logan, Immobilization of a metal-nitrogen-carbon catalyst on activated carbon with enhanced cathode performance in microbial fuel cells, ChemSusChem 9 (2016) 2226–2232.
[29]M. Oliot, L. Etcheverry, A. Mosdale, R. Basseguy, M.-L. Délia, A. Bergel, Separator electrode assembly (SEA) with 3-dimensional bioanode and removable air-cathode boosts microbial fuel cell performance, J. Power Sources 356 (2017) 389–399.
[30]C. Santoro, S. Babanova, P. Atanassov, B. Li, I. Ieropoulos, P. Cristiani, High power generation by a membraneless single chamber microbial fuel cell (SCMFC) using enzymatic bilirubin oxidase (BOx) air-breathing cathode, J. Electrochem. Soc. 160 (2013) H720–H726.
[31]P. Ledezma, A. Stinchcombe, J. Greenman, I. Ieropoulos, The first self-sustainable microbial fuel cell stack, Phys. Chem. Chem. Phys. 15 (2013) 2278–2281.
[32]I.A. Ieropoulos, A. Stinchcombe, I. Gajda, S. Forbes, I. Merino-Jimenez, G. Pasternak, et al., Pee power urinal – microbial fuel cell technology field trials in the context of sanitation, Environ Sci. Water Res. Technol. 2 (2016) 336–343. [33]V.B. Oliveira, M. Simoes, L.F. Melo, A.M.F.R. Pinto, Overview on the
developments of microbial fuel cells, Biochem. Eng. J. 73 (2013) 53–64. [34]M. Oliot, S. Galier, H. Roux de Balmann, A. Bergel, Ion transport in microbial
fuel cells: key roles, theory and critical review, Appl. Energy 183 (2016) 1682– 1704.
[35]M. Oliot, L. Etcheverry, A. Bergel, Removable air-cathode to overcome cathode biofouling in microbial fuel cells, Bioresour. Technol. 221 (2016) 691–696.
[36]B. Cercado, N. Byrne, M. Bertrand, D. Pocaznoi, M. Rimboud, W. Achouak, et al., Garden compost inoculum leads to microbial bioanodes with potential-independent characteristics, Bioresour. Technol. 134 (2013) 276–284. [37]E. Blanchet, B. Erable, M.-L. De Solan, A. Bergel, Two-dimensional carbon cloth
and three-dimensional carbon felt perform similarly to form bioanode fed with food waste, Electrochem. Commun. 66 (2016) 38–41.
[38]R. Lacroix, S. Da Silva, M.V. Gaig, R. Rousseau, M.-L. Delia, A. Bergel, Modelling potential/current distribution in microbial electrochemical systems shows how the optimal bioanode architecture depends on electrolyte conductivity, Phys. Chem. Chem. Phys. 16 (2014) 22892–22902.
[39]B. Cercado-Quezada, M.-L. Délia, A. Bergel, Electrochemical micro-structuring of graphite felt electrodes for accelerated formation of electroactive biofilms on microbial anodes, Electrochem. Commun. 13 (2011) 440–443.
[40]S. Parot, M.-L. Delia, A. Bergel, Forming electrochemically active biofilms from garden compost under chronoamperometry, Bioresour. Technol. 99 (2008) 4809–4816.
[41]D. Pocaznoi, B. Erable, L. Etcheverry, M.-L. Delia, A. Bergel, Towards an engineering-oriented strategy for building microbial anodes for microbial fuel cells, Phys. Chem. Chem. Phys. 14 (2012) 13332–13343.
[42]B. Demirel, P. Scherer, The roles of acetotrophic and hydrogenotrophic methanogens during anaerobic conversion of biomass to methane: a review, Rev. Environ. Sci. Biotechnol. 7 (2008) 173–190.
[43]D.A. Finkelstein, L.M. Tender, J.G. Zeikus, Effect of electrode potential on electrode-reducing microbiota, Environ. Sci. Technol. 40 (2006) 6990–6995. [44]R. Rousseau, C. Santaella, A. Bonnafous, W. Achouak, J.-J. Godon, M.-L. Delia,
et al., Halotolerant bioanodes: the applied potential modulates the electrochemical characteristics, the biofilm structure and the ratio of the two dominant genera, Bioelectrochemistry (Amsterdam, Netherlands) 112 (2016) 24–32.
[45]S.M. Strycharz, A.P. Malanoski, R.M. Snider, H. Yi, D.R. Lovley, L.M. Tender, Application of cyclic voltammetry to investigate enhanced catalytic current generation by biofilm-modified anodes of Geobacter sulfurreducens strain DL1 vs. variant strain KN400, Energy Environ. Sci. 4 (2011) 896–913.
[46]R. Rousseau, M.-L. Delia, A. Bergel, A theoretical model of transient cyclic voltammetry for electroactive biofilms, Energy Environ. Sci. 7 (2014) 1079– 1094.
[47]M. Rimboud, D. Pocaznoi, B. Erable, A. Bergel, Electroanalysis of microbial anodes for bioelectrochemical systems: basics, progress and perspectives, Phys. Chem. Chem. Phys. PCCP 16 (2014) 16349–16366.
[48]B. Christgen, K. Scott, J. Dolfing, I.M. Head, T.P. Curtis, An evaluation of the performance and economics of membranes and separators in single chamber microbial fuel cells treating domestic wastewater, PLoS One 10 (2015) e0136108.
[49] A. Carmona-Martinez, R. Lacroix, S. Da Silva, E. Trably, N. Bernet, On the modeling of the surface area that actually contributes to the current density produced in microbial electrochemical systems, in: EU-ISMET, 2nd European Meeting of the International Society for Microbial Electrochemistry and Technology, Alcala de Henares, Spain, 2014.
[50]H. Yan, H.M.D. Yates, J.M. Regan, Effects of constant or dynamic low anode potentials on microbial community development in bioelectrochemical systems, Appl. Microbiol. Biotechnol. 99 (2015) 9319–9329.
[51]A.S. Commault, G. Lear, M.A. Packer, R.J. Weld, Influence of anode potentials on selection of Geobacter strains in microbial electrolysis cells, Bioresour. Technol. 139 (2013) 226–234.