ÉCOLE DE TECHNOLOGIE SUPÉRIEURE UNIVERSITÉ DU QUÉBEC
ESTIMATION MODEL FOR SOFTWARE TESTING
BY
Jayakumar KAMALA RAMASUBRAMANI
THESIS PRESENTED TO
ÉCOLE DE TECHNOLOGIE SUPÉRIEURE
IN PARTIAL FULFILLMENT OF THE REQUIREMENTS FOR THE DEGREE OF DOCTOR OF PHILOSOPHY
Ph.D.
MONTREAL, 19 JULY, 2016.
This Creative Commons licence allows readers to download this work and share it with others as long as the author is credited. The content of this work may not be modified in any way or used commercially.
BOARD OF EXAMINERS THIS THESIS HAS BEEN EVALUATED BY THE FOLLOWING BOARD OF EXAMINERS
Prof. Alain Abran, Thesis Supervisor,
Department of Software and Information Technology Engineering, École de technologie supérieure.
Prof. Claude Thibeult, Jury President, Department of Electrical engineering, École de technologie supérieure.
Prof. Abdel Gherbi, Member of the Jury, Department of Software and IT Engineering, École de technologie supérieure.
Prof. Hamid Mcheick, External Member of the Jury, Université du Québec, Chicoutimi.
THIS THESIS WAS PRESENTED AND DEFENDED
IN THE PRESENCE OF A BOARD OF EXAMINERS AND THE PUBLIC ON JULY 19, 2016
ACKNOWLEDGMENTS
I would like to first thank the management and administration of École de technologie supérieure, for admitting me as a Ph.D. student.
I am thankful to Professor Alain Abran, the co-inventor of COSMIC functional sizing method, for taking me as his student and guiding me throughout the research work. He never got tired of reviewing my work at various stages, put up with my questions and provided innumerable suggestions to progress towards completion of this work. Charles Symons, co-inventor of COSMIC and inventor of Mark II Function Point reinforced my conviction to choose the topic for research, to whom I remain thankful.
My mother Smt. Kamala and father Sri. Ramasubramani are the spirit behind my activities; it is their never ending love and blessings that continuously motivated me through the research work. Kalpana, my wife who is an integral part of my life, not only sacrificed her personal time and energy to make me complete this work, but also ensured that I was enthusiastic throughout, in spite of the various moments of ups and downs.
No doubt, the time I spent with my daughter Lakshna and son Amitesh during the period of research went down substantially when they as adolescents needed me the most. Their youthfulness brought in freshness to my life and work. My brother and sisters wanted to see me achieve my dream of acquiring Ph.D and supported in all possible ways.
I am thankful to the Investors and Board of Amitysoft Technologies who appreciated time spent on the research besides managing the affairs of the company. I would like to acknowledge my colleagues at Amitysoft, especially Srikanth Aravamudhan who served as a sounding board to discuss various ideas related to this research, and Ganapathi who shared part of my workload so that I could spare time for this research. I am thankful to my friends Sriram who helped me with statistical analyses and Susan who extended a professional hand in editing this document.
Without the connect with the Almighty, it would not have been possible for me to reach this stage and I am indebted to Him for ever.
MODÈLE D'ESTIMATION POUR LESTESTS DE LOGICIELS
Jayakumar KAMALA RAMASUBRAMANI
SOMMAIRE
Tester les applications logicielles et en assurer la conformité sont devenus une partie essentielle de la gouvernance des organisations en technologies de l'information (TI). Les tests du logiciel ont évolué vers une spécialisation avec leurs propres pratiques et connaissances.
L’estimation des tests consiste en l'estimation de l'effort pour un niveau particulier de tests, en utilisant diverses méthodes, outils et techniques. Une estimation incorrecte conduit souvent à une quantité inadéquate de tests qui, à son tour, peut conduire à des défaillances des systèmes logiciels quand ils sont déployés dans les organisations.
A partir d’un état de l’art sur l'estimation des tests de logiciel, un cadre unifié pour l’estimation des tests de logiciels a été proposé. Grâce à ce cadre, divers modèles d'estimation détaillés ont été construits pour les tests fonctionnels.
La base de données ISBSG a été utilisée pour explorer l'estimation des tests de logiciels. L'analyse des données ISBSG a révélé trois schémas de productivité de tests représentant les économies d'échelle sur la base desquelles ont été étudiées les caractéristiques des projets correspondants. Les trois groupes de projets liés aux trois modèles de productivité sont jugés statistiquement significatifs et caractérisés par domaine d'application, la taille de l'équipe, la durée de projet et la rigueur de la vérification et la validation effectuée au cours du développement.
Au sein de chaque groupe de projets, les variations dans les efforts de test peuvent être expliquées par les activités menées au cours du processus de développement et adoptées pour les tests, en plus de la taille fonctionnelle. Deux nouvelles variables indépendantes, la qualité des processus de développement (DevQ) et la qualité des processus de test (TestQ) ,ont été identifiées comme influentes dans les modèles d'estimation.
Des portfolios de modèles d'estimation ont été construits pour différents ensembles de données en utilisant des combinaisons des trois variables indépendantes. Au moment de l'estimation, un estimateur peut choisir le groupe de projets par la cartographie des caractéristiques du projet à estimer et en les comparant aux attributs du groupe de projets afin de choisir le modèle le plus proche.
La qualité de chacun des modèles a été évaluée selon les critères établis tels que R2, R2 Adj,
MRE, MedMRE, Maslow’s Cp. Les modèles ont été comparés à l'aide de leur performance prédictive en utilisant les nouveaux critères proposés dans ce travail de recherche. De plus, les modèles d'estimation de test à l'aide de la taille fonctionnelle mesurée en points de fonction COSMIC présentaient une meilleure qualité et ont abouti à une estimation plus précise par rapport à la taille fonctionnelle mesurée en points de fonction IFPUG.
Un prototype de logiciel a été développé en utilisant un langage statistique "R" de programmation intégrant les portefeuilles de modèles d'estimation. Cet outil d'estimation de test peut être utilisé par l'industrie et le milieu universitaire pour estimer les efforts de test.
Mots clés: génie logiciel, mesures de logiciels, la taille fonctionnelle, tests de logiciel, Test
fonctionnel, Modèle d'estimation, estimation des tests, points de fonction COSMIC, points de fonction IFPUG, outil pour l’estimation des tests étalonnage.
ESTIMATION MODEL FOR SOFTWARE TESTING
Jayakumar KAMALA RAMASUBRAMANI
ABSTRACT
Testing of software applications and assurance of compliance have become an essential part of Information Technology (IT) governance of organizations. Over the years, software testing has evolved into a specialization with its own practices and body of knowledge.
Test estimation consists of the estimation of effort and working out the cost for a particular level of testing, using various methods, tools, and techniques. An incorrect estimation often leads to inadequate amount of testing which, in turn, can lead to failures of software systems when they are deployed in organizations
This research work has first established the state of the art of software test estimation, followed by the proposal of a Unified Framework for Software Test Estimation. Using this framework, a number of detailed estimation models have been designed next for functional testing.
The ISBSG database has been used to investigate the estimation of software testing. The analysis of the ISBSG data has revealed three test productivity patterns representing economies and diseconomies of scale, based on which the characteristics of the corresponding projects were investigated. The three project groups related to the three productivity patterns were found to be statistically significant, and characterised by application domain, team size, elapsed time, and rigour of verification and validation throughout development.
Within each project group, the variations in test efforts could be explained by the activities carried out during the development and processes adopted for testing, in addition to functional size. Two new independent variables, the quality of the development processes (DevQ) and the quality of testing processes (TestQ), were identified as influential in the estimation models. Portfolios of estimation models were built for different data sets using combinations of the three independent variables. At estimation time, an estimator could choose the project group by mapping the characteristics of the project to be estimated to the attributes of the project group, in order to choose the model closest to it.
The quality of each model has been evaluated using established criteria such as R2, Adj R2,
MRE, MedMRE and Maslow’s Cp. Models have been compared using their predictive performance, adopting new criteria proposed in this research work. Test estimation models using functional size measured in COSMIC Function Points have exhibited better quality and resulted in more accurate estimation, compared to functional size measured in IFPUG Function Points.
A prototype software is now developed using statistical “R” programming language, incorporating portfolios of estimation models. This test estimation tool can be used by industry and academia for estimating test efforts.
Key Words: Software Engineering, Software Measurements, Functional Size, Software
Testing, Functional Testing, Estimation Model, Test Estimation, COSMIC Function Point,
IFPUG Function Point, Test Estimation Tool, Benchmarking.
TABLE OF CONTENTS
Page
INTRODUCTION ... 21
0.1 Context of Software Testing and Estimation ... 21
0.2 Processes and Test Types ... 21
0.3 Early Perspectives on Testing and Effort Estimation ... 22
0.4 Implications for the Industry & Economy ... 23
0.4.1 Impacts of Testing and Software Defects ... 23
0.4.2 Potential of a Better Estimation Model for testing ... 25
0.5 Motivation for the Research ... 26
0.6 Organiztion of the Thesis ... 27
CHAPTER 1 RESEARCH GOAL, OBJECTIVES AND METHDOLOGY ... 29
1.1 Research Goal ... 29 1.2 Research Objectives ... 29 1.3 Research Approach ... 29 1.3.1 Research Disciplines ... 29 1.3.1.1 Software Testing ... 30 1.3.1.2 Software Engineering ... 31 1.3.1.3 Metrology ... 32 1.3.1.4 Statistics ... 33 1.3.2 Research Methodology ... 34 1.3.2.1 Literature Study ... 35
1.3.2.2 Designing an Unified Framework for Test Estimation ... 36
1.3.2.3 Designing Estimation Models for Functional Testing ... 37
1.3.2.4 Evaluating the Estimation Models ... 38
1.3.2.5 Developing a Prototype Estimation Tool ... 39
CHAPTER 2 LITERATURE STUDY ... 41
2.1 Evaluation of Test Estimation Techniques ... 41
2.1.1 Categories of Techniques ... 41
2.1.2 Model Evaluation Criteria ... 42
2.1.3 Criteria for Evaluation of Test Estimation Techniques ... 44
2.2 Test Estimation Techniques ... 45
2.2.1 Judgement and Rule of Thumb ... 45
2.2.3 Factors and Weights ... 48
2.2.4 Size-based Estimation Models ... 50
2.2.4.1 Test Size-based Estimation ... 50
2.2.4.2 AssessQ Model ... 51
2.2.4.3 Estimating test volume and effort ... 52
2.2.5 Neural Network and Fuzzy Models ... 53
2.2.5.1 Artificial Neural Network (ANN) Estimation Model ... 53
2.2.5.2 Fuzzy Logic Test Estimation Model ... 54
2.3 Other Literature of Interest on Test Estimation ... 55
2.3.1 Functional Testing ... 55
2.3.2 Non-functional Testing ... 56
2.3.3 Fuzzy Logic Estimation ... 57
2.3.4 Model-driven Testing ... 58
2.3.5 Agile Testing ... 59
2.3.6 Service Oriented Architecture and Cloud based Technologies ... 60
2.3.7 Automated testing ... 60
2.4 Summary ... 61
CHAPTER 3 PROPOSED UNIFIED FRAMEWORK FOR SOFTWARE TEST ESTIMATION ... 63
3.1 Introduction ... 63
3.2 Structure of the Framework ... 63
3.2.1 Functional Testing ... 64
3.2.2 Non-functional Testing ... 65
3.2.3 Modification Testing ... 65
3.2.4 Test Automation ... 65
3.2.5 Mapping Framework Components to ISO Standards ... 66
3.3 Approach to Measurements for Estimation ... 67
3.3.1 Functional Testing ... 68
3.3.2 Non-functional Testing ... 68
3.3.3 Modification Testing ... 69
3.3.4 Test Automation ... 70
3.4 Approaches for Test Effort Estimation ... 70
3.4.1 Functional Testing ... 70
3.4.2 Modification Testing ... 72
3.4.3 Non-functional Testing ... 72
3.4.4 Functional Test Automation ... 73
CHAPTER 4 ESTIMATION MODEL FOR FUNCTIONAL TESTING ... 75
4.1 Overview ... 75
4.2 ISBSG Data for Estimation Model ... 76
4.3 Data Selection ... 77
4.3.1 Criteria for data selection ... 77
4.3.1.1 Data Quality ... 77 4.3.1.2 Data Relevance ... 78 4.3.1.3 Data Suitability ... 78 4.3.1.4 Data Adequacy ... 79 4.3.2 Data Preparation ... 79 4.4 Data Analysis ... 80 4.4.1 Strategy ... 80
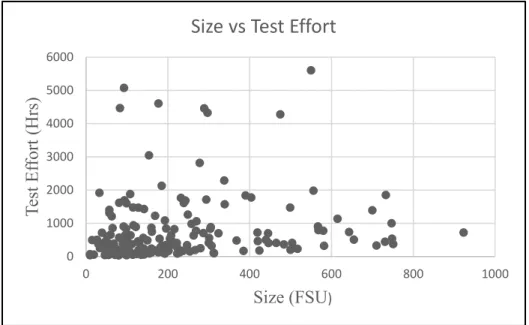
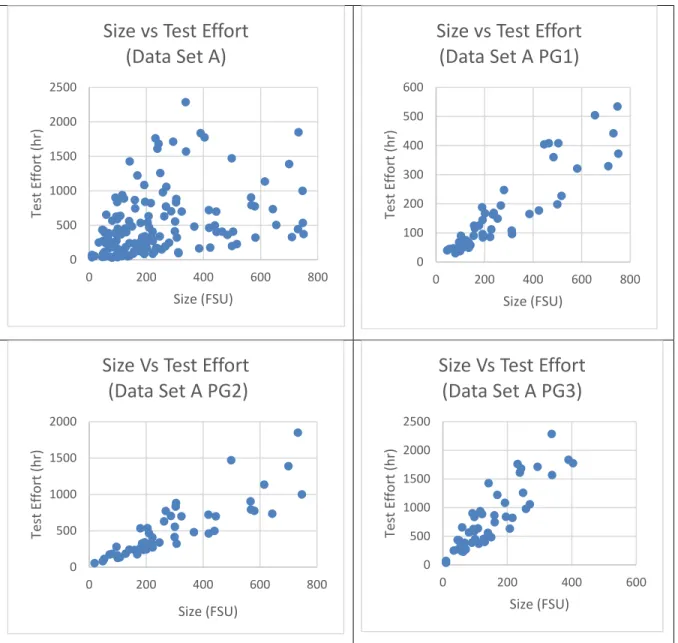
4.4.2 Identification of Test Productivity Levels ... 81
4.4.3 Identification of Candidate Characteristics of Projects ... 83
4.5 Identification of Independent Variables ... 87
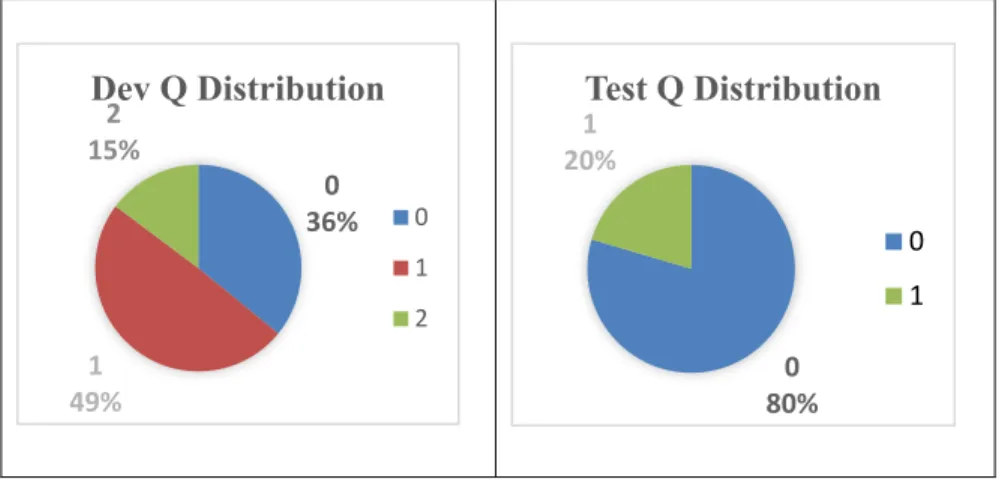
4.5.1 Development Process Quality Rating (DevQ) ... 89
4.5.2 Test Process Quality Rating (TestQ) ... 90
4.5.3 Analysis of DevQ and TestQ ... 91
4.6 Portfolio of Estimation Models for Functional Testing ... 93
4.6.1 Estimation Models – Data Set A (N = 142) ... 93
4.6.2 Estimation Models - Data Set B (N=72) ... 96
4.6.3 COSMIC Function Point Estimation Models – Data Set C (N=82) ... 98
4.6.4 IFPUG Function Point Estimation Models – Data Set D (N = 60) ... 99
4.6.5 Model Selection for Estimation ... 99
4.7 Evaluation of Estimation Models ... 103
4.7.1 Quality of Estimation Models ... 103
4.7.2 Predictive Performance of Models ... 105
4.7.3 Comparison of Performance of Models ... 107
4.7.3.1 Comparison of Models in Portfolio A ... 107
4.7.3.2 Comparison of Size Based Models ... 108
4.7.3.3 Comparison of Models in Portfolios A and B ... 110
4.7.3.4 Comparison of COSMIC and IFPUG Models ... 112
4.8 Estimation Tool ... 113
CONCLUSION ... 115
APPENDIX II MAPPING OF V & V RIGOUR TO ISBSG DATA FIELDS ... 131
APPENDIX III PROJECT CHARACTERISTICS ANALYSIS - DATA SET B, C & D ... 133
APPENDIX IV MAPPING OF DEVQ, TESTQ RATINGS TO ISBSG DATA FIELDS... 139
APPENDIX V ANALYSIS OF DEVQ AND TESTQ FOR DATA SET B, C & D ... 143
APPENDIX VI REGRESSION MODEL FIT ANALYSIS ... 157
APPENDIX VII DESIGN OF A PROTOTYPE TOOL FOR ESTIMATION ... 163
LIST OF TABLES
Table 0.1 Cost Impacts of Defective Software Reported in 2011 – 12 ... 24
Table 1.1 The Knowledge Areas in the SWEBOK Body of Knowledge... 31
Table 1.2 Inputs, Steps and Outputs of Phase 1 ... 35
Table 1.3 Inputs, Steps and Outputs of Phase 2 ... 36
Table 1.4 Inputs, Steps and Outputs of Phase 3 ... 38
Table 1.5 Inputs, Steps and Outputs of Phase 4 ... 39
Table 2.1 Evaluation of Test Estimation Techniques ... 45
Table 2.2 Common Types of NFR Testing ... 56
Table 3.1 Unified Framework cross referenced to ISO Standards ... 66
Table 3.2 Unified Framework – Measurements & Estimation Approach ... 74
Table 4.1 V & V Rigour Rating Scheme ... 84
Table 4.2 Analysis of Project Characteristics – Data Set A ... 85
Table 4.3 Statistical Significance of Attributes in Data Set A (N = 142) ... 86
Table 4.4 Characteristics of Project Groups ... 87
Table 4.5 Statistical Significance of Project Groups ... 87
Table 4.6 Correlation Coefficients for Size Vs Test Effort ... 89
Table 4.7 Rating for Development Process (DevQ) ... 90
Table 4.8 Rating for Test Process (TestQ) ... 90
Table 4.9 Test of Significance for Independent variables ... 93
Table 4.10 List of Models in Portfolio A ... 94
Table 4.11 Estimation Models - Portfolio A (N = 142) ... 96
Table 4.12 List of Estimation Models - Portfolio B ... 97
Table 4.13 Estimation Models Portfolio B (N = 72) ... 97
Table 4.15 Estimation Models Portfolio D (N = 60) ... 99
Table 4.16 Project Size Classification ... 100
Table 4.17 Evaluation of Models in Portfolios A, B, C and D ... 103
Table 4.18 Prediction Performance of Estimation Models ... 106
Table 4.19 Predictability of Portfolio A Models... 107
Table 4.20 Predictability of Size Based Models across Portfolios ... 108
LIST OF FIGURES
Figure 1.1 Research Disciplines ... 30
Figure 1.2 Measurement Context Model ... 33
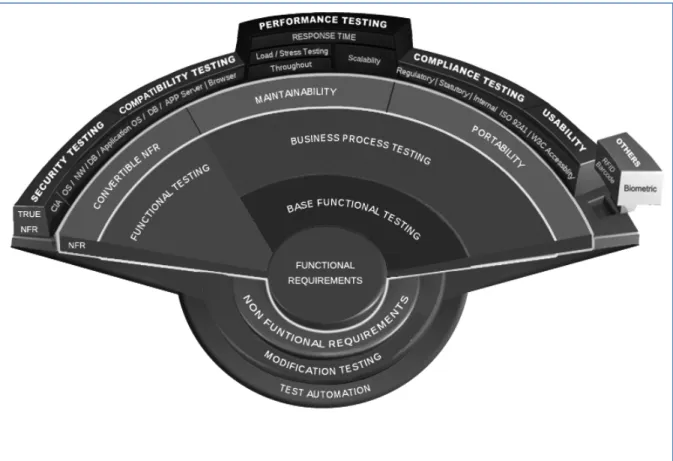
Figure 3.1 Structure of the Unified Framework ... 64
Figure 4.1 Scatter Diagram: Size versus Test Effort (N = 170) ... 81
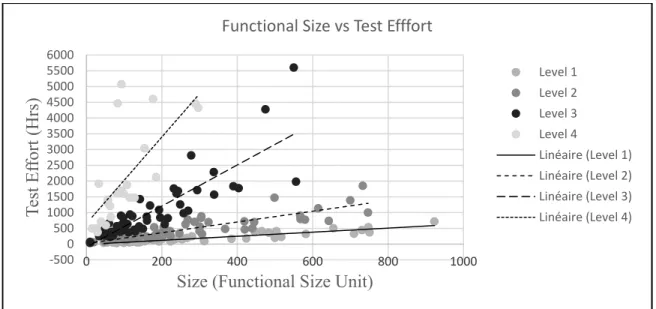
Figure 4.2 Multiple Data groups representing different economies of scale (N=170) . 82 Figure 4.3 Scatter Diagrams for Size vs Test Effort: Data Set A, PG1, PG2 and PG3 ... 88
Figure 4.4 Distribution of DevQ and TestQ Ratings (N = 142) ... 91
Figure 4.5 Box Plots of DevQ Ratings 0, 1 and 2 ... 92
Figure 4.6 Box Plots of TestQ Ratings 0 and 1 ... 92
Figure 4.7 Project Group Selection Decision Tree ... 101
Figure 4.8 Predictability Comparison of Data Set A Models ... 108
Figure 4.9 Predictability Comparison of Size Based Models ... 110
Figure 4.10 Predictability Comparison of Data Set A and B Models ... 111
LIST OF ACRONYMS AND ABREVIATIONS CMMI Capability Maturity Model Integration
COSMIC Common Software Measurements International Consortium
DevQ Development Process Quality Rating
ERP Enterprise Resource Planning
FSM Functional Size Method
FUR Functional User Requirements
KLOC Kilo Lines of Code
NFR Non Functional Requirements
IFPUG International Function Point Users Group
ISBSG International Software Benchmarking and Standards Group
OCL Object Constraint Language
PG Project Group
PSP Personal Software Process
SPICE Software Process Improvement and Capability Determination
SWEBOK Software Engineering Body of Knowledge
TDR Test Delivery Rate
TestQ Test Process Quality Rating
TTCN-3 Testing and Test Control Notation
UML Unified Modelling Language
INTRODUCTION
0.1 Context of Software Testing and Estimation
Software Testing, as defined by the Guide to the SWEBOK (Bourque et al., 2014), consists of the ‘dynamic’ verification of the behaviour of a program on a ‘finite’ set of test cases. These test cases are suitably selected from the usually ‘infinite execution domain,’ against ‘expected behaviour’.
Testing is also part of software maintenance and operations, besides development. Testing activities have to be managed effectively and quantitatively, in order to meet the intended purpose.
Software testing is quite challenging, technically and managerially, for the following reasons: 1. Software testing is carried out against Functional User Requirements (FUR), where all the operational scenarios cannot be identified due to the complexity barrier. Expected behaviors must be tested in an infinite execution space (Beizer, 2007).
2. There is a lack of consistency in the factors to be considered for Non-functional Requirements (NFR) (COSMIC, 2015). It is challenging to plan for testing with incompletely described NFR because it increases the odds that the NFR testing process will be incomplete.
3. There is no scientific approach to estimating efforts for all the aspects of software testing. The existing estimation approaches, such as judgment based, factors and ratings-based methods and functional size-based methods are characterized by several limitations (Refer Section 2.2).
0.2 Processes and Test Types
The International Standard ISO 29119 on testing (ISO/IEC/IEEE 29119 – Part 1, 2013; ISO/IEC/IEEE 29119 – Part 2, 2013; ISO/IEC/IEEE 29119 – Part 3, 2013; ISO/IEC/IEEE 29119 – Part 4, 2015) subdivides the test process into Project Test Process and Test Sub-Process, as follows:
a. Component, Integration, System and Acceptance Testing are different levels/ phases of the Project Test Process.
b. Performance Testing, Security Testing and Functional Testing are different types of testing referred to as Test Sub-Processes.
The Project Test Process involves and Dynamic Test Processes and Test Management Processes:
a. The Dynamic test process consists of test design, preparing test scripts and test data, setting up test environment, executing tests and reporting test results.
b. Management processes involve planning, monitoring and control of testing activities under dynamic testing process.
This ISO 29119 Standard provides a framework to identify specific activities that would constitute the scope of testing projects. Tasks to be undertaken for testing and estimate of effort for executing those tasks can be derived based on the scope.
0.3 Early Perspectives on Testing and Effort Estimation
One of the early books on Software Testing, ‘Software Testing Techniques’ by Borris Beizer (Beizer, 2007), documents the goals for testing. Testing and designing of tests, as parts of quality assurance, should also focus on bug prevention apart from discovering bugs. Beizer makes a practical suggestion:
“The ideal test activity would be so successful at bug prevention, that actual testing would be unnecessary. Unfortunately, we can’t achieve this ideal. Despite our effort there will be bugs because we are human. To the extent that testing fails to reach its primary goal, bug prevention, it must reach its secondary goal, bug discovery.”
Beizer refers to a ‘Complexity Barrier’ where software complexities grow to the limits of our ability to manage the complexity. In the business context, where time-to-market or on-time delivery with assured quality is a most important success criterion, demands on software testing are two-fold:
1. Test everything that carries risks of failure. 2. Minimize efforts required for testing.
The two-component testing strategy advocated by Willam Perry (Perry, 2006), another pioneer in software testing, consists of:
1. ‘Test Factors’ that need to be addressed to reduce the risk.
2. ‘Test Phase in the Life Cycle’ in which the test factors are to be considered.
Test factors are related to a number of generic functional requirements, non-functional requirements and technical / quality requirements. Perry has suggested a parametric model to estimate staff-hours using:
1. The functional size, measured in terms of function points or lines of code, further adjusted considering project specific characteristics.
2. The total effort estimate is distributed next to project phases, based on the ‘percentage efforts distribution’ norm established using historical data.
To meet the conflicting demands on software testing, testers must be able to use effective estimation techniques. Managing software testing without quantitative measures increases the odds of failure. For example, cost and time overruns potentially result in financial and legal consequences. Estimation techniques should be based on a sound mathematical basis, and verifiable to the satisfaction of all stakeholders (Abran, 2015).
0.4 Implications for the Industry & Economy 0.4.1 Impacts of Testing and Software Defects
World Quality Report 2015 – 16 (Capgemini, 2016) observes that ‘quality assurance and testing’ have failed to keep up with business needs; this is inferred from the IT spend on these activities outstripping predictions every year. This report estimates that the proportion of the IT spend allocated to ensuring application quality and performance will continue to rise, from the current figure of 35%, to reach 40% by 2018. Gartner’s forecast on enterprise IT spending
across all industry market segments in 2016 is US $ 2.77 trillion (Gartner, 2015). These two figures from Capgemini and Gartner indicate the amount of budget involved in quality and testing of IT solutions.
There are several instances of software failures that have resulted in major economic impacts, including loss of human lives. A study by the National Institute of Standards and Technology - USA (Tassey, 2002) estimated the losses to the US economy alone at close to US$ 60 billion, due to defects in software applications in the Manufacturing and Service sectors. Some of the incidents, reported due to defects in Enterprise Software applications, together with their cost impact, are listed in Table 0.1 for the 2011-2012 reporting period. This table lists details such as the names of the organizations, the related defective software and the direct cost impact.
Table 0.1 Cost Impacts of Defective Software Reported in 2011 – 12
# Company Defective Software Cost (mil) Source 1 RBS C7A batch Process £125 http://www.computerweekly.com/news/22401608 60/RBS-computer-problem-costs-125m 2 AXA Rosenburg Group Portfolio management $242 http://www.advfn.com/commodities/Commoditi esNews.asp?article=46297248&headline=axa- rosenberg-to-pay-242-million-over-software-glitch 3 Knight’s Capital Automatic market orders $440 http://www.bloomberg.com/bw/articles/2012- 08-02/knight-shows-how-to-lose-440-million-in-30-minutes 4 Telecom Company, New Zealand Customer Billing $2.7 www.comcom.govt.nz/dmsdocument/10828
There are several incidents related to defects and consequent software failures, which are periodically reported by the press. However, the economic impacts are not disclosed for most
the cases. Management processes are critical for planning and delivering testing projects successfully. It is estimated that the annual cost of poor performance of software suppliers in North America and in Europe is over US$ 200 billion (Symons, 2010). Comparing this to the approximately US$ 200 billion of losses faced by banks in the 2008 credit crisis which was a one-time event, it is apparent that the recurring annual losses due to poor performance in the software industry is multi-fold.
The poor performance of software in this context refers to cost overruns, including cancelled projects or projects finished but not deployed. A causal chain links poor performance to measurements and estimation practices (Symons, 2010). The Project Management Institute (PMI) has identified ‘Estimation’ as a key area in the Project Management Body of Knowledge (PMI, 2013) for successful delivery of projects.
In order to tackle performance and poor management issues, the state of Victoria in Australia has designed and implemented the ‘SouthernScope’ project contracting methodology (SouthernSCOPE, 2012) which resulted in less than 10% cost overrun after implementing functional size-based estimation and costing of projects. This can be compared to 84% cost overrun that prevailed when traditional methods were used (Symons, 2010).
0.4.2 Potential of a Better Estimation Model for Testing
Software projects go through the ‘testing phase’, which is a key phase for controlling defects within the overall development life cycle. Inadequate testing leaves defects in the software used in production, leading to failures and consequent financial impact.
A better testing process can contribute to the reduction in the number of defects. The US Study (Tassey, 2002), points out that improvements in the testing infrastructure could result in US$22 billion saving by reducing the defects by 50%.
Improved estimation techniques can aid better budgeting and resourcing of software testing. Performance measurements using International benchmarks can enable the organizations improve their test processes to become more competitive.
0.5 Motivation for the Research
Software testing has evolved into a specialization with its own practices and body of knowledge (ISTQB, 2011; QAI, 2006). Over the years, software testing has become an industry of its own, with the emergence of independent testing services firms and IT services companies in India (such as Cognizant, TCS, Accenture) establishing testing services as a separate business unit.
Test estimation consists of the estimation of effort and cost for a particular level of testing, using various methods, tools, and techniques. Test estimation techniques have often been derived from generic software development estimation techniques (Chemutri, 2012), in which testing figures as one of the phases of the software development life cycle. The incorrect estimation of testing effort often leads to an inadequate amount of testing that, in turn, can lead to failures of software systems when they are deployed in organizations. There are no international benchmarks available to verify test effort estimates.
Existing estimation techniques such as judgment based, test estimation specific methods and functional size methods used for estimating test efforts are hampered by several arbitrary factors and they lack of compliance to fundamentals of metrology (Abran, 2010).
The functional size of software is found to be a significant influencer in the estimation of development effort (Abran, 2015). Even those techniques that use functional size for estimation models do not take into consideration the mathematically correct functional size as a parameter (Refer Section 2.2).
There is a growing amount of work carried out on the use of the functional sizing method COSMIC – ISO 19761 (COSMIC, 2003; ISO, 2011), for estimation and performance measurements of software development projects. There are several complex approaches taken by the researchers for estimation, while simple and practical approaches to estimation (Abran, 2015) governed by metrology principles can fulfill the needs in industry, academia and research.
The motivation for the research arises from:
Difficulties in estimating the effort for software testing.
Opportunities emerging out of recent development in functional sizing methods. Lean approaches towards building estimation models.
The research strategy will involve adapting innovations from related disciplines, to come out with practical estimation models for software testing. These estimation models will be designed to substantially overcome the limitations of existing estimation techniques. Additionally, they would comply with metrology, be simple to understand and use by the industry and academia.
0.6 Organization of the Thesis
Chapter 1 presents the research goal, objectives and the methodology adopted. This chapter also details out the research disciplines involved and the systematic steps followed as per the methodology.
Chapter 2 provides an evaluation of existing test estimation techniques followed by detailed discussions of each of the categories, analysis of their strengths and weaknesses followed by comments on experimental studies. A summary of the literature study with limitations of existing techniques is part of this chapter.
Chapter 3 proposes an ‘Unified Framework for Software Test Estimation’ mapped to relevant ISO standards along with proposals for measures and approaches for test estimation models for software testing.
Chapter 4 details out the estimation model for functional testing, consisting of details of data selection and analysis, design of portfolio of estimation models, their evaluation and comparison of predictive performance. This chapter also documents the design of a prototype tool to automate the estimation model for functional testing.
How this research work meets the objectives set initially, contributions arising out this work, limitations and potential for future work are presented as a part of the Conclusion chapter.
CHAPTER 1
RESEARCH GOAL, OBJECTIVES AND METHDOLOGY
1.1 Research Goal
The long term goal of this research project is to develop a practical solution for estimating software testing effort, for all types of testing. The immediate goal is to focus on designing estimation model for estimating the effort for functional testing.
1.2 Research Objectives
The objectives selected for this research project are to design an estimation model to: a. Estimate the effort for functional testing. This comprises:
• Identifying the 1 to 3 factors that contribute most to the relationship with effort for functional testing.
• Arriving at a model that can be used during the early stages of software testing. b. Serve the needs for benchmarking and measuring the performance of software testing
projects.
c. Be capable of automation, which can be deployed as an estimator’s tool for use by industry and academia.
1.3 Research Approach
1.3.1 Research Disciplines
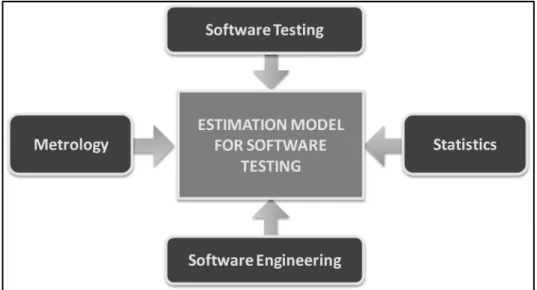
The research approach selected to address the problem involves combining knowledge from four disciplines (Figure 1.1).
a. Software Testing b. Software Engineering c. Metrology
d. Statistics
Figure 1.1 Research Disciplines
1.3.1.1 Software Testing
Software Testing has evolved into a discipline along with the development of software development methodologies: its evolution has passed through the following phases (Beizer, 2007):
• Phase 0: There is no difference between testing and debugging. Other than in support of debugging, testing has no purpose.
• Phase 1: The purpose of testing is to show that the software works.
• Phase 2: The purpose of testing is to show that the software does not work.
• Phase 3: The purpose of testing is not to prove anything, but to reduce the perceived risk of not working to an acceptable value.
• Phase 4: Testing is not an act. It is a mental discipline that results in low-risk software without much testing effort.
The two key words in Phase 4 of the evolution of software testing are ‘low-risk’ and ‘testing effort’. Analysing the product risks and designing and executing tests in such a way that effort for testing is minimal are the key characteristics of current phase. Estimating the effort required for testing and measuring performance of testing can provide a quantitative basis for managing testing projects.
1.3.1.2 Software Engineering
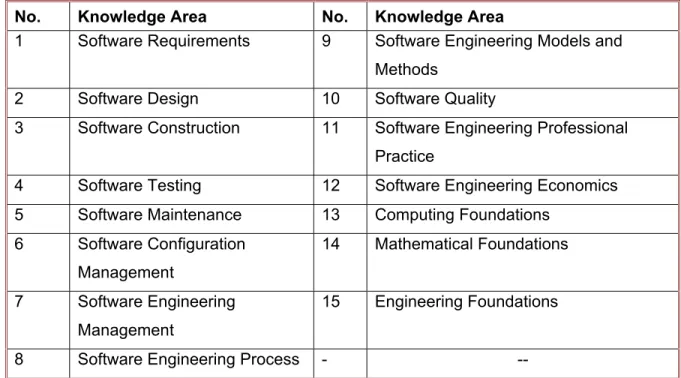
Software Testing is a part of software engineering. The ‘Guide to the SWEBOK’ (Bourque et al., 2014) identifies software testing as one of the knowledge areas related to software engineering (Table 1.1).
Table 1.1 The Knowledge Areas in the SWEBOK Body of Knowledge
No. Knowledge Area No. Knowledge Area
1 Software Requirements 9 Software Engineering Models and Methods
2 Software Design 10 Software Quality
3 Software Construction 11 Software Engineering Professional Practice
4 Software Testing 12 Software Engineering Economics 5 Software Maintenance 13 Computing Foundations
6 Software Configuration Management 14 Mathematical Foundations 7 Software Engineering Management 15 Engineering Foundations
8 Software Engineering Process - --
Estimation of efforts for software testing cannot be looked into isolation, without considering software life cycle aspects and measurements related to various aspects of software engineering. While software testing is the key knowledge area relevant to this research work, other knowledge areas such as Software Engineering Management, Software Engineering Process, Software Engineering Models and Methods, Software Quality, Software Engineering Professional Practice, Software Engineering Economics and Mathematical Foundations contribute to this research work. This research work explored the literature on software engineering, in order to establish the state of the art of software test effort estimation.
A major problem in software engineering is the passing on of some trivial rumour from one person to the next, until it has become distorted and blown out of all proportion. The outcome is that it becomes entrenched as ‘fact’, claimed to be supported by ‘figures’, and attains an elevated status despite being merely anecdotal (Bossavit, 2015). Appealing to authority overlies such so-called ‘facts’ and ‘figures’; this is the key guideline for this research work, in order to differentiate the ‘feel good’ aspects from the ‘feel right’ approach to developing estimation models.
1.3.1.3 Metrology
Metrology deals with rigorous definitions of measurement standards and their instrumentation. This discipline helps to tackle the disparity in the units of measurements, in support to various derived measures and models.
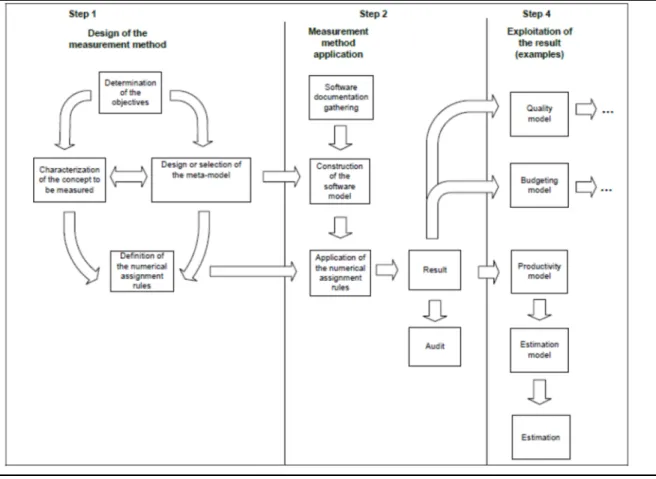
Metrology related concepts from the ISO Vocabulary on Metrology (VIM, 2007) have been adopted as the basis for measurement terminology for future ISO standards on software measurement. Information technology and computer science have not been subjected to the metrological scrutiny that other sciences have (Gray, 1999; Kaner, 2013). According to the principles of metrology, the term measurement has to be used in the context of ‘measurement method’, ‘application of a measurement method’ or ‘measurement results’. They correspond to three steps (Figure 1.2) in the measurement context as illustrated in the Measurement Context Model from (Abran, 2010):
a. Design of the measurement method: before measuring, it is necessary to either select a measurement method if one already exists, or design one if an existing method does not fit the need.
b. Application of the measurement method: once the measurement method has been designed or selected, its rules are applied to a piece of software to obtain a specific measurement result.
c. Exploitation of the measurement results: the measurement result is exploited in a quantitative or qualitative model, usually in combination with other measurement results of different types.
Figure 1.2 Measurement Context Model (Taken from Abran, (2010))
While metrology is mature in other disciplines, it is yet to become a norm in software engineering. This has resulted in several flaws (Abran, 2010) in the existing ‘software metrics’ used in software engineering.
This research project ensures the application of measurement principles to arrive at soundly-structured estimation models.
1.3.1.4 Statistics
Statistics is broadly divided into two branches – descriptive and inferential statistics (Levine, 2013):
a. Descriptive statistics deal with quantitative data and the methods for describing them. This is the most familiar branch of statistics used in everyday life, such as in social services, business, health care and sports. For example, measures of central tendency and measures of spread are used to describe data.
b. Inferential statistics make inferences about populations by analyzing data gathered from samples and lead to conclusion from these data. Methods of inferential statistics include testing of hypotheses and estimation of parameters.
This research project uses various data sets to build test estimation models, and hence the correct application of principles and practices of statistics is of paramount importance. Even though basic statistical concepts, such as measures of central tendency, are a foundation to any analysis, there are several statistical techniques available in the process of building an estimation model.
In large data sets, wider deviations are mostly attributable to noise than to information (Taleb, 2012). Hence, if complex models are built, their relevance may become questionable and usage may become difficult. Nassim Nicholas Taleb, noted author of ‘Antifragile’ proposes antifragile models for informed decisions rather than fragile and robust models. The fragile and robust models collapse faster, while antifragile systems can change and evolve.
This research project has come out with portfolios of estimation models for different contexts, rather than attempting one single robust and complex model that can only provide an illusion of stability. It has been observed that, more the small variations in the system, the fewer would be the major surprises (Taleb, 2012). These insights form the backbone of the work carried out in this research.
1.3.2 Research Methodology
The methodology adopted for carrying out this work consists of the following five research phases:
1. Literature study
2. Designing Unified Framework for Test Estimation 3. Designing Estimation Models for Functional Testing
4. Evaluating the Estimation Models 5. Developing a Prototype Estimation Tool
Each phase is briefly described next.
1.3.2.1 Literature Study
A literature study has been conducted to understand the techniques and practices in the estimation for software testing. The study covered estimation techniques used in both industry and academia. The study reviewed the basic approaches to test estimation, including estimation techniques for functional and non-functional testing. Other estimation approaches such as neural network and case based reasoning have also been examined.
Besides, the literature study has also reviewed model-driven testing, agile testing, service oriented architecture and test automation from the perspective of estimation; the presents the state of the art on software test estimation techniques, their strengths and weaknesses. The inputs for this phase, the various steps performed and the outputs from this phase are listed in Table 1.2.
Table 1.2 Inputs, Steps and Outputs of Phase 1
Inputs Steps Outputs
SWEBOK Body of Knowledge ISO 29119 : Software and Systems Engineering – Software Testing
• Study of basic approaches to test estimation
• Estimation techniques for Functional Testing
• Estimation for Non-functional Testing
• Fuzzy, Neural Network and Case-Based Reasoning for Estimation
• Grouping test estimation techniques into
categories .
.
• Evaluation criteria for estimation techniques
Inputs Steps Outputs
ISO 19761 : COSMIC Functional Sizing Method
• Current key developments in Testing
• Review of evaluation criteria for estimation techniques
1.3.2.2 Designing an Unified Framework for Test Estimation
This phase comes out with a Unified Framework for test estimation, based on the learnings from the Literature Study.
The first step for designing the Unified Framework consists of characterizing the various facets of functional and non-functional testing, based on ISO Standards. This results in a qualitative model.
The next step transforms this model into a quantitative model by identifying relevant measures. This quantitative view of the Unified Framework provides a basis for building estimation models for testing. Table 1.3 presents the inputs considered for this phase, the steps performed during the phase and the outputs from this phase.
Table 1.3 Inputs, Steps and Outputs of Phase 2
Inputs Steps Outputs
• ISO 25010 on quality characteristics of software • ISO 29119: Software and Systems Engineering – Software Testing. • Characterizing various facets of Functional and Non-functional Testing • Identification of
measures related to individual aspects of Functional and Non-functional Testing
• Unified Framework for various facets of functional and non-functional testing with qualitative
Inputs Steps Outputs
• ISO 19759: SWEBOK Guide v3
• Software Metrics and Software Metrology book • Developing approaches to building estimation models • Quantitative measures and approaches to estimation.
1.3.2.3 Designing Estimation Models for Functional Testing
The Functional Testing component has been taken up from the Unified Framework, for designing detailed estimation models for functional testing.
Release 12 (2013) of ISBSG database serves as the data source for building the testing estimation model. The following steps are performed during this phase 3:
a. Data preparation from ISBSG by applying relevant filters, to come out with high quality data representing testing.
b. Selection of four different data sets, consisting of relevant samples from a statistical point of view.
c. Data analysis using statistical analysis tools.
d. Identification of relevant variables for project contexts. e. Building a portfolio of context specific estimation models. f. Model selection approach for estimation user.
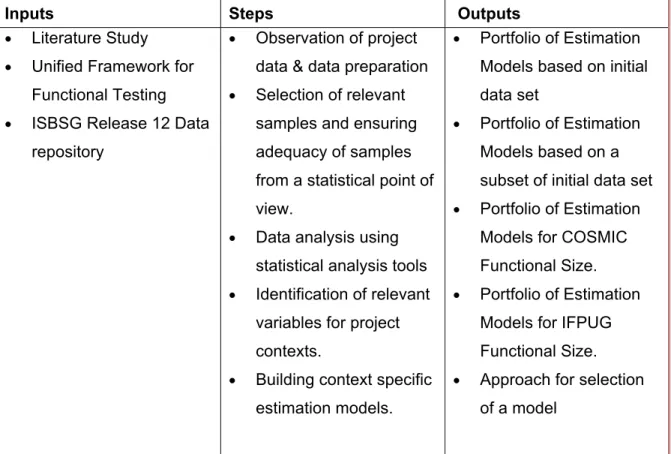
Table 1.4 provides the inputs considered for this phase 3, the various steps performed during the phase and the outputs from the phase.
Table 1.4 Inputs, Steps and Outputs of Phase 3
Inputs Steps Outputs
• Literature Study • Unified Framework for
Functional Testing • ISBSG Release 12 Data
repository
• Observation of project data & data preparation • Selection of relevant
samples and ensuring adequacy of samples from a statistical point of view.
• Data analysis using statistical analysis tools • Identification of relevant
variables for project contexts.
• Building context specific estimation models.
• Portfolio of Estimation Models based on initial data set
• Portfolio of Estimation Models based on a subset of initial data set • Portfolio of Estimation
Models for COSMIC Functional Size. • Portfolio of Estimation
Models for IFPUG Functional Size. • Approach for selection
of a model
1.3.2.4 Evaluating the Estimation Models
The quality of the estimation models for functional testing are evaluated using the criteria followed by the researchers. This phase also compares the performance of COSMIC-based estimation models versus IFPUG-based estimation models.
The inputs considered for this phase, the steps performed during the phase and the outputs are listed in Table 1.5. The conclusions are based on the performance of each of the model.
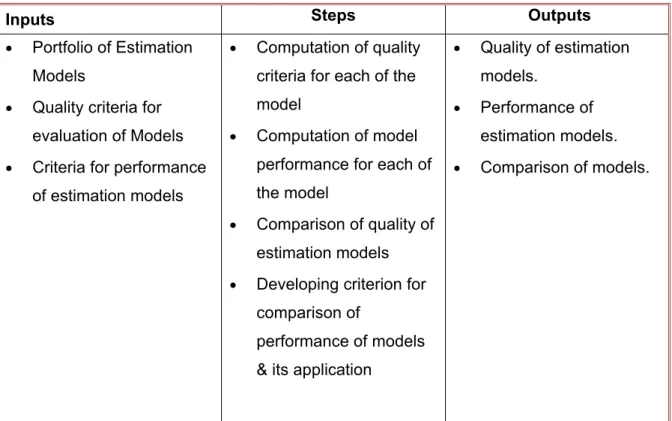
Table 1.5 Inputs, Steps and Outputs of Phase 4
Inputs Steps Outputs
• Portfolio of Estimation Models
• Quality criteria for evaluation of Models • Criteria for performance
of estimation models
• Computation of quality criteria for each of the model
• Computation of model performance for each of the model
• Comparison of quality of estimation models • Developing criterion for
comparison of
performance of models & its application
• Quality of estimation models.
• Performance of estimation models. • Comparison of models.
1.3.2.5 Developing a Prototype Estimation Tool
A prototype tool will be developed, based on the estimation models. The tool will allow the estimation user to choose a project context and, based on the functional size, will provide an estimate for the test effort.
The design of the tool takes into consideration refinements to the estimation model, based on the availability of organization specific project data and regeneration of models, based on the availability of a larger multi-organizational data set.
The basic purpose of the development of this tool is to confirm the possibility of automation of the estimation using the models generated.
CHAPTER 2 LITERATURE STUDY 2.1 Evaluation of Test Estimation Techniques 2.1.1 Categories of Techniques
The test estimation techniques studied can be categorized into the following five groups:
1. Judgment and rules of thumb. 2. Analogy and work breakdown. 3. Factors and weights.
4. Size based estimation models.
5. Fuzzy, Neural and Case based models.
Approaches towards estimation adopted by these techniques can be broadly classified as formula oriented and model oriented while some of the techniques combine both. Several of these techniques identify variables relating to the project and come out with a formula to provide an estimate. They incorporate various heuristics based on the experience of the person proposing the technique. There are no established criteria to evaluate such formulae. Other techniques use those variables to build a statistical model for estimation based on the relationship between the independent variables and the dependent variable. An a-posteriori estimation model representing testing process is built with data from completed projects. The models are subsequently used to estimate new projects. These models can be evaluated using recognized criteria (see section 2.1.2).
New criterion has been proposed to evaluate existing categories of estimation techniques (see 2.1.3). A brief review of several techniques falling into each of the above groups is presented later in section 2.2.
2.1.2 Model Evaluation Criteria
Estimation models are built using past data for prediction in future, and so they are to be evaluated for fitness for the purpose. The criteria used for evaluating the estimation models (Conte, 1986) are:
a. Coefficient of determination (R2)
b. Adjusted R2 (Adj R2)
c. Mean Magnitude of Relative Error (MMRE) d. Median Magnitude of Relative Error (MedMRE)
The coefficient of determination (R2) describes the percentage of variability explained by
the independent variable(s). This coefficient has a value between 0 and 1. A value of R2 close
to 1 indicates that the variability in the response to the independent variable can be explained by the model and hence there is a strong relationship between the independent and dependent variables. A R2 close to 0 indicates that the variability in the response to the
independent variable cannot be explained by the model and hence there is a no relationship between the independent and dependent variables. The equation 2.1 show how the adjusted R2 is computed.
= 1 − (2.1)
where = ∑ ( − ) and = ∑ ( − )
is original data value, is predicted value, n is number of samples.
Adjusted R2 (equation 2.2) is an improvement over the R2 in revealing explanatory power of
models when there are more than one independent variables used in the model.
= 1 − ( )
( )
(2.2)
The sum-of-squares of the residuals from the regression line or curve have n-K degrees of freedom, where n is the number of data points and K is the number of parameters fit by the regression. As the Adj R2 increases, the model becomes more desirable. When there are
= | | = (2.3)
= =
∑ (2.4)
MRE provides an indication of the divergence between the values estimated by the model and the actual values. MMRE (or ) is the mean magnitude of relative error across all the data points. The MMRE does not represent the extreme of the estimate errors and only the mean. There will be estimates which would be much closer to actuals as well as estimates which are quite higher compared to the mean.
Median MRE (MedMRE), calculated from Median value instead of Mean value analogous to equations 2.3 and 2.4, can provide a better indication of the error in such cases.
Another criterion, referred to as Mallow’s Cp, is used (Lindsey, 2010) for evaluating linear
regression models along with the Adjusted R2.
= ( − − 1) − ( − 2 ) (2.5)
Where ℎ for the model with p regression coefficients and is the for the full model with m possible predictors excluding intercept.
Mallow’s Cp helps to strike an important balance with the number of predictors in the model. It compares the precision and bias of the full model to models with a subset of the predictors. Models where Mallow’s Cp is small and close to the number of predictors in the model plus the constant (p) are usually preferred.
A small Mallow’s Cp value indicates:
a. that the model is relatively precise (i.e., has a small variance) in estimating the true regression coefficients and predicting future responses;
b. that the model is relatively unbiased in estimating the true regression coefficients and predicting future responses.
Models with bias or improper fit will have a Mallow’s Cp value larger than the number of independent variables plus a constant. Mallow’s Cp values are computed with p = 1 for each of the models.
These criteria will be used to evaluate the portfolio of estimation models designed later in this research work.
2.1.3 Criteria for Evaluation of Test Estimation Techniques
In order to evaluate the test estimation techniques identified in the literature study, I propose the following criteria:
Customer view of requirements: This criterion makes it possible to determine whether the
estimation technique looks at the software requirements from a customer viewpoint or from the technical/implementation viewpoint. Estimation based on the customer viewpoint provides an opportunity for customer to directly relate estimates to the requirements.
Functional size as a prerequisite to estimation: Most estimation methods use some form
of size, which is either implicit or explicit in effort estimation. When size is not explicit, benchmarking and performance studies across projects and organizations are not possible. Functional size can be measured using either international standards or locally defined sizing techniques.
Mathematical validity: Several of the estimation techniques discussed in Section 2.2 have
evolved over the years, mostly based on a ‘feel good’ approach and ignoring the validity of their mathematical foundations. This criterion looks at the metrological foundation of the proposed estimation techniques and application of statistical criteria to assess the quality of the estimation models. A valid mathematical foundation provides a sound basis for further improvements.
Verifiability: The estimate produced must be verifiable by a person other than the estimator.
Benchmarking: It is essential that estimates be comparable across organizations, as this can
help later in benchmarking and verifying performance improvement. The genesis of the estimation techniques is looked at to determine whether or not benchmarking is feasible.
Using these five criteria, Table 2.1 presents summary of my high level analysis of each category of techniques for the estimation of software testing. The details supporting this analysis are presented in the following sub-sections.
Table 2.1 Evaluation of Test Estimation Techniques
Criteria Estimation techniques Customer view of requirements Functional size as a prerequisite Mathematical
validity Verifiable Benchmarking
1- Judgment & rule of thumb NO NO Not applicable NO NO 2- Analogy & work breakdown NO NO YES YES Partial, and only when standards are used 3- Factor & weight NO NO NO – units are most often ignored YES NO
4- Size YES YES
Varies with sizing technique selected YES YES 5-Neural Network & Fuzzy logic models
Partially Most often, No YES, in general, but at times units are ignored Partial Partially, and only when standards are used
2.2 Test Estimation Techniques 2.2.1 Judgement and Rule of Thumb
Delphi (Chemuturi, 2012): A Delphi is a classic estimation technique in which experts are
involved in determining individual estimate for a particular set of requirements based on their own earlier experience. Multiple iterations take place during which the experts learn the reasoning from other experts, and rework their estimate in subsequent iterations. The final estimate is selected from the narrowed range of values estimated by experts in the last iteration.
Rule of Thumb: The rule of thumb estimates are based on ratios and rules pre-established
by individuals or by experienced estimators, but without a well-documented and independently variable basis. For example: the following rules of thumb (Jones 2007) are used to estimate efforts for certain activities involved in testing:
a. Function points raised to the 1.2/ 1.15/ 1.3 power will give an approximation of the average/ minimum/ maximum number of test cases.
b. Function points raised to the power 1.25 predict the approximate defect potential for new software projects.
c. Each software test step will find and remove 30 percent of the bugs that are present.
Strengths and Weakness
Strengths are as follows: • Simple to use.
• Perception of quick results. Weaknesses are as follows:
• Results cannot be verified by an independent person
• Estimation is not based on the analysis of well documented historical data and hence benchmarking is not feasible.
• Estimator often takes up an implementation view of the requirements. • Some of the techniques do not provide estimates for all activities in testing.
Experimental Studies
No experimental studies are recorded to evaluate the effectiveness of these rules of thumb techniques.
2.2.2 Analogy and Work Breakdown Techniques
A description of analogy and work breakdown techniques is presented below:
Analogy-based (Chemuturi, 2012): The analogy-based techniques involve comparisons of
the components of the software under test with a set of reference components, for which test effort is known based on historical data. The total estimate of all the components of the software to be tested is further adjusted based on project-specific factors and the management effort required, such as planning and review.
Task-based (Chemuturi, 2012): It is a typical work breakdown-based estimation technique
where all testing tasks are listed and three-point estimates for each task are calculated with a combination of the Delphi Oracle and Three Point techniques (Black, 2002). One of the options offered by this method for arriving at an expected estimate for each task is a beta distribution formula. The individual estimates are then cumulated to come out with the total effort for all the tasks. Variations of these techniques, such as Bottom-Up and Top-Down, are based on how the tasks are identified.
Test Case Enumeration-based (Chemuturi, 2012): This is an estimation technique which
starts with the identification of all the test cases to be executed. The estimate of the expected effort for testing each test case is calculated, using a beta distribution formula.
Strengths & Weaknesses
Strengths are as follows:
• These techniques can work in a local context within an organization, where similar types of projects are executed.
• Estimates can be verified by an independent person, if historical records are maintained. Weaknesses are as follows:
• Benchmarking is not possible, since there is no agreed definition of what constitutes a task or work breakdown.
• Implementation view of the requirements is taken while estimating.
Experimental Studies
No known experimental studies on the effectiveness of these techniques for test effort estimation are reported.
2.2.3 Factors and Weights
A description of factors and weights techniques is presented below:
Test Point Analysis (Kerstner, 2011): It is a technique in which dynamic and static test points
are calculated to arrive at a test point. Dynamic test points are calculated based on function points, functionality-dependent factors, and quality characteristics. Function-dependent factors, such as user importance, usage intensity, interfacing requirements, complexity, and uniformity are given a rating based on predefined ranges of values. Dynamic quality characteristics, such as suitability, security, usability, and efficiency, are rated between 0 and 6 to calculate dynamic test points. Each applicable quality characteristic as defined in ISO 9126 is assigned a value of 16 and summed to obtain the total number of static test points. The test point total is converted to effort based on ratings to be provided for a set of productivity and environmental factors.
Use Case Test Points: Use case test points (Kerstner, 2011) is proposed as an alternative
to Test Points and derived from Use Case-based estimation for software development. Unadjusted Use Case Test Points are calculated as the sum of the actors multiplied by each actor’s weight from an actors’ weight table and the total number of use cases multiplied by a weight factor, which depends on the number of transactions or scenarios for each use case. Weights assigned to each of the technical and environmental factors are used to convert ‘unadjusted use case points’ to ‘adjusted use case points’. A conversion factor accounting for technology/process language is used to convert adjusted use case points into test effort.
Test Execution Points (Aranha and Borba, 2007): This technique estimates test execution
effort based on system test size. Each step of the test specifications is analyzed based on characteristics exercised by the test step, such as screen navigation, file manipulation, and network usage. Each characteristic that impacts test size and test execution is rated on an ordinal scale – low, average, and high – and execution points are assigned.
Test team efficiency is factored into another variation of the estimation model for test execution effort. The Cognitive Information Complexity Measurement Model (Silva, Abreua and Jino, 2009) uses the count of operators and identifiers in the source code coupled with McCabe’s Cyclomatic Complexity measure.
Strengths & Weaknesses
Strengths are given below:
• Partial customer view of requirements.
• Consideration of various factors which are believed to impact test effort provides a feel-good factor to estimator.
• Estimates can be verified by an independent person. Weaknesses are given below:
• Factors used to calculate are not of the same measurement scale.
• The measures used in this model lack the basic metrological foundations for quantification (Abran, 2010) and the validity of such measurements for estimating test execution effort has not been demonstrated.
• Formulae used to calculate contain invalid mathematical operations.
Experimental studies
2.2.4 Size-based Estimation Models
The size of the software in terms of its functional size measured using any functional size measurement method is used in this class of estimation techniques. The size, along with other relevant measures, is built into an estimation model which is used to estimate effort. Some techniques use size to build a regression model using historical data, while others do not follow a statistical approach in modelling. As individual techniques differ from each other in using a particular functional size measurement method and the approach used to building estimation model, they are dealt separately in the following subsections.
2.2.4.1 Test Size-based Estimation
A description of test size-based estimation techniques is presented below.
The size of the functional requirements in Function Points using IFPUG’s Function Point Analysis (FPA) (IFPUG, 2005; ISO 20926, 2009) is converted to unadjusted test points through a conversion factor in estimation using Test Size (Chemuturi, 2012). Based on an assessment of the software, the programming language and the scope of the testing, weights from a weight table are assigned to test points. Unadjusted test points are modified using a composite weighting factor to arrive at a test point size. Next, test effort in person hours is computed by multiplying Test Point Size by a productivity factor.
Strengths & Weaknesses
The strengths are given below:
• Takes a customer view of the requirements during functional size measurement • Estimates can be verified by an independent person
• Benchmarking is feasible as test effort is computed with reference to a size measured using FPA.
The weaknesses are given below:
• The technique uses FPA. Mathematical limitations of FPA have been analyzed and documented (Abran, 2010).
• No statistical approach used in determining the productivity factors.
Experimental Studies
There are no recorded experimental studies to assess the quality of test size based estimation.
2.2.4.2 AssessQ Model
A description of AssessQ Model is presented below:
The AssessQ model (Mutalik, 2003) and tool built by the founder of the first independent software testing organization in India, were used within his own organization prior to getting acquired by another IT services organization. The model was built based on internal experience of executing independent testing contracts. It uses IFPUG Function Points as its basic size measure which gets multiplied by factors based on the software engineering maturity of the development organization whose product is tested. This model uses past project data and provides estimates for (i) number of test cases to be designed and (ii) the number of expected defects. The estimates are adjusted to accommodate project specific factors.
Strengths & Weaknesses
The strengths are given below:
• Takes a customer view of the requirements during functional size measurement. • Estimates can be verified by an independent person and benchmarking is feasible. • Provides specific estimates for test case preparation and test case execution based on
domain of the software tested.
• Recognizes ‘developer’ maturity of the development organization as a major factor affecting testing efforts. Process maturity of developer is assessed and used as one of the parameters in the model.
• Maturity of verification and validation process of the testing organization is used as another parameter in the estimation model, thus taking into consideration process aspects of testing organization.
• Statistical approach using historical data for building the estimation model. The weaknesses are given below:
• The technique uses FPA. Mathematical limitations of FPA have been documented (Abran, 2010).
• The technique was internal to the organization. Technical details of the model, and the data used for building the model are not available for public review and validation.
Experimental Studies
No known experimental studies published on the effectiveness of the usage of this model.
2.2.4.3 Estimating test volume and effort
A description of the technique is presented below:
An approach for estimating the test volume and effort is proposed (Abran, Garbajosa and Cheikhi, 2007), where a functional size of requirements is used as a basis for quantitatively estimating test volume and used later in an effort estimation model. The initial estimate based on the functional requirements is adjusted subsequently by taking into consideration non-functional requirements. This technique uses the European Space Standards (ECSS, 2003) as a reference for functional and non-functional requirements. This model uses COSMIC Function Point (COSMIC, 2007; ISO/IEC 19761, 2011) to measure functional size. Estimates for non-functional testing are arrived at based on a graphical assessment of non-functional requirements of project data.
Strengths & Weakness
The strengths are given below:
• Uses COSMIC Function Point (ISO 1976, 2011) and overcomes the limitations of first generation of functional size measurement methods [Kamala Ramasubramani, 2011]. • Mathematically valid, verifiable and benchmarking is feasible.
• Provides an approach for accommodating non-functional requirements into estimation model.