Poor fen succession over ombrotrophic peat related to late-Holocene increased surface wetness in subarctic Quebec,
Canada
Journal: Journal of Quaternary Science Manuscript ID: JQS-13-0071
Wiley - Manuscript type: Research Article Date Submitted by the Author: 18-Jun-2013
Complete List of Authors: van Bellen, Simon; University of Aberdeen, School of Geosciences Garneau, Michelle; Chair on Peatland Ecosystems Dynamics and Climatic Change, ; GEOTOP - Geochemistry and Geodynamics Research Center, ; Université du Québec à Montréal, Département de Géographie
Ali, Adam; Centre for Bio-Archaeology and Ecology (UMR5059 CNRS), Université Montpellier 2, ; NSERC-UQAT-UQAM Industrial Chair in Sustainable Forest Management, Université du Québec en Abitibi-Témiscamingue,
Lamarre, Alexandre; Université du Québec à Montréal, Département de Géographie and DÉCLIQUE UQAM-Hydro-Quebec Chair/GEOTOP; Chair on Peatland Ecosystems Dynamics and Climatic Change, ; GEOTOP -
Geochemistry and Geodynamics Research Center,
Robert, Élisabeth; Université Laval, Centre d’études nordiques
Magnan, Gabriel; Chair on Peatland Ecosystems Dynamics and Climatic Change, ; GEOTOP - Geochemistry and Geodynamics Research Center, ; Université du Québec à Montréal, Institut des Sciences de l'Environnement Asnong, Hans; Université du Québec à Montréal, Département de
Géographie
Pratte, Steve; Chair on Peatland Ecosystems Dynamics and Climatic Change, ; GEOTOP - Geochemistry and Geodynamics Research Center, ; Université du Québec à Montréal, Département des sciences de la Terre et de l'atmosphère
Keywords: testate amoeba, Neoglacial, methane, plant macrofossils, Little Ice Age
Poor fen succession over ombrotrophic peat related to late-Holocene increased surface 1
wetness in subarctic Quebec, Canada 2
3
Simon van Bellen* 4 [email protected] 5 6 Michelle Garneau 7 8 Adam A. Ali 9 10 Alexandre Lamarre 11 12 Élisabeth C. Robert 13 14 Gabriel Magnan 15 16 Hans Asnong 17 18 Steve Pratte 19 20 21 Abstract 22 23
Northern peatlands act as archives of environmental change through their sensitivity to water 24
balance fluctuations, while being significant contributors to global greenhouse gas dynamics. 25
Subarctic fens in northeastern Canada are characterized by a dominance of pools and flarks. We 26
aimed to reconstruct the late-Holocene hydrological conditions of these fens to establish the 27
timing of the initiation of pool and flark formation and possible linkages with climate. Testate 28
amoebae and plant macrofossils from five cores, sampled in three fens, were analyzed to infer 29
water tables with chronologies based on 14C and 210Pb dating. All sites showed presence of 30
relatively dry, ombrotrophic conditions with abundant Picea from 5000 cal a BP, followed by a 31
first shift to wet, poor fen conditions with pool and flark development around 3000 cal a BP and 32
a subsequent wet shift after ~800 cal a BP. These trends coincide with previously observed 33
Neoglacial and Little Ice Age cooler and wetter conditions and therefore climate may well have 34
been a dominant factor in the initiation and development of pools and flarks over the late-35
Holocene. The effect of anticipated climate change on subarctic peatlands remains unclear, 36
although wetter conditions might enhance pool expansion to the detriment of terrestrial 37
components. 38
39
Key words: testate amoeba, Neoglacial, methane, plant macrofossils, Little Ice Age. 40 3 4 5 6 7 8 9 10 11 12 13 14 15 16 17 18 19 20 21 22 23 24 25 26 27 28 29 30 31 32 33 34 35 36 37 38 39 40 41 42 43 44 45 46 47 48 49 50 51 52 53 54 55 56 57
Introduction 41
42
Peatlands are defined by the accumulation of organic matter under anoxic conditions, which over 43
millennia results in the creation of stratigraphic archives as they expand vertically and laterally 44
under the influence of autogenic and allogenic factors. Typically, peat accumulation starts under 45
minerotrophic conditions either by the infilling of an aquatic ecosystem, or by the growth of 46
Sphagnum over soils through paludification. As accumulation continues, the peatland surface 47
becomes isolated from groundwater supply until eventually precipitation represents the only 48
source of water to the vegetation. This transition is normally present in stratigraphies from 49
ombrotrophic peatlands, often referred to as the fen-bog transition, and its timing may be either 50
autogenically or allogenically influenced (Hughes and Dumayne-Peaty, 2002). Changes in 51
peatland stratigraphy have been of scientific interest as these ecosystems constitute both historic 52
records of environmental and climate change (Aaby, 1976; Barber et al., 1994) and important 53
stores of organic carbon (Gorham, 1991). Because of this sensitivity to environmental change 54
and the high carbon sequestration potential peatland ecosystems represent an important feedback 55
mechanism for climate change (Yu, 2011). Peatlands generally act as sinks for carbon dioxide 56
(CO2) and sources of methane (CH4) (Frolking and Roulet, 2007), yet greenhouse gas budgets 57
are highly variable depending on the hydrological and trophic state of the peatland or, more 58
specifically, surface microtopography (Waddington and Roulet, 1996). 59
In eastern Canada, the distribution of peatland types is related to important longitudinal and 60
latitudinal climatological gradients. The subarctic fens of the Laforge region (54°N; 72°W), 61
located within the La Grande Rivière watershed, have developed at the northern limit of the 62
ombrotrophic peatland distribution, persisting under similar climatic conditions to previously 63
studied patterned fens of western Labrador (Foster et al., 1988). Due to their ecotonal location, 64
these ecosystems are likely to be less resilient to future climate change and therefore their 65
ecohydrological dynamics deserve particular attention (e.g. Tahvanainen, 2011; Weckström et 66
al., 2010). The subarctic fens in the Laforge region are characterized by an important presence of 67
pools and waterlogged flarks, accounting for 35-42% of the surface (Cliche Trudeau et al., 2012; 68
Tardif et al., 2009). Previous studies suggested that water tables have risen during the recent 69
millennia (~3000 cal a BP) and subsequently since the Little Ice Age (LIA), causing important 70
tree mortality and pool expansion to the detriment of terrestrial microforms (Arlen-Pouliot, 2009; 71
Tardif et al., 2009). Cliche Trudeau et al. (2012) quantified seasonal CH4 fluxes for different 72
microforms in Laforge region fens, concluding that pools occupy 42% of the surface, yet account 73
for 79% of CH4 emissions. As a result, shifts in microform distribution are of major concern 74
considering peatland carbon feedback to climate change. A more detailed image of centennial to 75
millennial peatland CH4 emissions, for instance, may contribute to the understanding of late-76
Holocene increases in atmospheric CH4 concentrations, the forcing of which has been much 77
debated (e.g. Korhola et al., 2010; MacDonald et al., 2006; Ruddiman et al., 2011; Singarayer et 78 al., 2011; Yu, 2011). 79 3 4 5 6 7 8 9 10 11 12 13 14 15 16 17 18 19 20 21 22 23 24 25 26 27 28 29 30 31 32 33 34 35 36 37 38 39 40 41 42 43 44 45 46 47 48 49 50 51 52 53 54 55 56 57
In this study, testate amoebae were used as a proxy for paleohydrological conditions. Testate 80
amoebae are single-celled protists that live in the uppermost layer of the acrotelm. They rapidly 81
respond to hydrological shifts while being abundant and diverse (often >20 identifiable species 82
per subsample) and their shells (‘tests’) are generally well preserved in peat. As testate amoeba 83
presence is related to the position of the water table, past water table levels may be inferred from 84
their fossil assemblages. Over the last two decades, several transfer functions have been created 85
to infer past water tables covering the major part of the global peatland distribution (Booth, 86
2008; Charman et al., 2007; Lamentowicz et al., 2008; Payne et al., 2008; Warner and Charman, 87
1994; Wilmshurst et al., 2003). Although the environmental control on amoeba communities 88
may be more complicated in fens due to the presence of a minerotrophic influx, testate amoebae 89
have been successfully used to quantify water table variations in these ecosystems as well 90
(Payne, 2011). 91
The objective of this study was to reconstruct the hydrological history of the peatlands of the 92
Laforge region using testate amoeba and plant macrofossil analyses. Specifically, we aimed to 93
identify the timing of the hydrological shift from ombrotrophic to poor minerotrophic conditions 94
and test the linkage with Neoglacial cooler and wetter conditions. A transfer function built from 95
a testate amoeba training set covering sites from Quebec (between 45-55°N) was used to infer 96
water table levels (Lamarre et al., accepted). Moreover, plant macrofossils were identified, 97
representing an independent record of changes in hydrology that supports the testate amoeba-98 inferred reconstructions. 99 100 101 Study region 102 103
The Laforge region is located in the Picea-dominated lichen-woodland biome of northeastern 104
Canada (Fig. 1; Saucier et al., 1998) where mean annual temperature (MAT) averages -4.3°C 105
with a mean annual precipitation (MAP) of 738 mm (Fig. 2; interpolated means of 1971–2003 106
NLWIS data; Hutchinson et al., 2009). The short growing season (mean of 153 days for 2009-107
2010; Cliche Trudeau et al., 2012) is characterized by an average of 1400 degree-days above 108
0°C. Poor fens are the regionally dominant peatland type in this region. Three representative fens 109
were selected for this study after extensive aerial survey (Fig. 1): Aeroport (54°06’02”N; 110
72°30’59”W; 3.0 ha), Ours (54°02’56”N, 72°27’25”W; 1.6 ha; 8 km southeast of Aeroport fen) 111
and Abeille (54°06’52”N; 72°30’01”W; 3.5 ha; 2 km northeast of Aeroport fen). Present-day 112
vegetation is characterized by Sphagnum cuspidatum, Gymnocolea inflata, Vaccinium oxycoccos 113
and Carex spp. in wet flarks, Sphagnum cuspidatum, Chamaedaphne calyculata, Vaccinium 114
oxycoccos, Drosera rotundifolia and Carex spp. on strings and Sphagnum fuscum, Empetrum 115
nigrum, Rubus chamaemorus and Picea mariana on ridges and near the forest edge (Cliche 116 Trudeau et al., 2012). 117 118 119 3 4 5 6 7 8 9 10 11 12 13 14 15 16 17 18 19 20 21 22 23 24 25 26 27 28 29 30 31 32 33 34 35 36 37 38 39 40 41 42 43 44 45 46 47 48 49 50 51 52 53 54 55 56 57
Material and methods 120 121 Fieldwork 122 123
A total of six cores from three fens were extracted from lawns using a box corer with a 124
10 × 10 cm cross section. One core from Abeille peatland showed contamination and was 125
therefore discarded. To determine core length, we referred to chronologies of Arlen-Pouliot 126
(2009), which showed that 1 m of peat represented ~5000 years. As we focused on the period 127
from the mid-Holocene onwards, we estimated 1 m of peat to be sufficient. Collected monoliths 128
were packed in plastic, aluminium foil and polyvinyl chloride tubes and stored in a cold chamber 129
at 4°C until analysis. Prior to analyses, cores were sectioned into 1-cm slices. 130
131
Stratigraphic analyses
132 133
Testate amoeba sample preparation followed the method of Hendon and Charman (1997) with 134
Lycopodium spores added to 1- or 2-cm3 subsamples to calculate total amoeba concentrations, 135
with the exception of core Aero1, for which no concentrations were calculated. We aimed for 136
total counts of 150 individuals, yet some were limited to <40 individuals due to poor amoeba 137
preservation and high amounts of highly decomposed organic matter in the amoeba size fraction. 138
Following the recommendations of Payne and Mitchell (2008), water table depths were not 139
inferred for such low counts as they may be unreliable, and we suggest that reconstructions based 140
on <75 amoebae should be interpreted with caution. After initial analyses of the section <355 µm 141
of cores Aero1 and Ours1, 212-µm sieves were used in the preparation of subsamples from 142
Aero5, Ours4 and Abeille5 to facilitate counting. By this means we excluded as much fine-143
fraction organic matter as possible from our slides while retaining most, if not all, amoebae. 144
Analyses were performed at intervals varying between 1 and 4 cm. Species presence was 145
expressed as a percentage of the total count. Taxonomy follows Charman et al. (2000), modified 146
by Booth (2008). 147
For the identification of plant macrofossils, subsamples of 5 cm3 were heated in 5% KOH 148
solution and then rinsed through 150- or 170-µm sieves. A binocular microscope was used for 149
the identification of peat-forming vegetation and abundance was expressed as volume 150
percentages or counts; the identification of Sphagnum spp. and other bryophytes was performed 151
with a microscope (×40-100). Vascular plant species were determined using guides by Grosse-152
Brauckmann (1986), Lévesque et al. (1988) and Montgomery (1977). Bryophytes were identified 153
using Crum and Anderson (1979-1980) and Mogensen (1986). The reference collection of fossil 154
and modern material of the Laboratoire de paléoécologie terrestre, Centre d’Études Nordiques at 155
Université Laval was used for validation of the identification of certain vascular plants and 156
bryophytes. Nomenclature follows Marie-Victorin (1995) for vascular plants and Crum and 157
Anderson (1979-1980) and Ireland (1982) for bryophytes. Stratigraphic diagrams were created 158 3 4 5 6 7 8 9 10 11 12 13 14 15 16 17 18 19 20 21 22 23 24 25 26 27 28 29 30 31 32 33 34 35 36 37 38 39 40 41 42 43 44 45 46 47 48 49 50 51 52 53 54 55 56 57
with C2 version 1.7.2 (Juggins, 2007). Stratigraphic zones were identified by visual 159
interpretation of variations in both plant macrofossil and testate amoeba assemblages. 160 161 162 Transfer function 163 164
In order to infer water table depths from testate amoeba assemblages a transfer function was 165
developed from a total of 206 surface peat samples collected from 18 peatlands across the 166
Quebec boreal and subarctic regions (Lamarre et al., in press). We used a weighted average 167
model with tolerance downweighting and classical deshrinking. Water table positions were 168
expressed as depths relative to the peatland surface (WTD), i.e. negative values indicate standing 169 water. 170 171 172 Chronologies 173 174
A total of 30 samples were submitted to Keck-CCAMS facility (Irvine, USA), Beta Analytic Inc. 175
(Miami, USA) and IsoTrace Laboratory (University of Toronto, Canada) for accelerator mass 176
spectrometry radiocarbon dating (Table 1). Only Sphagnum, leaves or seeds of Ericaceae and 177
conifers were dated, and in rare cases charcoal fragments. 178
To accurately represent the acrotelm, additional 210Pb dating through α-spectrometry was 179
performed at GEOTOP-Université du Québec à Montréal. Prior to chemical treatments, rootlets 180
were removed from the bulk peat. Chemical treatments included hydrofluoric acid (HF) addition 181
to remove eventual mineral material. Ages were obtained from 210Po activity using the constant 182
rate of supply model (Appleby and Oldfield, 1978). Further details on the applied 210Pb-dating 183
methods can be found in Ali et al. (2008). 184
Age determinations from 14C and 210Pb dating were merged to create chronologies using Clam 185
(Blaauw, 2010) in R (R Development Core Team, 2009). As coring was performed in 2005 186
(Aero and Ours cores) and 2010 (Abeille5), ages of either -55 or -60 cal a BP were applied to the 187
surface of cores. Loess regression was applied for all cores, except for Aero5 and Ours4, which 188
were modelled by a smooth spline; a minimum of 1000 iterations was set for the construction of 189
chronologies. Loess and smooth spline regression models resulted in more natural accumulation 190
models than those obtained from piecewise linear interpolation, especially for the basal parts of 191
cores Aero5 and Ours4. 192 193 194 Results 195 196 Chronologies 197 198 3 4 5 6 7 8 9 10 11 12 13 14 15 16 17 18 19 20 21 22 23 24 25 26 27 28 29 30 31 32 33 34 35 36 37 38 39 40 41 42 43 44 45 46 47 48 49 50 51 52 53 54 55 56 57
Chronologies indicate relatively low rates of peat accumulation typical for subarctic peatlands, 199
with an average sample time span of 45 a cm-1 (σ=6.0) (Fig. 3). In cores Aero5, Ours1 and 200
Ours4, peat accumulation rates were higher prior to 4000 cal a BP, whereas the age-depth 201
relationships of Aero1 and Abeille5 were close to linear. 202
203
Ecohydrological reconstructions
204 205
Detailed stratigraphic analyses show that all coring sites were dominated by ombrotrophic 206
conditions before ~3000 cal a BP (Fig. 4a-e and Tables 2-6; complete diagrams as 207
supplementary Figs. S1 and S2). During this period, local vegetation was dominated by 208
Sphagnum fuscum and Picea mariana and dominant amoebae were D. pulex and Archerella 209
flavum indicating water table depths were generally >5 cm below the surface. After 3000 cal a 210
BP, all sites were subject to rising water tables and, although timing of the event is variable, 211
flarks or shallow pool conditions became general between 3000 and 2000 cal a BP with increases 212
in Sphagnum majus, Sphagnum fallax, Larix laricina and Herbaceae in the vegetation 213
assemblages and A. wrightianum in the amoeba composition. Moreover, episodic presence of 214
minerotrophic species such as Sphagnum subsecundum, Drepanocladus revolvens and 215
Calliergon stramineum suggest poor fen conditions that generally persisted locally until ~1500 216
cal a BP (Fig. 5). 217
After 1490-1310 cal a BP, the two cores from Aeroport fen show a decrease in surface wetness 218
(Fig. 4a-b; Fig. 5). At the same time, reconstructions in Ours fen do not indicate drier conditions 219
in Ours4 whereas in Ours1 late-Holocene reconstructions are hampered by very low amoeba 220
concentrations (<3000 cm-3) and negligible accumulation with only 8 cm of peat accumulated 221
between 2010 and 340 cal a BP (Fig. 5). In Abeille5, water tables during this period could not be 222
inferred due to relatively low amoeba concentrations (<4000 cm-3; Fig. 5). 223
After this slightly drier period, a return to wet flark conditions is generally observed at most sites 224
~900 cal a BP, at least at those where water tables could be confidently quantified. S. majus, S. 225
fallax and amoeba A. wrightianum reappear as the dominant species in the vegetation 226
assemblages. Finally, another dry shift has been recorded after ~AD 1880, with slightly 227
decreasing water tables in four cores, as indicated by shifts in both testate amoeba assemblages 228
(decreasing relative presence of A. wrightianum) and local vegetation (increases in lawn-229
associated Sphagnum magellanicum to the detriment of S. fallax and S. majus). 230 231 232 Discussion 233 234
The evolution of the subarctic poor fens in the Laforge region can be subdivided into five key 235
periods: 1) a mid-Holocene dry Picea-S. fuscum bog period (>3000 cal a BP); 2) Neoglacial wet, 236
herbaceous poor fen conditions (3000-1500 cal a BP); 3) An early-Medieval period with low test 237 3 4 5 6 7 8 9 10 11 12 13 14 15 16 17 18 19 20 21 22 23 24 25 26 27 28 29 30 31 32 33 34 35 36 37 38 39 40 41 42 43 44 45 46 47 48 49 50 51 52 53 54 55 56 57
concentrations and poor WTD estimates (~1500-900 cal a BP); 4) LIA wet poor fen conditions 238
(900 cal a BP-AD 1880) and 5) 20th century decreasing water tables (Fig. 6a). 239
240
Testate amoebae as proxies in subarctic fens
241 242
Inferring water tables from testate amoeba assemblages in fens may be precarious, as their 243
sensitivity to water table may vary between peatland types (Payne, 2011). In our study, a poor 244
preservation of idiosome tests (testate amoebae that produce biosilica or calcite plates, e.g. 245
Euglypha, Corythion-Trinema and Assulina spp.; Mitchell et al., 2008) causes a relative 246
enrichment in hydrophilous A. wrightianum below a depth of ~20 cm (Fig. 4a-e), possibly 247
resulting in an overestimation of water levels before the 20th century. Despite a possible effect of 248
differential preservation, plant macrofossils also suggest drier conditions over the 20th century, 249
with an increasing presence of Sphagnum rubellum, S. fuscum and S. magellanicum to the 250
detriment of hydrophilous S. majus and S. fallax, as well as a decrease in herbaceous species. 251
Payne (2011) suggested that transfer functions should not be used to cover the fen-bog transition 252
as the amoeba sensitivity to hydrological change may differ between these trophic states. As both 253
testate amoeba and plant macrofossil analyses were applied here, the amoeba-inferred water 254
tables could also be validated by local vegetation reconstructions. We showed that WTD 255
reconstructions are warranted through the association with local plant communities from 256
macrofossils. For instance, the periods dominated by hydrophilous A. wrightianum generally 257
coincided with an abundance of Herbaceae and a local presence of S. majus and S. fallax, two 258
species that are exclusively found in wet flarks and hollows (Fig. 4a-b, d-e; Bastien and Garneau, 259
1997). At the other end of the humidity spectrum, dominance of D. pulex and Trigonopyxis 260
arcula closely corresponds with the presence of ridge-forming S. fuscum. 261
Due to the apparent close relationship between ecohydrological history and late-Holocene 262
climate variability (Viau and Gajewski, 2009), we considered the northeastern Canada climate 263
regime fluctuations to explain the reconstructed trends. 264
265 266
Laforge fen hydrology and late-Holocene climate
267 268
Testate amoeba and plant macrofossil analyses show that the three studied peatlands developed 269
from dry, ombrotrophic bogs and evolved into wet, poor fens. Moreover, decreasing 270
accumulation rates were associated with the transition to fen ecosystems. This transition was 271
initiated ~3000 cal a BP, with generally highest water tables between 2500 and 1500 cal a BP 272
and 800 and 200 cal a BP (Fig. 6a). Whereas before 4000 cal a BP water table positions varied 273
between those associated with high hummocks or forest edges (Aero1) and wet flarks or hollows 274
(Ours1, Aero5), all cores registered shifts to wetter conditions that persisted during the major 275
part of the late-Holocene. Although the spatially punctual nature of cores may not entirely cover 276
the spatiotemporal complexity of peatlands, we feel that the increase in surface wetness as shown 277 3 4 5 6 7 8 9 10 11 12 13 14 15 16 17 18 19 20 21 22 23 24 25 26 27 28 29 30 31 32 33 34 35 36 37 38 39 40 41 42 43 44 45 46 47 48 49 50 51 52 53 54 55 56 57
by cores ~3000 cal a BP is most likely associated to a shift in surface microtopography. 278
Moreover, the use of multiple cores per peatland allows for a control at the ecosystem scale. 279
The reconstructed change from ombrotrophic to minerotrophic conditions is quite atypical, 280
because peatlands generally form under minerotrophic conditions and eventually shift to 281
ombrotrophy (Charman, 2002), yet some reversals have been recorded (Charman, 1995). General 282
models of accumulation assume that long-term peatland development eventually results in the 283
isolation from regional groundwater influence after which ombrotrophic conditions prevail 284
(Hughes and Dumayne-Peaty, 2002). Long-term peat accumulation has even been suggested as a 285
purely autogenic cause for long-term drying, decreasing accumulation rates and shifting 286
vegetation assemblages in continental peatlands (Belyea and Clymo, 2001; Yu et al., 2003). The 287
“inversed” hydroseral succession as observed in the studied region, i.e. from bog to fen 288
conditions, may be related to the biogeographic position of these peatlands at the ecotone of 289
ombrotrophic and minerotrophic systems. Low rates of peat accumulation, with only ~1 m of 290
peat accumulated over ~5000 years, show that the balance between production and decay in 291
these peatlands may be easily disrupted, and therefore ecosystem hydrology may be particularly 292
sensitive to external forcing. 293
The Neoglacial has been identified as one of the major climatic periods of the Holocene (Wanner 294
et al., 2011), characterized primarily by decreasing northern hemisphere summer temperatures 295
after 4500 cal a BP forced by decreasing insolation. Gradual cooling resulted in decreasing forest 296
productivity and increases in fire and aeolian activity in northern Quebec (Arseneault and Sirois, 297
2004; Filion, 1984; Kerwin et al., 2004). In addition, due to combined effects of cooling and 298
increases in fire frequency, tree regeneration was limited, leading to an opening of the forest-299
tundra around ~3500 cal a BP (Asselin and Payette, 2005; Payette and Gagnon, 1985). Finally, 300
frost heave (palsa) formation in subarctic Quebec peatlands started after ~3200 cal a BP, 301
showing that frozen peat could persist during the growing season (Payette and Rochefort, 2001) 302
while peat and carbon accumulation rates decreased in boreal ombrotrophic peatlands (Beaulieu-303
Audy et al., 2009; van Bellen et al., 2011a; van Bellen et al., 2011b). Palsa formation was 304
important between 1500 and 1000 cal a BP and during the LIA (Asselin and Payette, 2006; 305
Couillard and Payette, 1985; Payette and Rochefort, 2001). Quantitative temperature and 306
precipitation reconstructions using pollen data by Viau and Gajewski (2009) support inferences 307
drawn from these studies, identifying the Neoglacial as a period with cooler summer conditions, 308
while annual precipitation increased (Fig. 6b). Moreover, besides some shorter term variability, 309
cooling was relatively gradual starting ~3000 cal a BP and continuing until the LIA, although 310
punctuated by the Medieval Climate Anomaly (globally starting ~1000 cal a BP; Mann et al., 311
2009). Long-term trends in annual precipitation are less clear, but abrupt increases in 312
precipitation were found between 3000-2700 cal a BP, 2000-1700 cal a BP and 800-600 cal a BP 313
(Viau and Gajewski, 2009). 314
Considering the current biogeographical location of the Laforge peatlands (Fig. 2) we 315
hypothesize that Neoglacial cooling negatively affected peatland productivity. Cooler summers, 316
combined with increases in annual precipitation, may thus be a plausible cause for the reversal of 317 3 4 5 6 7 8 9 10 11 12 13 14 15 16 17 18 19 20 21 22 23 24 25 26 27 28 29 30 31 32 33 34 35 36 37 38 39 40 41 42 43 44 45 46 47 48 49 50 51 52 53 54 55 56 57
the trophic state of these peatlands (Fig. 6a-c). In addition, local groundwater input probably 318
increased as evapotranspiration from adjacent uplands declined with cooling and after the 319
opening of tree covers (Asselin and Payette, 2005). The poor preservation of testate amoebae 320
between 1500 and 900 cal a BP may be related to enhanced peat decomposition, which may be 321
the result of either extremely dry or wet surface conditions. Reconstructions from Aeroport fen 322
show that water tables decreased locally after ~1500 cal a BP, yet aquatic plant macrofossils as 323
S. fallax and Menyanthes trifoliata appear in other cores (Fig. 4d-e). Climatic warming 324
associated with the Medieval Climate Anomaly seems an unlikely cause for the observed 325
changes, as this event started not earlier than 1100 cal a BP in northeastern Canada (Payette and 326
Delwaide, 2004; Viau and Gajewski, 2009). 327
The subsequent LIA cooling corresponds to slightly higher test concentrations and strongly 328
increasing water table levels as precipitation likely increased and summer temperature decreased, 329
reducing evaporation and growing season length (Fig. 6a-c). Finally, a trend of decreasing water 330
table levels was reconstructed after ~AD 1880 as suggested by both testate amoeba assemblages 331
and plant macrofossils. Interestingly, a 20th century water table drop is inconsistent with previous 332
research, which showed that northern Quebec lake and bog water tables actually rose over the 333
20th century, likely resulting from increases in precipitation (Bégin, 2001; Loisel and Garneau, 334
2010; van Bellen et al., 2011b). Post-LIA warming caused an increase in the length of the 335
growing season that may have enhanced peat accumulation which contributed to the apparent 336
drop in water level. In this specific hydroclimatic context, the recent warming trend (Payette et 337
al., 2004) may have been determinant for local ecohydrology rather than increases in 338
precipitation (Fig. 6c). This corresponds with Dissanska et al. (2009) who did not register a 339
significant increase in pool size over the second half of the 20th century using an aerial photo 340
survey. 341
342
Potential subarctic fen impact on greenhouse gas budgets
343 344
The studied peatlands are currently located near the cold/wet limit of the northern hemisphere 345
peatland distribution when plotted in the MAT/MAP-defined climate space (Fig. 2). Patterned 346
fens, with abundance of flarks and pools, currently persist in northern Finland (“aapa” fens), 347
Labrador (Foster et al., 1988), central Canada ("northern ribbed fens"; Zoltai et al., 1988), 348
central Sweden (Foster and Fritz, 1987) and northern Scotland (Charman, 1995). The limits of 349
the peatland distribution in this climate space may reflect critical MAT and MAP conditions for 350
potential peat accumulation. Considering the position of the Laforge region near the cold/wet 351
limit, Neoglacial and LIA cooling conditions with increases in effective moisture probably 352
resulted in a reduced accumulation potential during these periods. However, the climate space 353
presented by Yu et al. (2009) is a simplified representation of local climate conditions, because 354
seasonal averages or other specific variables, e.g. photosynthetically active radiation and 355
growing degree-days above zero (Flanagan and Syed, 2011; Frolking et al., 1998) may well be as 356
important as MAT and MAP. 357 3 4 5 6 7 8 9 10 11 12 13 14 15 16 17 18 19 20 21 22 23 24 25 26 27 28 29 30 31 32 33 34 35 36 37 38 39 40 41 42 43 44 45 46 47 48 49 50 51 52 53 54 55 56 57
Ecohydrological history of patterned peatlands has been studied notably in Labrador, where 358
Foster et al. (1988) dated the initiation of pool development ~3260-3860 cal a BP (3210-3430 359
14C a BP). In central Sweden, Foster and Fritz (1987) dated peat underlying pool sediments at 360
3410 and 3510 14C a BP, indicating that pool formation did not occur before ~3480-3960 cal a 361
BP. Furthermore, Charman (1995) reconstructed peatland development in maritime northern 362
Scotland, showing that poor patterned sedge fens developed over ombrotrophic Ericaceae peat 363
~2850 cal a BP (~2750 14C a BP), possibly as a result of climate change. Much attention has 364
been given to global increases in oceanic bog water tables due to cold/wet climate conditions 365
~2800 cal a BP (e.g. Chambers et al., 2007; Charman et al., 2006; van Geel et al., 1996), yet 366
these are often associated with decreases in solar activity at a centennial scale (Mauquoy et al., 367
2008), rather than the long-term Neoglacial trend. Nevertheless, centennial-scale climatic change 368
may still be sufficient to shift the ecosystem into a different state. Once this new state is 369
established, the peatland may be less sensitive to subsequent climatic variability, preventing a 370
return to the initial state. The pool and flark microforms found in the Laforge region may show 371
such stability, a characteristic that has already been reported by Foster and King (1984). 372
Combining the results from our study and that of Cliche Trudeau (2011) and Cliche Trudeau et 373
al. (2012), we suggest that a general expansion of flarks and pools in the Laforge peatlands 374
caused an enhanced flux of CH4 and CO2 to the atmosphere. Interestingly, the globally 375
reconstructed timing of ~3000 cal a BP for flark and pool initiation in patterned fens coincides 376
with the more pronounced increase in global atmospheric CH4 concentrations (Brook et al., 377
2000). Although we do not pretend patterned fen dynamics played a significant role in the global 378
atmospheric CH4 rise, we suggest future studies focus on pool and flark development in other 379
boreal and subarctic regions around the onset of Neoglacial cooling. 380
In line with the trend observed since the end of the LIA, 21st century global warming combined 381
with increases in precipitation (IPCC, 2007) might enhance the potential for accumulation and 382
related CO2 uptake of lawns and ridges as registered by Cliche Trudeau (2011) and Pelletier et 383
al. (2011) in the boreal region. Increases in growing season temperature would generally 384
increase the potential for Sphagnum productivity, yet specific microtopography resilience needs 385
to be considered as well. Pools and flarks may respond differently to global warming, with 386
enhanced local decomposition (Karofeld et al., 2008) and even higher emissions of CO2 and 387
CH4. 388
Considering the sensitivity of the Laforge peatlands and their important potential feedback to 389
climate change due to the abundance of aquatic microtopes, future research needs to focus on 390
developmental history of different types of peatlands to elucidate their specific past and future 391
role in global greenhouse gas budgets. 392
393
Conclusion 394
395
The patterned fens in the Laforge region, presently characterized by an important presence of 396
pools and flarks, have developed from ombrotrophic conditions. Two major periods of increases 397 3 4 5 6 7 8 9 10 11 12 13 14 15 16 17 18 19 20 21 22 23 24 25 26 27 28 29 30 31 32 33 34 35 36 37 38 39 40 41 42 43 44 45 46 47 48 49 50 51 52 53 54 55 56 57
in water table heights have been identified, an initial increase starting ~3000 cal a BP and a 398
subsequent one starting at the onset of the LIA ~800 cal a BP. The former coincides with the 399
onset of Neoglacial cooler and wetter conditions, which represents a major climatic shift as 400
registered by various climatic and environmental reconstructions (Allard and Seguin, 1987; 401
Payette and Gagnon, 1985; Viau and Gajewski, 2009). Moreover, the second regional water table 402
increase during the LIA corresponds to data from Arlen-Pouliot (2009). As a precipitation 403
increase by itself may not have been important enough to increase water levels, we suggest that 404
the surface moisture excess may have been positively influenced by a decrease in evaporation. 405
Our results do not indicate an increase in water tables during the 20th century, probably 406
influenced by important warming and higher productivity. High-resolution paleoecological 407
analyses, combined with detailed aerial images to cover spatial variability in microtopography 408
(Dissanska et al., 2009) may be highly useful to increase the understanding of future peatland 409
dynamics and carbon sequestration under changing climate regimes. 410
411
Acknowledgements 412
413
Thanks to Geneviève Beaudoin, Sébastien Lacoste, Noémie Cliche Trudeau, and Dr. Minna 414
Välirantafor core collection and to Bassam Ghaleb for laboratory assistance. We are grateful to 415
Dr. André Viau (U. of Ottawa) for providing data on climate reconstructions. Thanks to Les 416
Tourbeux for discussions and inspiration. 417
418
References 419
420
Aaby, B. (1976). Cyclic climatic variations in climate over the past 5,500 yr reflected in raised 421
bogs. Nature 263: 281-284. 422
Ali, AA, Ghaleb, B, Garneau, M, Asnong, H, Loisel, J. (2008). Recent peat accumulation rates in 423
minerotrophic peatlands of the Bay James region, Eastern Canada, inferred by 210Pb and 424
137Cs radiometric techniques. Applied Radiation and Isotopes 66: 1350-1358. 425
Allard, M, Seguin, MK. (1987). Le pergélisol au Québec nordique : bilan et perspectives. 426
Géographie Physique et Quaternaire 41: 12. 427
Appleby, PG, Oldfield, F. (1978). The calculation of lead-210 dates assuming a constant rate of 428
supply of unsupported 210Pb to the sediment. CATENA 5: 1-8. 429
Arlen-Pouliot, Y. (2009). Développement holocène et dynamique récente des tourbières 430
minérotrophes structurées du haut-boréal québécois. PhD thesis, Département de 431
Biologie, Université Laval. 432
Arseneault, D, Sirois, L. (2004). The millennial dynamics of a boreal forest stand from buried 433
trees. Journal of Ecology 92: 490-504. 434
Asselin, H, Payette, S. (2005). Late Holocene opening of the forest tundra landscape in northern 435
Québec, Canada. Global Ecology and Biogeography 14: 307-313. 436
Asselin, H, Payette, S. (2006). Origin and long-term dynamics of a subarctic tree line. 437 Ecoscience 13: 135-142. 438 3 4 5 6 7 8 9 10 11 12 13 14 15 16 17 18 19 20 21 22 23 24 25 26 27 28 29 30 31 32 33 34 35 36 37 38 39 40 41 42 43 44 45 46 47 48 49 50 51 52 53 54 55 56 57
Barber, KE, Chambers, FM, Maddy, D, Stoneman, R, Brew, JS. (1994). A sensitive high-439
resolution record of late Holocene climatic change from a raised bog in northern England. 440
The Holocene 4: 198-205. 441
Bastien, D-F, Garneau, M. (1997). Clé d’identification macroscopique de 36 espèces de 442
sphaignes de l’Est du Canada, pp. 43. Ressources naturelles Canada, Commission 443
géologique du Canada, Ottawa. 444
Beaulieu-Audy, V, Garneau, M, Richard, PJH, Asnong, H. (2009). Holocene palaeoecological 445
reconstruction of three boreal peatlands in the La Grande Riviere region, Quebec, 446
Canada. The Holocene 19: 459-476. 447
Bégin, Y. (2001). Tree-ring dating of extreme lake levels at the subarctic-boreal interface. 448
Quaternary Research 55: 133-139. 449
Belyea, LR, Clymo, RS. (2001). Feedback control of the rate of peat formation. Proceedings: 450
Biological Sciences 268: 1315-1321. 451
Blaauw, M. (2010). Methods and code for 'classical' age-modelling of radiocarbon sequences. 452
Quaternary Geochronology 5: 512-518. 453
Booth, RK. (2008). Testate amoebae as proxies for mean annual water-table depth in Sphagnum-454
dominated peatlands of North America. Journal of Quaternary Science 23: 43-57. 455
Brook, EJ, Harder, S, Severinghaus, J, Steig, EJ, Sucher, CM. (2000). On the origin and timing 456
of rapid changes in atmospheric methane during the Last Glacial Period. Global 457
Biogeochemical Cycles 14: 559-572. 458
Chambers, FM, Mauquoy, D, Brain, SA, Blaauw, M, Daniell, JRG. (2007). Globally 459
synchronous climate change 2800 years ago: proxy data from peat in South America. 460
Earth and Planetary Science Letters 253: 439-444. 461
Charman, DJ. (1995). Patterned fen development in northern Scotland: Hypothesis testing and 462
comparison with ombrotrophic blanket peats. Journal of Quaternary Science 10: 327-463
342. 464
Charman, DJ. (2002). Peatlands and environmental change. John Wiley & Sons Ltd., 465
Chichester. 466
Charman, DJ, Blundell, A, Chiverrell, RC, Hendon, D, Langdon, PG. (2006). Compilation of 467
non-annually resolved Holocene proxy climate records: stacked Holocene peatland 468
palaeo-water table reconstructions from northern Britain. Quaternary Science Reviews 469
25: 336-350. 470
Charman, DJ, Blundell, A, Members, A. (2007). A new European testate amoebae transfer 471
function for palaeohydrological reconstruction on ombrotrophic peatlands. Journal of 472
Quaternary Science 22: 209-221. 473
Charman, DJ, Hendon, D, Woodland, WA. (2000). The identification of testate amoebae 474
(Protozoa: Rhizopoda) in peats. Quaternary Research Association, London. 475
Cliche Trudeau, N, Garneau, M, Pelletier, L. (2012). Methane fluxes from a patterned fen of the 476
northeastern part of the La Grande river watershed, James Bay, Canada. Biogeochemistry 477
113 : 409-422. 478
Cliche Trudeau, N. (2011). Variabilité interannuelle du budget du carbone dans une tourbière 479
aqualysée de la portion nord-est du bassin-versant de la rivière La Grande. MSc thesis, 480
Département de Géographie, Université du Québec à Montréal. 481
Couillard, L, Payette, S. (1985). Évolution holocène d'une tourbière à pergélisol (Québec 482
nordique). Canadian Journal of Botany 63: 1104-1121. 483 3 4 5 6 7 8 9 10 11 12 13 14 15 16 17 18 19 20 21 22 23 24 25 26 27 28 29 30 31 32 33 34 35 36 37 38 39 40 41 42 43 44 45 46 47 48 49 50 51 52 53 54 55 56 57
Crum, HA, Anderson, LE. (1979-1980). Mosses of eastern North America. Columbia University 484
Press, New York. 485
Dissanska, M, Bernier, M, Payette, S. (2009). Object-based classification of very high resolution 486
panchromatic images for evaluating recent change in the structure of patterned peatlands. 487
Canadian Journal of Remote Sensing 35: 189-215. 488
Filion, L. (1984). A relationship between dunes, fire and climate recorded in the Holocene 489
deposits of Quebec. Nature 309: 543-546. 490
Flanagan, LB, Syed, KH. (2011). Stimulation of both photosynthesis and respiration in response 491
to warmer and drier conditions in a boreal peatland ecosystem. Global Change Biology 492
17: 2271-2287. 493
Foster, DR, Fritz, SC. (1987). Mire development, pool formation and landscape processes on 494
patterned fens in Dalarna, central Sweden. Journal of Ecology 75: 409-437. 495
Foster, DR, King, GA. (1984). Landscape features, vegetation and developmental history of a 496
patterned fen in south-eastern Labrador, Canada. Journal of Ecology 72: 115-143. 497
Foster, DR, King, GA, Santelmann, MV. (1988). Patterned fens of western Labrador and 498
adjacent Quebec: phytosociology, water chemistry, landform features, and dynamics of 499
surface patterns. Canadian Journal of Botany 66: 2402-2418. 500
Frolking, SE, Bubier, JL, Moore, TR, Ball, T, Bellisario, LM, Bhardwaj, A, Carroll, P, Crill, PM, 501
Lafleur, PM, McCaughey, JH, Roulet, NT, Suyker, AE, Verma, SB, Waddington, JM, 502
Whiting, GJ. (1998). Relationship between ecosystem productivity and 503
photosynthetically active radiation for northern peatlands. Global Biogeochemical Cycles 504
12: 115-126. 505
Frolking, SE, Roulet, NT. (2007). Holocene radiative forcing impact of northern peatland carbon 506
accumulation and methane emissions. Global Change Biology 13: 1079-1088. 507
Gorham, E. (1991). Northern peatlands: role in the carbon cycle and probable responses to 508
climatic warming. Ecological Applications 1: 182-195. 509
Grosse-Brauckmann, G. (1986). Analysis of vegetative plant macrofossils. In Handbook of 510
Holocene Palaeoecology and Palaeohydrology, (BE Berglund, Ed.). John Wiley & Sons: 511
Chichester; 591-618. 512
Hendon, D, Charman, DJ. (1997). The preparation of testate amoebae (Protozoa: Rhizopoda) 513
samples from peat. The Holocene 7: 199-205. 514
Hughes, PDM, Dumayne-Peaty, L. (2002). Testing theories of mire development using multiple 515
successions at Crymlyn Bog, West Glamorgan, South Wales, UK. Journal of Ecology 90: 516
456-471. 517
Hutchinson, MF, McKenney, DW, Lawrence, K, Pedlar, JH, Hopkinson, RF, Milewska, E, 518
Papadopol, P. (2009). Development and testing of Canada-wide interpolated spatial 519
models of daily minimum–maximum temperature and precipitation for 1961–2003. 520
Journal of Applied Meteorology and Climatology 48: 725-741. 521
IPCC. (2007). Climate change 2007: The physical science basis. In Contribution of Working 522
Group I to the Fourth Assessment Report of the Intergovernmental Panel on Climate
523
Change. (S Solomon, D Qin, M Manning, Z Chen, M Marquis, KB Averyt, M Tignor, 524
HL Miller, Eds.), pp. 996, Cambridge. 525
Ireland, RR. (1982). Moss flora of the maritime provinces. National Museums of Canada, 526
Ottawa. 527
Juggins, S. (2007). C2 Version 1.5 User guide. Software for ecological and palaeoecological 528
data analysis and visualisation. Newcastle University, Newcastle upon Tyne. 529 3 4 5 6 7 8 9 10 11 12 13 14 15 16 17 18 19 20 21 22 23 24 25 26 27 28 29 30 31 32 33 34 35 36 37 38 39 40 41 42 43 44 45 46 47 48 49 50 51 52 53 54 55 56 57
Karofeld, E, Kasemets, M, Szava-Kovats, R, Tõnisson, H. (2008). Does anticipated warming 530
accelerate bog pool bottom rise, topographic changes and related peat decomposition? In 531
13th International Peat Congress. (C Farrell, J Feehan, Eds.), pp. 587-591. University 532
College Dublin, International Peat Society, Tullamore. 533
Kerwin, MW, Overpeck, JT, Webb, RS, Anderson, KH. (2004). Pollen-based summer 534
temperature reconstructions for the eastern Canadian boreal forest, subarctic, and Arctic. 535
Quaternary Science Reviews 23: 1901-1924. 536
Korhola, A, Ruppel, M, Seppä, H, Väliranta, M, Virtanen, T, Weckström, J. (2010). The 537
importance of northern peatland expansion to the late-Holocene rise of atmospheric 538
methane. Quaternary Science Reviews 29: 611-617. 539
Lamarre, A, Garneau, M, Magnan, G. (in press). A testate amoeba-based transfer function for 540
paleohydrological reconstruction from boreal and subarctic peatlands in northeastern 541
Canada. Quaternary International 542
Lamentowicz, L, Lamentowicz, M, Gabka, M. (2008). Testate amoebae ecology and a local 543
transfer function from a peatland in western Poland. Wetlands 28: 164-175. 544
Lévesque, PEM, Dinel, H, Larouche, A. (1988). Guide illustré des macrofossiles végétaux des 545
tourbières du Canada (A Canada, Ed.), pp. 65. Centre de recherche sur les terres; 546
Direction générale de la recherche, Ottawa. 547
Loisel, J, Garneau, M. (2010). Late Holocene paleoecohydrology and carbon accumulation 548
estimates from two boreal peat bogs in eastern Canada: Potential and limits of multi-549
proxy archives. Palaeogeography, Palaeoclimatology, Palaeoecology 291: 493-533. 550
MacDonald, GM, Beilman, DW, Kremenetski, KV, Sheng, Y, Smith, LC, Velichko, AA. (2006). 551
Rapid early development of circumarctic peatlands and atmospheric CH4 and CO2 552
variations. Science 314: 285-288. 553
Mann, ME, Zhang, Z, Rutherford, S, Bradley, RS, Hughes, MK, Shindell, D, Ammann, C, 554
Faluvegi, G, Ni, F. (2009). Global signatures and dynamical origins of the Little Ice Age 555
and Medieval Climate Anomaly. Science 326: 1256-1260. 556
Marie-Victorin, F. (1995). Flore Laurentienne, third edition. Les Presses de l'Université de 557
Montréal. 558
Mauquoy, D, Yeloff, D, van Geel, B, Charman, DJ, Blundell, A. (2008). Two decadally resolved 559
records from north-west European peat bogs show rapid climate changes associated with 560
solar variability during the mid-late Holocene. Journal of Quaternary Science 23: 745-561
763. 562
Mitchell, EAD, Payne, RJ, Lamentowicz, M. (2008). Potential implications of differential 563
preservation of testate amoeba shells for paleoenvironmental reconstruction in peatlands. 564
Journal of Paleolimnology 40: 603-618. 565
Mogensen, GS. (1986). Illustrated moss flora of Arctic North America and Greenland, 2. 566
Sphagnaceae. Meddelelser om Gronland. Commission for Scientific Research in 567
Greenland, Copenhagen. 568
Montgomery, FH. (1977). Seeds and fruits of plants of eastern Canada and northeastern United 569
States. University of Toronto Press, Toronto; Buffalo. 570
Payette, S, Delwaide, A. (2004). Dynamics of subarctic wetland forests over the past 1500 years 571
Ecological Monographs 74: 373-391. 572
Payette, S, Delwaide, A, Caccianiga, M, Beauchemin, M. (2004). Accelerated thawing of 573
subarctic peatland permafrost over the last 50 years. Geophysical Research Letters 31: 574 L18208. 575 3 4 5 6 7 8 9 10 11 12 13 14 15 16 17 18 19 20 21 22 23 24 25 26 27 28 29 30 31 32 33 34 35 36 37 38 39 40 41 42 43 44 45 46 47 48 49 50 51 52 53 54 55 56 57
Payette, S, Gagnon, R. (1985). Late Holocene deforestation and tree regeneration in the forest-576
tundra of Quebec. Nature 313: 570-572. 577
Payette, S, Rochefort, L. (2001). Écologie des tourbières du Québec-Labrador. Les presses de 578
l'Université Laval, Ste-Foy. 579
Payne, RJ. (2011). Can testate amoeba-based palaeohydrology be extended to fens? Journal of 580
Quaternary Science 26: 15-27. 581
Payne, RJ, Charman, DJ, Matthews, S, Eastwood, WJ. (2008). Testate amoebae as 582
palaeohydrological proxies in Surmene Agacbasi Yaylasi Peatland (Northeast Turkey). 583
Wetlands 28: 311-323. 584
Payne, RJ, Mitchell, EAD. (2008). How many is enough? Determining optimal count totals for 585
ecological and palaeoecological studies of testate amoebae. Journal of Paleolimnology: 586
1-13. 587
Pelletier, L, Garneau, M, Moore, TR. (2011). Variation in CO2 exchange over three summers at 588
microform scale in a boreal bog, Eastmain region, Québec, Canada. Journal of 589
Geophysical Research G: Biogeosciences 116. 590
R Development Core Team (2009). R: A language and environment for statistical computing. R 591
Foundation for Statistical Computing, Vienna. 592
Ruddiman, WF, Kutzbach, JE, Vavrus, SJ. (2011). Can natural or anthropogenic explanations of 593
late-Holocene CO2 and CH4 increases be falsified? The Holocene 21: 865-8879. 594
Saucier, J-P, Bergeron, J-F, Grondin, P, Robitaille, A. (1998). Les régions écologiques du 595
Québec méridional (3e version): un des éléments du système hiérarchique de 596
classification écologique du territoire mis au point par le ministère des Ressources 597
naturelles du Québec. L'Aubelle 124: 1-12. 598
Singarayer, JS, Valdes, PJ, Friedlingstein, P, Nelson, S, Beerling, DJ. (2011). Late Holocene 599
methane rise caused by orbitally controlled increase in tropical sources. Nature 470: 82-600
86. 601
Tahvanainen, T. (2011). Abrupt ombrotrophication of a boreal aapa mire triggered by 602
hydrological disturbance in the catchment. Journal of Ecology 99: 404-415. 603
Tardif, S, St-Hilaire, A, Roy, R, Bernier, M, Payette, S. (2009). Statistical properties of 604
hydrographs in minerotrophic fens and small lakes in mid-latitude Québec, Canada. 605
Canadian Water Resources Journal 34: 365-380. 606
van Bellen, S, Dallaire, P-L, Garneau, M, Bergeron, Y. (2011a). Quantifying spatial and 607
temporal Holocene carbon accumulation in ombrotrophic peatlands of the Eastmain 608
region, Quebec, Canada. Global Biogeochemical Cycles 25. 609
van Bellen, S, Garneau, M, Booth, RK. (2011b). Holocene carbon accumulation rates from three 610
ombrotrophic peatlands in boreal Quebec, Canada: Impact of climate-driven 611
ecohydrological change. The Holocene 21: 1217-1231. 612
van Geel, B, Buurman, J, Waterbolk, HT. (1996). Archaeological and palaeoecological 613
indications of an abrupt climate change in The Netherlands, and evidence for 614
climatological teleconnections around 2650 BP. Journal of Quaternary Science 11: 451-615
460. 616
Viau, AE, Gajewski, K. (2009). Reconstructing millennial-scale, regional paleoclimates of boreal 617
Canada during the Holocene. Journal of Climate 22: 316-330. 618
Waddington, JM, Roulet, NT. (1996). Atmosphere-wetland carbon exchanges: scale dependency 619
of CO2 and CH4 exchange on the developmental topography of a peatland. Global 620 Biogeochemical Cycles 10: 233-245. 621 3 4 5 6 7 8 9 10 11 12 13 14 15 16 17 18 19 20 21 22 23 24 25 26 27 28 29 30 31 32 33 34 35 36 37 38 39 40 41 42 43 44 45 46 47 48 49 50 51 52 53 54 55 56 57
Wanner, H, Solomina, O, Grosjean, M, Ritz, SP, Jetel, M. (2011). Structure and origin of 622
Holocene cold events. Quaternary Science Reviews 30: 3109-3123. 623
Warner, BG, Charman, DJ. (1994). Holocene changes on a peatland in northwestern Ontario 624
interpreted from testate amoebae (Protozoa) analysis. Boreas 23: 270-279. 625
Weckström, J, Seppä, H, Korhola, A. (2010). Climatic influence on peatland formation and 626
lateral expansion in sub-arctic Fennoscandia. Boreas. 627
Wilmshurst, JM, Wiser, SK, Charman, DJ. (2003). Reconstructing Holocene water tables in New 628
Zealand using testate amoebae: Differential preservation of tests and implications for the 629
use of transfer functions. The Holocene 13: 61-72. 630
Yu, Z. (2011). Holocene carbon flux histories of the world’s peatlands: Global carbon-cycle 631
implications. The Holocene. 632
Yu, Z, Beilman, DW, Jones, MC. (2009). Sensitivity of northern peatland carbon dynamics to 633
Holocene climate change. In Carbon cycling in northern peatlands, (AJ Baird, LR 634
Belyea, X Comas, AS Reeve, LD Slater, Eds.). Geophysical Monograph. American 635
Geophysical Union: Washington; 55-69. 636
Yu, Z, Vitt, DH, Campbell, ID, Apps, MJ. (2003). Understanding Holocene peat accumulation 637
pattern of continental fens in western Canada. Canadian Journal of Botany 81: 267-282. 638
Zoltai, SC, Taylor, S, Jeglum, JK, Mills, GF, Johnson, JD. (1988). Wetlands of boreal Canada. In 639
Wetlands of Canada, (NWW Group, Ed.). Polyscience Publications Inc.: Montreal; 97-640 154. 641 642 643 644 645 646 647 648 649 650 651 652 653 654 655 656 3 4 5 6 7 8 9 10 11 12 13 14 15 16 17 18 19 20 21 22 23 24 25 26 27 28 29 30 31 32 33 34 35 36 37 38 39 40 41 42 43 44 45 46 47 48 49 50 51 52 53 54 55 56 57
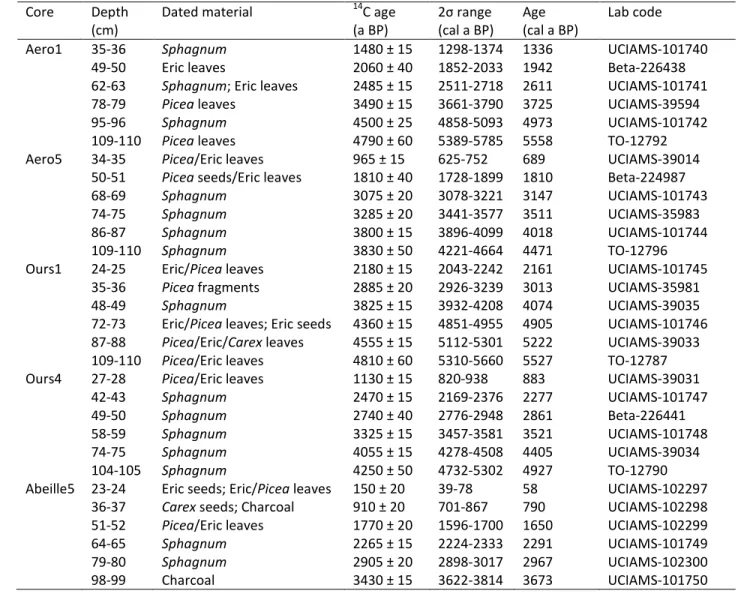
Table 1: Radiocarbon dating sample details and inferred ages from CLAM (Blaauw, 2010). Eric 657 = Ericaceae. 658 659 660 661 662 663 664 665 666 667 Core Depth (cm)
Dated material 14C age
(a BP) 2σ range (cal a BP) Age (cal a BP) Lab code
Aero1 35-36 Sphagnum 1480 ± 15 1298-1374 1336 UCIAMS-101740
49-50 Eric leaves 2060 ± 40 1852-2033 1942 Beta-226438
62-63 Sphagnum; Eric leaves 2485 ± 15 2511-2718 2611 UCIAMS-101741
78-79 Picea leaves 3490 ± 15 3661-3790 3725 UCIAMS-39594
95-96 Sphagnum 4500 ± 25 4858-5093 4973 UCIAMS-101742
109-110 Picea leaves 4790 ± 60 5389-5785 5558 TO-12792
Aero5 34-35 Picea/Eric leaves 965 ± 15 625-752 689 UCIAMS-39014
50-51 Picea seeds/Eric leaves 1810 ± 40 1728-1899 1810 Beta-224987
68-69 Sphagnum 3075 ± 20 3078-3221 3147 UCIAMS-101743
74-75 Sphagnum 3285 ± 20 3441-3577 3511 UCIAMS-35983
86-87 Sphagnum 3800 ± 15 3896-4099 4018 UCIAMS-101744
109-110 Sphagnum 3830 ± 50 4221-4664 4471 TO-12796
Ours1 24-25 Eric/Picea leaves 2180 ± 15 2043-2242 2161 UCIAMS-101745
35-36 Picea fragments 2885 ± 20 2926-3239 3013 UCIAMS-35981
48-49 Sphagnum 3825 ± 15 3932-4208 4074 UCIAMS-39035
72-73 Eric/Picea leaves; Eric seeds 4360 ± 15 4851-4955 4905 UCIAMS-101746
87-88 Picea/Eric/Carex leaves 4555 ± 15 5112-5301 5222 UCIAMS-39033
109-110 Picea/Eric leaves 4810 ± 60 5310-5660 5527 TO-12787
Ours4 27-28 Picea/Eric leaves 1130 ± 15 820-938 883 UCIAMS-39031
42-43 Sphagnum 2470 ± 15 2169-2376 2277 UCIAMS-101747
49-50 Sphagnum 2740 ± 40 2776-2948 2861 Beta-226441
58-59 Sphagnum 3325 ± 15 3457-3581 3521 UCIAMS-101748
74-75 Sphagnum 4055 ± 15 4278-4508 4405 UCIAMS-39034
104-105 Sphagnum 4250 ± 50 4732-5302 4927 TO-12790
Abeille5 23-24 Eric seeds; Eric/Picea leaves 150 ± 20 39-78 58 UCIAMS-102297
36-37 Carex seeds; Charcoal 910 ± 20 701-867 790 UCIAMS-102298
51-52 Picea/Eric leaves 1770 ± 20 1596-1700 1650 UCIAMS-102299
64-65 Sphagnum 2265 ± 15 2224-2333 2291 UCIAMS-101749 79-80 Sphagnum 2905 ± 20 2898-3017 2967 UCIAMS-102300 98-99 Charcoal 3430 ± 15 3622-3814 3673 UCIAMS-101750 3 4 5 6 7 8 9 10 11 12 13 14 15 16 17 18 19 20 21 22 23 24 25 26 27 28 29 30 31 32 33 34 35 36 37 38 39 40 41 42 43 44 45 46 47 48 49 50 51 52 53 54 55 56 57
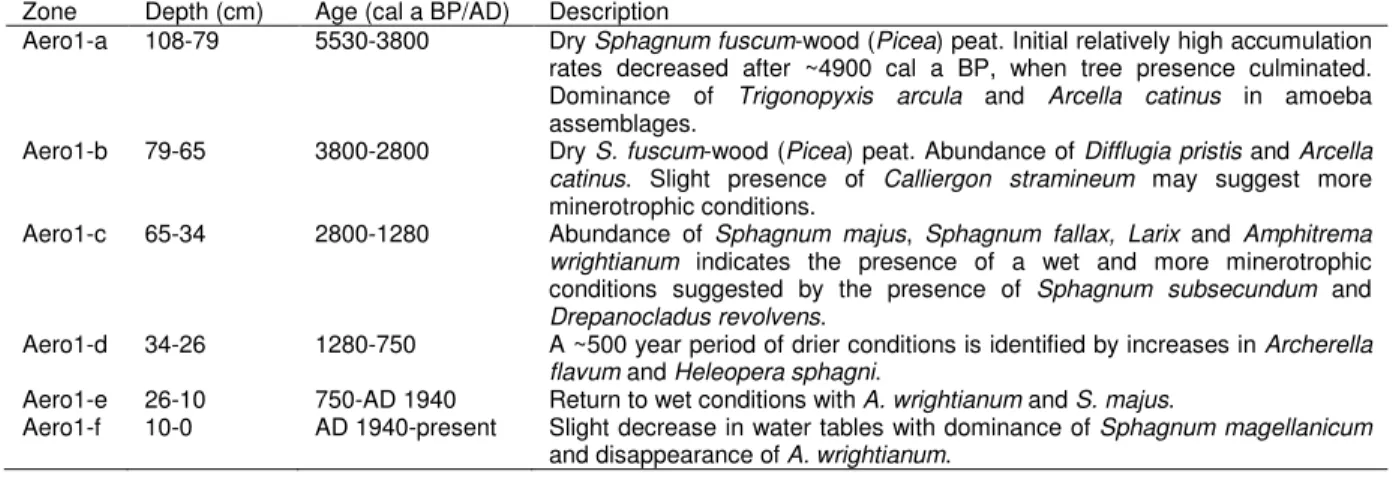
Table 2: Zonation details for Aero1. 668
669
Zone Depth (cm) Age (cal a BP/AD) Description
Aero1-a 108-79 5530-3800 Dry Sphagnum fuscum-wood (Picea) peat. Initial relatively high accumulation rates decreased after ~4900 cal a BP, when tree presence culminated. Dominance of Trigonopyxis arcula and Arcella catinus in amoeba assemblages.
Aero1-b 79-65 3800-2800 Dry S. fuscum-wood (Picea) peat. Abundance of Difflugia pristis and Arcella catinus. Slight presence of Calliergon stramineum may suggest more minerotrophic conditions.
Aero1-c 65-34 2800-1280 Abundance of Sphagnum majus, Sphagnum fallax, Larix and Amphitrema wrightianum indicates the presence of a wet and more minerotrophic conditions suggested by the presence of Sphagnum subsecundum and Drepanocladus revolvens.
Aero1-d 34-26 1280-750 A ~500 year period of drier conditions is identified by increases in Archerella flavum and Heleopera sphagni.
Aero1-e 26-10 750-AD 1940 Return to wet conditions with A. wrightianum and S. majus.
Aero1-f 10-0 AD 1940-present Slight decrease in water tables with dominance of Sphagnum magellanicum and disappearance of A. wrightianum.
670 671 672 673 674 675 676 677 678 679 680 681 682 683 684 685 686 3 4 5 6 7 8 9 10 11 12 13 14 15 16 17 18 19 20 21 22 23 24 25 26 27 28 29 30 31 32 33 34 35 36 37 38 39 40 41 42 43 44 45 46 47 48 49 50 51 52 53 54 55 56 57
Table 3: Zonation details for Aero5. 687
688
Zone Depth (cm) Age (cal a BP/AD) Description
Aero5-a 109-92 4470-4200 Wet hollow conditions were present during this period, as indicated by a dominance of Amphitrema wrightianum and Sphagnum majus. Accumulation rates were high with sample time spans <10 a cm-1.
Aero5-b 92-71 4200-3340 Water tables decreased at the start of this period, as indicated by the presence of Sphagnum fuscum, Difflugia pulex, Picea mariana needles and Cenococcum sclerotia.
Aero5-c 71-45 3340-1460 Herbaceae peat with Sphagnum subsecundum and S. majus suggests minerotrophic conditions. Hydrophilous A. wrightianum presence culminates ~2050 cal a BP.
Aero5-d 45-36 1460-820 Water tables decrease rapidly while S. fuscum reappears. Cenococcum sclerotia and decreasing presence of A. wrightianum confirm dry conditions on the site.
Aero5-e 36-20 820-AD 1890 Herbaceae peat with S. majus and Sphagnum magellanicum indicates a return to wet hollow conditions.
Aero5-f 20-0 AD 1890-present Presence of dry lawn conditions as shown by S. fuscum and the quasi-disappearance of A. wrightianum. 689 690 691 692 693 694 695 696 697 698 699 700 701 702 703 704 705 3 4 5 6 7 8 9 10 11 12 13 14 15 16 17 18 19 20 21 22 23 24 25 26 27 28 29 30 31 32 33 34 35 36 37 38 39 40 41 42 43 44 45 46 47 48 49 50 51 52 53 54 55 56 57
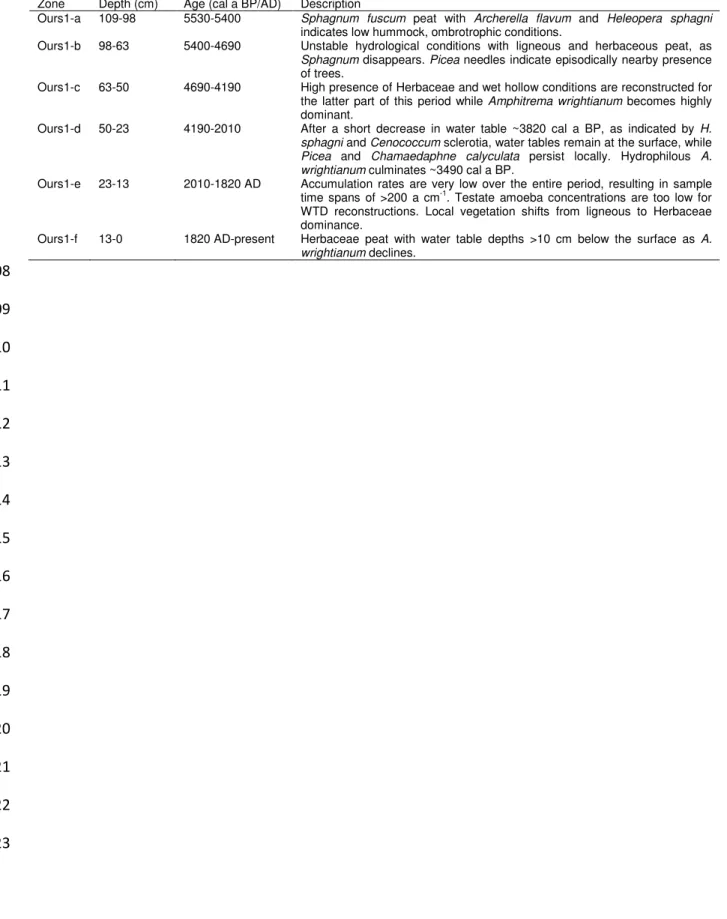
Table 4: Zonation details for Ours1. 706
707
Zone Depth (cm) Age (cal a BP/AD) Description
Ours1-a 109-98 5530-5400 Sphagnum fuscum peat with Archerella flavum and Heleopera sphagni indicates low hummock, ombrotrophic conditions.
Ours1-b 98-63 5400-4690 Unstable hydrological conditions with ligneous and herbaceous peat, as Sphagnum disappears. Picea needles indicate episodically nearby presence of trees.
Ours1-c 63-50 4690-4190 High presence of Herbaceae and wet hollow conditions are reconstructed for the latter part of this period while Amphitrema wrightianum becomes highly dominant.
Ours1-d 50-23 4190-2010 After a short decrease in water table ~3820 cal a BP, as indicated by H. sphagni and Cenococcum sclerotia, water tables remain at the surface, while Picea and Chamaedaphne calyculata persist locally. Hydrophilous A. wrightianum culminates ~3490 cal a BP.
Ours1-e 23-13 2010-1820 AD Accumulation rates are very low over the entire period, resulting in sample time spans of >200 a cm-1. Testate amoeba concentrations are too low for WTD reconstructions. Local vegetation shifts from ligneous to Herbaceae dominance.
Ours1-f 13-0 1820 AD-present Herbaceae peat with water table depths >10 cm below the surface as A. wrightianum declines. 708 709 710 711 712 713 714 715 716 717 718 719 720 721 722 723 3 4 5 6 7 8 9 10 11 12 13 14 15 16 17 18 19 20 21 22 23 24 25 26 27 28 29 30 31 32 33 34 35 36 37 38 39 40 41 42 43 44 45 46 47 48 49 50 51 52 53 54 55 56 57
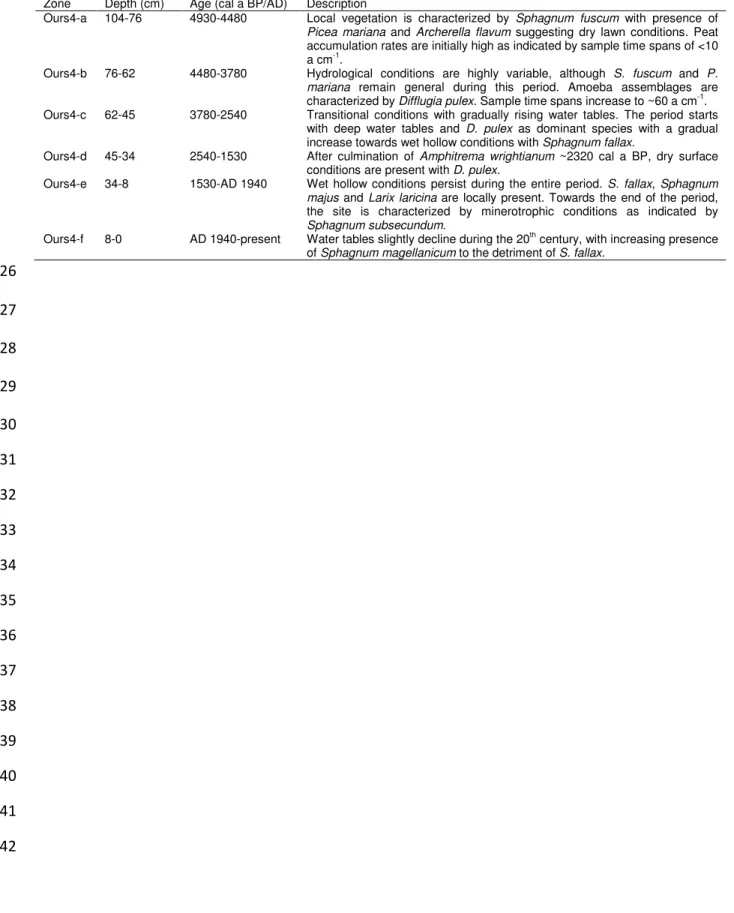
Table 5: Zonation details for Ours4. 724
725
Zone Depth (cm) Age (cal a BP/AD) Description
Ours4-a 104-76 4930-4480 Local vegetation is characterized by Sphagnum fuscum with presence of Picea mariana and Archerella flavum suggesting dry lawn conditions. Peat accumulation rates are initially high as indicated by sample time spans of <10 a cm-1
.
Ours4-b 76-62 4480-3780 Hydrological conditions are highly variable, although S. fuscum and P. mariana remain general during this period. Amoeba assemblages are characterized by Difflugia pulex. Sample time spans increase to ~60 a cm-1. Ours4-c 62-45 3780-2540 Transitional conditions with gradually rising water tables. The period starts
with deep water tables and D. pulex as dominant species with a gradual increase towards wet hollow conditions with Sphagnum fallax.
Ours4-d 45-34 2540-1530 After culmination of Amphitrema wrightianum ~2320 cal a BP, dry surface conditions are present with D. pulex.
Ours4-e 34-8 1530-AD 1940 Wet hollow conditions persist during the entire period. S. fallax, Sphagnum majus and Larix laricina are locally present. Towards the end of the period, the site is characterized by minerotrophic conditions as indicated by Sphagnum subsecundum.
Ours4-f 8-0 AD 1940-present Water tables slightly decline during the 20th century, with increasing presence of Sphagnum magellanicum to the detriment of S. fallax.
726 727 728 729 730 731 732 733 734 735 736 737 738 739 740 741 742 3 4 5 6 7 8 9 10 11 12 13 14 15 16 17 18 19 20 21 22 23 24 25 26 27 28 29 30 31 32 33 34 35 36 37 38 39 40 41 42 43 44 45 46 47 48 49 50 51 52 53 54 55 56 57
Table 6: Zonation details for Abeille5. 743
744
Zone Depth (cm) Age (cal a BP) Description
Abeille5-a 98-78 3670-2930 Ligneous peat with Sphagnum fuscum and Picea mariana indicates local deep water tables. Abundant charcoal and Cenococcum sclerotia support the interpretation of this period as being generally dry yet fluctuating.
Abeille5-b 78-64 2930-2290 The local vegetation opens up as a wet hollow develops. Ligneous species decline drastically. Sphagnum spp. become more important, while water tables decrease after ~2750 cal a BP. Amoeba assemblages shift between domination of Difflugia pulex to Archerella flavum.
Abeille5-c 64-49 2290-1550 Water tables rapidly increase and remain at the surface as indicated by Amphitrema wrightianum, Sphagnum majus and Sphagnum recurvum type Abeille5-d 49-29 1550-280 Herbaceae dominate the local vegetation while Sphagnum disappears. The
occasional presence of Sphagnum subsecundum and Menyanthes trifoliata suggest minerotrophic flark conditions.
Abeille5-e 29-0 280-present Sphagnum rubellum appears locally, indicating lawn conditions after AD 1760. A decline in water level is reconstructed since AD 1940.
745 746 747 748 749 750 751 752 753 754 755 756 757 758 759 760 761 762 763 3 4 5 6 7 8 9 10 11 12 13 14 15 16 17 18 19 20 21 22 23 24 25 26 27 28 29 30 31 32 33 34 35 36 37 38 39 40 41 42 43 44 45 46 47 48 49 50 51 52 53 54 55 56 57