ii
Decision support for infrastructure
network vulnerability assessment in
iii
Aide à la décision pour l’analyse de la
vulnérabilité des réseaux
d’infrastructure face à une crise de
catastrophe naturelle
iv
To those who Fight the evil; Defend the good; Work for freedom; Cultivate peace; Seek the truth; Dream of justice; Believe in equality; Learn continuously; Endure patiently; Hope tirelessly;
To my family and friends
To all citizens of the world
v
À ceux qui Combattent le mal Défendent le bien Travaillent pour la liberté Cultivent la paix Ont foi en la vérité Rêvent de justice Croient en l’égalité Apprennent sans cesse Endurent patiemment Espèrent sans relâche
À ma famille et ami(e)s
À tous les citoyens du monde
vi
ACKNOW LEDGMENT
By writing these lines, I’m thinking of a substantial number of people who have always stood me during this thesis.
I begin quite naturally by my two supervisors: Professor Pascale ZARATÉ and Professor François PÉRÈS. Without their careful supervision and the relevance of their comments, this thesis certainly could not be achieved. Beyond their scientific and pedagogical qualities, they knew bear me tirelessly, understand me in difficult moments and share the joys inherent in the research work.
I thank the two reviewers of this thesis: Professor Shaofeng LIU and Professor Adolfo Crespo MÁRQUEZ. I was very honoured by the welcome that Professor LIU has given me during my stay in England. Our exchanges always rewarding have been a source of inspiration and have strengthened my rigor spirit.
I also thank the other members of the committee: Madame Scira MENONI, Madame Myriam MERAD, Madame Zineb SIMEU-ABAZI, and Mister Pascale HAURINE. The exchanges with Madame MERAD during this work allowed me to have the necessary detachment to pursue the thesis with serenity. The help of Mr HAURINE and his team has been crucial to validate our models. With their help, we were able to get some data on the city of Lourdes where we deployed the case study.
My thanks go also to the colleagues of the three laboratories where I had the pleasure of staying: The Laboratory Production Engineering in Tarbes, the Toulouse Research Institute in Computer Science and the Plymouth Management School in England. That everyone finds in these lines my deep appreciation and gratitude.
I thank all of my teachers during those long years: Mr SEKOU, Mr SORY, Mr BEN ABDELLAH, Mr BELMIR, Mr FOFANA, Mr SAFOUANE, Mr HAMACI, Mr COUDERT etc. to name a few. You have all at one time influenced my insight. That God recognize you.
A great thought also to my friends: those of Aviation, Martin Luther King Club, Morocco, EPMI, army, social networks. I thank you for your unfailing support, fun and relaxation moments.
I don't know how to thank my family. My dear mother who one day, took me to school to learn how to "sing". My sister Hadja who taught me my first letters of the alphabet. My sister Domanin. My brother N’khôrô, Moussa, Kê, Sory, Laye, Kèlèti. My aunts, uncles, and cousins, I am so proud to have you in my life. Thanks for this complicity. I often doubted, but you-ever. Thanks for everything.
Whom those I was able to forget would not blame me for that. They will find in these lines my gratitude and my apologies. I bet that if I should rewrite this acknowledgment, more than one name will appear.
I also thank the woman who shares my life. One day love, love for ever. She is the most beautiful among the intelligent women and the most intelligent among the beautiful women.
vii
REMERCIEMENTS
En écrivant ces lignes, je pense à un nombre considérable de personnes qui n’ont cessé de me soutenir durant cette thèse.
Je commence tout naturellement par mes deux directeurs de thèse : Professeur Pascale ZARATÉ et Professeur François PÉRÈS. Sans leurs encadrements minutieux et la pertinence de leurs remarques, cette thèse n’aurait certainement pas pu aboutir. Au-delà des leurs qualités scientifiques et pédagogiques, ils ont su me supporter sans relâche, me comprendre dans les moments difficiles et partager les joies inhérentes au travail de recherche.
Je remercie les deux rapporteurs de ce manuscrit : Professeur Shaofeng LIU et Professeur Adolfo Crespo MARQUEZ. J’ai été très honoré de l’accueil qui m’a été réservé par Professeur LIU lors de mon séjour en Angleterre. Nos échanges - toujours enrichissants, ont été une source d’inspiration et ont renforcé mon esprit de rigueur.
Je remercie aussi les autres membres du jury. Madame Scira MENONI, Madame Myriam MERAD, Madame Zineb SIMEU-ABAZI, et Monsieur Pascale HAURINE. Mes échanges avec Madame MERAD, durant ces années de thèse m’ont permis d’avoir le recul nécessaire et de poursuivre la thèse avec sérénité. L’aide de Mr HAURINE et de son équipe a été déterminante pour valider nos modèles. Grace à leurs concours, nous avons pu obtenir certaines données sur la ville de Lourdes où nous avons déployé le cas d’étude.
Mes remerciements vont également aux collègues des trois Laboratoires où j’ai eu l’immense plaisir de séjourner : Le Laboratoire Génie de Production à Tarbes, L’Institut de Recherche en Informatique de Toulouse et le « Plymouth Management School » en Angleterre. Que chacun trouve dans ces lignes toute ma reconnaissance et ma gratitude.
Je remercie l’ensemble des mes enseignants durant ces longues années : Mr SEKOU, Mr SORY, Mr BEN ABDELLAH, Mr BELMIR, Mr FOFANA, Mr SAFOUANE, Mr HAMACI, Mr COUDERT, etc. pour ne citer que ceux-ci. Vous avez tous à un moment donné influencé mon regard sur la science. Que Dieu vous le reconnaisse.
Une grande pensée aussi pour mes ami(e)s : Ceux de l’aviation, du club Martin Luther King, du Maroc, de l’EPMI, de l’armée, des réseaux sociaux. Je vous dis merci pour votre soutien infaillible, les moments de rigolade et de détente.
Je ne sais comment remercier ma famille. Ma chère maman qui un jour m’amena à l’école pour apprendre à « chanter ». Ma sœur Hadja qui m’a appris les premières lettres de l’alphabet. Ma sœur Domanin. Mes frères N’khôrô, Moussa, Kê, Sory, Laye, Kèlèti. Mes tantes, oncles, cousins et cousines, Je suis si fier de vous avoir dans ma vie. Merci pour cette complicité. J’ai souvent douté, mais vous-Jamais. Merci pour tout.
viii
Que ceux dont j’ai pu oublier ne m’en tiennent pas rigueur. Qu’ils trouvent dans ces lignes toute ma reconnaissance et mes excuses. Je parie que si je devrais réécrire ces remerciements plus tard, plus d’un nom y figureront.
Je remercie aussi la femme qui partage ma vie depuis. Amour d’un jour, amour de toujours. La plus belle parmi les intelligentes, la plus intelligente parmi les belles.
ix
ABSTRACT
This thesis deals with infrastructure network vulnerability analysis in the natural disaster context. It starts from the observation that infrastructure such as water supply or power grid has significant influence on natural disasters’ indirect consequences. The aim is to model the vulnerability to take efficient decisions.
The scientific approach is divided into two complementary parts. The first one deals with the vulnerability assessment, while the second one focuses on the decision aiding process to be implemented for the assessed vulnerability management.
The proper vulnerability analysis is based on the analysis objects modelling. In order to achieve this, we will adopt graph theory representation. A literature review will allow us to identify the graph model which best suits the context of the thesis. In a multi network analysis environment, interdependences, i.e. relationships between components of the same or different networks - are a determining factor for any vulnerability model. We have thus proposed an approach to model interdependence compatible with the graph theory. There are two types of relationships: the one first is functional (dependence), while the second one is dysfunctional (influence). The vulnerability is assessed by a simulation-based approach. It is composed of one part relating to the system ability to resist the feared event; and another part relative to its ability to be back on its nominal state after the feared event.
When the vulnerability is determined, the next step will be to take the necessary decisions to manage it. This part on the decision aiding is itself divided into two sub parts: first of all the process to be used for the crisis management is established. Then a methodology for decision aiding is proposed and a Decision Support System prototyped.
Key words: Vulnerability, Risk, Robustness, Resilience, Network, Graph, Decision, ELECTRE, Java, UML, Interdependence, DB, System, Complexity
x
RÉSUMÉ EN FRANÇAIS
Cette thèse traite de la vulnérabilité des réseaux d’infrastructure face aux catastrophes naturelles. Elle part du constat que les infrastructures telles que les réseaux d’eau, d’électricité influencent considérablement les conséquences indirectes des catastrophes naturelles. Elle vise donc à modéliser la vulnérabilité dans de telles situations pour une prise de décision efficace.
La démarche scientifique est divisée en deux parties complémentaires. La première traite de la vulnérabilité des dits réseaux, tandis que la seconde se concentre sur le processus d’aide à la décision à mettre en œuvre en vue de gérer la vulnérabilité.
L’analyse proprement dite de la vulnérabilité repose sur la modélisation des objets de l’analyse. Pour ce faire nous adopterons une représentation par la théorie des graphes. L’état de l’art à ce niveau nous a permis d’identifier les modèles de graphe les mieux adaptées au contexte de cette thèse. Dans un environnement d’analyse multi réseau, les interdépendances, c’est-à-dire les relations entre les composants du même réseau ou entre ceux de réseaux différents-sont un facteur déterminant pour tout modèle de vulnérabilité. Nous avons ainsi proposé un modèle compatible avec la théorie des graphes. Sont distingués deux types d’interdépendances. La première est fonctionnelle (dépendance), et la seconde est dysfonctionnelle (influence). La vulnérabilité quant à elle, est déterminée par une approche basée sur la simulation. Elle est composée d’une première partie relative à l’aptitude du système à résister à l’évènement redouté ; et d’une seconde partie relative à son aptitude à recouvrer des conditions opérationnelles spécifiées après l’occurrence de l’évènement redouté.
Le calcul de la vulnérabilité est un point d’entrée pour assister la prise de décision. La deuxième partie aborde ce thème. Elle est elle-même divisée en deux sous parties : La première aborde le processus à mettre en œuvre pour la gestion de la crise ; la deuxième le Système Interactif d’Aide à la Décision réalisé. Celui-ci implémente le processus d’aide à la décision.
Mots clés : Vulnérabilité, Risque, Robustesse, Résilience, Réseau, Infrastructure, Graphe, Décision, Interdépendance, ELECTRE, Java, UML, BDD, Système, Complexité.
xi
CONTENTS
Acknowledgment... vi Remerciements ... vii Abstract ... ix Résumé en français ... x Contents ... xiTable of figures ...xviii
List of tables ... xxi
Style definition ... xxii
General Introduction ... 1
Motivation... 1
Objectives and delimitations ... 2
Research process ... 3
Introduction générale ... 5
Motivations ... 5
Objectifs et délimitations ... 6
Processus de recherche ... 7
Chapter I Literature review ... 9
Introduction ... 11
I.1: Infrastructure network management literature review ... 11
I.1.1 Graph theory ... 14
Scale-free Network ... 14
Random graph ... 15
Small word network ... 15
I.1.2 Vulnerability metrics ... 15
Betweenness centrality ... 18
xii Clustering coefficient ... 20 Connectivity ... 20 Integrity ... 20 Probability ... 21 Vulnerability function ... 21
I.2: Decision aiding Literature Review ... 21
I.1.3 Decision aiding process ... 23
Linear decision aiding process ... 24
Cyclical decision aiding process ... 25
Hybrid process ... 26
I.1.4 Decision aiding methods ... 27
I.1.4.1 Classical method or single synthesis criterion ... 29
Weighted sum... 31
Laplace criterion ... 31
Bernoulli criterion... 31
The expected value criterion ... 31
Criterion of expected utility ... 32
I.1.4.2 Multicriteria decision aiding ... 32
Choice ... 38 Sorting ... 40 Ranking ... 41 Conclusion ... 44 Chapter II Modelling ... 45 Introduction ... 47
I.3: Vulnerable system representation ... 47
II.1.1 Complex system ... 47
II.1.2 Critical system ... 48
II.1.2.1 Criticity concept applied to infrastructure ... 49
xiii Territory ... 51 Stakes ... 52 Flow ... 52 External environment ... 53 Feared event... 53
I.4: Network Modelling ... 56
II.1.3 Network Definition ... 56
II.1.4 Network Representation Features... 58
II.1.4.1 Modelling rules ... 58
Edges are direction ... 58
Edge weight ... 59
The node type ... 60
II.1.4.2 relationship typology ... 61
Lack of interdependence modelling ... 63
Relationship classification ... 63
II.1.5 Network Modelling Techniques ... 65
II.1.5.1 Relationship representation... 65
Dependence modeling ... 65
Influence modeling ... 65
II.1.5.2 Network component connexions ... 66
Relationship Node -Node ... 66
Relationship Node-Edge ... 66
Relationship Edge -Node ... 67
Relationship Edge-Edge ... 67
II.1.5.3 Dynamic factors ... 68
Circulation laws ... 68
Mitigation and aggravation factors ... 68
I.5: Vulnerability Modelling... 69
xiv
II.1.7 Vulnerability analysis framework ... 72
II.1.8 Vulnerability assessment ... 73
Robustness ... 74
Resilience ... 76
Vulnerability ... 79
Conclusion ... 82
Chapter III Decision aiding ... 83
Introduction ... 85
I.6: Decision making difficulties ... 85
I.7: Decision process ... 87
III.1.1 Decision context characterisation ... 90
III.1.1.1 Crisis level ... 90
III.1.1.2 Risk situation... 92
III.1.1.3 Decision levels ... 93
III.1.1.4 Decision makers identification ... 94
III.1.1.5 Decisions ... 95
III.1.1.6 Decision problems ... 96
Problem ω acceptance and change management ... 97
Problem κ of planning ... 97
III.1.2 System modelling ... 98
III.1.3 Structuration ... 98
III.1.3.1 Potential decision ... 98
III.1.3.2 Preferences systems ... 99
III.1.3.3 Consequences ... 100
III.1.3.4 Evaluation mode ... 100
III.1.4 Muticriteria aggregation ... 101
III.1.5 Integration... 103
I.8: The Decision Support System (DSS) ... 103
xv
III.1.7 The risk of the project ...108
III.1.8 Software engineering process ...109
Waterfall model...110
Prototyping model ...111
Spiral Model ...111
Adopted process ...112
III.1.9 Context modelling ...113
III.1.9.1 Identification of actors ...114
III.1.9.2 The static context diagram ...115
III.1.9.3 The relationship between use cases ...115
III.1.9.4 Use cases by human actor...116
III.1.9.5 Sequence diagram of use case ...117
III.1.9.6 Activity diagram by use case diagram ...118
III.1.10 Architecture ...120
III.1.10.1 The Human Computer Interface ...121
Connexion ...122
Import ...122
Drawing ...122
Parameter filling in...123
Simulation ...124
Calculation ...124
Decision ...124
Final Recommendation ...124
Data base...124
III.1.10.2 The database ...124
The entity relationship model ...125
The object model ...125
III.1.10.3 Model Base ...126
xvi
III.1.12 DSS functionalities ... 127
III.1.12.1 Parameter calculation ... 128
III.1.12.2 Evolution of the parameter ... 129
III.1.12.3 Feared event or scenario... 130
III.1.12.4 The feared event occurrence point ... 130
III.1.12.5 Time to break down ... 131
III.1.12.6 Minimum value of one parameter ... 132
III.1.12.7 Effect of interdependence... 132
III.1.12.8 Request on database ... 133
Conclusion ... 134
Chapter IV Cases Study ... 135
Introduction ... 137
I.9: Generated Case Study ... 137
IV.1.1 Context ... 138
Environment ... 138
Territory... 138
Flow ... 139
Feared events... 139
Mitigation or aggravations factors ... 140
IV.1.2 System final state ... 140
IV.1.3 Results ... 141
I.10: Lourdes Case Study ... 143
IV.1.4 Data collection ... 143
Decision makers’ identification ... 143
The feared event ... 144
Mitigation and aggravation factors ... 146
Territory... 146
Infrastructure ... 146
xvii Stake ...148 External Environment ...148 IV.1.5 results ...148 Conclusion ...152 General conclusion ...154 Contribution ...154 Perspectives ...155 Conclusion générale ...157 Contribution ...157 Perspectives ...158 References ...160 Personal publication ...170 Glossary ...171 Annexes...172
xviii
TABLE OF FIGURES
Figure I-1: Linear decision process by [57] ... 25
Figure I-2: Cyclic decision aiding [58] ... 26
Figure I-3: Hybrid process by [49] ... 26
Figure I-4: Decision aiding methods ... 28
Figure I-5: Type of risk analysis by [54] ... 35
Figure I-6: Multicriteria decision aiding methods for risk analysis type by [54]... 36
Figure I-7: Preference relations ... 37
Figure II-1: Global System overview... 49
Figure II-2: Undirected network ... 58
Figure II-3: Directed network ... 59
Figure II-4: Weighted graph ... 59
Figure II-5: Network of same type of node ... 60
Figure II-6: Network with different types of node ... 60
Figure II-7:Example of cascading diagram by [87] ... 63
Figure II-8: Dependence relationship ... 65
Figure II-9: Dependence relation ... 65
Figure II-10: Dependence Node-Node ... 66
Figure II-11: Virtual components... 66
Figure II-12: Relationship Node-Edge ... 67
Figure II-13: Influence Node-Edge ... 67
Figure II-14: Relationship Edge-Edge ... 67
Figure II-15 Elements of vulnerability ... 70
Figure II-16: Elementary system to analyse ... 70
Figure II-17: Risk and vulnerability analysis ... 71
Figure II-18: Vulnerability view ... 72
Figure II-19: Analysis framework ... 73
Figure II-20: Robustness evolution ... 76
Figure II-21: Resilience for t1 equal constant ... 78
Figure II-22: Resilience for t2 equal constant ... 78
Figure II-23: Vulnerability Classes ... 79
Figure II-24: Robustness and resilience ... 80
xix
Figure III-1 : Decision context ... 87
Figure III-2 : Decision-making process: source [120]... 88
Figure III-3: Decision phases ... 89
Figure III-4: Decision aiding process elements ... 90
Figure III-5: Crisis level ... 91
Figure III-6: Crisis situation inspired from [54] ... 92
Figure III-7: Decision level ... 93
Figure III-8: ELECTRE methods by [62] ...102
Figure III-9: Client-Server functioning ...106
Figure III-10: Application Service Provider functioning...106
Figure III-11: Processes ...109
Figure III-12 : Water-fall model by [138]...110
Figure III-13: Spiral model by ref [138] ...111
Figure III-14: The process of developing a DSS for vulnerability management...112
Figure III-15 : Step ...113
Figure III-16: Static Context Diagram ...115
Figure III-17: Relation between use cases ...116
Figure III-18: Use case for local operator ...117
Figure III-19: Sequence diagram for vulnerability analysis ...118
Figure III-20: Activity diagram for vulnerability analysis ...119
Figure III-21: Decision Support System structure by [121]...120
Figure III-22: Human Computer Interface with Balsamiq ...121
Figure III-23: Log in Panel ...122
Figure III-24: Network drawing ...123
Figure III-25: Node Parameter ...123
Figure III-26: Class diagram with StarUML ...126
Figure III-27: Functionalities of VESTA ...128
Figure III-28: Parameter calculation ...129
Figure III-29: Evolution of a parameter ...129
Figure III-30: Feared event or scenario ...130
Figure III-31: Feared event occurrence point ...131
Figure III-32: Time to break down ...131
Figure III-33:Effect of interdependance ...132
Figure IV-1: Case study ...137
Figure IV-2: Network after feared event occurence ...141
Figure IV-3: Midi-Pyrenées Seismic zoning ...145
xx
Figure IV-5: Lourdes network modelling ... 148 Figure IV-6: Results of the Lourdes case study ... 150 Figure IV-7: Vulnerability of Lourdes network components ... 151
xxi
LIST OF TABLES
Table I-1 : Infrastructure vulnerability review by [1] ... 13 Table I-2: Vulnerability definitions ... 17 Some definitions of the decision are proposed in Table I-3. ... 22 Table I-4: Decision definition ... 22 Table I-5: Elementary methods by [63] ... 30 Table I-6: Outranking methods by [63] ... 34 Table II-1: Network classification ... 56 Table II-2: Critical networks according to European Union, 2004 ... 57 Table II-3 : Relationship between networks ... 64 Table II-4: Robustness definitions ... 74 Table II-5: Resilience definitions ... 77 Table II-6: Vulnerability truth table ... 80 Table III-1: Phases by crisis level ... 92 Table III-2: Martel's decision maker identification ... 94 Table III-3: Decision maker categories ... 95 Table III-4: Decision maker per crisis level ... 95 Table III-5: Problem per phase ... 97 Table III-6: Relational preference systems... 99 Table III-7: Decision making criteria ...100 Table III-8: Aggregation methods ...103 Table III-9: Decision Support System definitions ...105 Table III-10: Decision Support System in the literature ...128 Table III-11: Minimum value of one parameter ...132 Table IV-1: Feared event parameters...139 Table IV-2: Aggravation factor parameters ...140 Table IV-3: Results ...142 Table IV-4: Earthquakes in Lourdes Region ...145
xxii
STYLE DEFINITION
The objective of this part is to facilitate the reading of the thesis by presenting the used style.
The body of the manuscript is written using Arial Narrow style with police 12. Below is presented some examples.
When citing the work of another author the IEEE citation style is used [0].
Examples are in inserts
Table and figure caption are in Arrial Narrow 11. The first number is the number of the chapter followed by an incremental number. For instance Table I.3 is the third table of the chapter I.
Lists are presented as following:
First element; Second element; Etc;
Definition 0-4: Definitions provided in this thesis are in Arial Narrow 11, bold and italic. They are numbered. The first number is that of the chapter and the second is an incremental number.
xxiii
"The beginning is thought to be more than half of the whole" Aristotle
1
General Intr oduction
Motivation
Natural disasters have stricken populations everywhere in the word in the past years. For example in 2004, the Indian Ocean tsunami caused 220,000 deaths. Next, the cyclone Nargis in Myanmar made 138,373 deaths in 2008. In the same year an earthquake in China killed 87,449 people. Two years later in 2010, 230,000 people were killed by an earthquake of 7.0 in Haiti. More recently, in March 2011, a tsunami in Japan made 18,079 deaths.
These few examples show the devastating character of natural disasters for human being. Caused deaths might be induced by disaster direct impact (trauma, asphyxia, drowning, burying, burning,) or by its indirect impact (thirsting, secondary infection of wounds, contamination, epidemic …).
Major causes of deferred deaths problems are partly due to networks disturbance. Consequently, natural disasters are not the only cause of society’s disruption. Infrastructure network failure is among the worst causes. For instance in July 2012, a blackout in India affected over 620 million people. Moreover our societies are depending more and more on these networks (power grid, water, gas, telecommunications systems, etc.). Regarding consequences to population, most feared scenarios are when a natural disaster affects infrastructure networks. Consequences are then amplified. Another aggravation factor is interdependence among networks. In addition, materials, services, energies and information exchanged may aggravate or mitigate consequences. Due to interdependences, failure of a part of a network is likely to spread to the others. This situation makes difficult any risk or vulnerability analysis. For instance, because of interdependence in air travel, the 2010 volcanic eruption in Iceland affected about 20 countries. Despite the advancement in the vulnerability and risk analysis, it is always difficult to make decisions in crisis situations. Disaster is source of stress and anxiety for decision makers which judgment could be affected in such a situation.
France and Europe are not safe from these elements and other furies of the nature. They are subject to all existent feared events on the planet. Witness is the heat wave which occurred in the summer 2003. This heat was responsible for 35,000 deaths in the European continent. In France, departmental files about major risks are established by the prefects and give an overview of natural disasters distribution on the national territory. Today, with widely varying severities, 23,500 communes are exposed to one or more natural disasters: cyclones, storms, floods, avalanches, landslides, earthquakes, volcanic eruptions, forest fires etc. Given this diversity of disasters, their amplitudes and frequencies, it is interesting to investigate the indirect consequences. In particular those induced by network failure.
2
For these reasons we have been motivated to pursue these years of research on the analysis of network vulnerability to natural disaster.
Objectives and delimitations
Deaths caused by natural disasters can be induced by direct impact (trauma, asphyxia by drowning or burial, burning) or indirect impact (superinfecting of wounds, contamination, epidemics). This thesis focuses only on indirect impacts. It assumes that individuals still alive after the natural disaster occurrence could die for reasons related to the assistance inability to respond in a reasonable time on affected areas, or to implement effective health action. This situation is common after the occurrence of an earthquake. The Haiti earthquake is there unfortunately to remind us of that. A disaster by definition is an ordeal that disrupts society and leaves the individual alone face to the crisis for a longer or shorter time. In crisis time, people have to deal with multiple disabilities: stress, public service disruption, time to activate assistance, isolation situation etc. We argue that major causes of deferred death are often due to network disruption. By network we mean interconnected entities facilitating the circulation of useful goods (food, medicines, clothing, blankets etc.), equipment (tools, excavation machines, health infrastructure etc.), services (water, electricity) or information (internet, telephone). This thesis deals with network vulnerability to natural disasters as an entry point to a problem that may increase indirect damage caused to the population. Damage could be aggravated by a lack of decision or by inappropriate decision making.
Taking into account each network separately helps providing interesting but not sufficient information to make the right decision in full knowledge of causes and consequences. The organizational dimensions and decision-making necessary to highlight preventive or corrective solutions in natural disasters context involve working in collaborative mode. These operation modes require adequate tools, adapted to the contexts and profiles of potential users. Decision support tools should be developed on the basis of multi-decision makers model (experts, decision-makers, users), multi-views (before, during, after the disaster) and multi-scales (global or local context).
The techniques of safety operation (reliability, maintainability, availability, security) and risk management (assessment, prevention, mitigation, risk mapping) used in industrial fields will allow the establishment of a vulnerability model. Information extracted from this model will be an input of the decision-making. In a temporal sequence, these techniques can be applied:
To a Pre-event: Organization and implementation of operational emergency services, assessment of the impact of technological innovation on the consequences, estimation of the occurrence probability of a particular event;
During the event: Assessment of the event risk repetition, level of damage estimation depending on the intensity and first testimonials, estimation of assistance means to be used;
3
assistance program for concerned populations, establishment of recovery plans.
This thesis encompasses all these phases. Its objectives are to overcome these problems by:
Modelling interdependent critical infrastructure;
Determining vulnerability of network, component, territory and stakes; Modelling and determining the impact of interdependence on the vulnerability; Correlating the intensity of a feared event and the damage to stakes;
Identifying the worst scenarios;
Determining a decision process for the crisis management; Building a Decision Support System for disaster management.
Research process
To describe and try to find solutions to the described problems, the investigation relied on two scientifically complementary laboratories: the Laboratory Engineering Production (LGP) specialized in industrial engineering and the Toulouse Research Institute in Computer Science (IRIT) specialized in computer science. The thesis program was thus articulated in 2 separated parts on scientific terms but with a common goal:
Part 1: Analysis of network vulnerability
This part was realized in the team Decisional and Cognitive Systems (SDC) of LGP. This laboratory is part of the Tarbes National School of Engineers (ENIT). We worked on infrastructure network vulnerability problems assessment against natural disaster.
Scientific problem: Representation of a sociotechnical system, correlation between intensity of the feared event and damage to the system element, vulnerability and interdependence modelling.
Deliverable: Socio-technical model for the vulnerability assessment.
After this part, we had a stay of four months at the University of Plymouth. The aim was to develop the collaboration with the School of Management and exchange our points of views about decision making in uncertain environment.
Part 2: Decision Aiding in crisis situation
This part was realized in the Cooperative Multi-Agent Systems team at IRIT. We worked on the development of a decision aiding process and a Decision Support System in crisis situation.
Scientific problems: Identification of the passage from nominal situation to a crisis situation, negotiation and decision-making in an uncertain environment.
Deliverable: A decision process implemented in a Decision Support System based on the model developed in part 1.
4
The vulnerability model developed in part 1 should be substantiated according to the descriptive information of the current situation. The results of the simulation carried out through the vulnerability model will constitute inputs for the Decision Support System implemented in part 2.
5
Introduction génér ale
Motivations
Ces dernières années, les catastrophes naturelles ont touché divers populations et infrastructures un peu partout dans le monde. Par exemple, en 2004, le tsunami de l’océan indien provoqua 220 000 morts. Ensuite, ce fut le tour du cyclone Nargis en 2008 à Myanmar. On dénombrera 138 373 morts. La même année un tremblement de terre en Chine sera à l’origine de 87 449 décès. Deux ans plus tard en 2010, 230 000 personnes seront tuées par un séisme de 7 en Haïti. Plus récemment, en mars 2011, un tsunami au Japon causera 18 079 décès.
Ces exemples montrent le caractère dévastateur des catastrophes naturelles pour l'être humain. Les morts sont causés soit par impact direct (traumatisme, asphyxie, noyade, brûlure, blessure) ou par impacts indirects (soif, surinfection des plaies, épidémie...). Nous soutenons que la cause principale des décès différés est liée en partie aux perturbations réseaux. Les défaillances des réseaux d'infrastructure font partie des pires causes de déstabilisation de la société. Par exemple en juillet 2012, une panne d'électricité en Inde a touché plus de 620 millions d’abonnée.
En ce qui concerne les conséquences pour la population, le scénario le plus redouté est quand une catastrophe naturelle affecte des réseaux d'infrastructures. Les conséquences sont alors amplifiées. Un autre facteur d'aggravation est l'interdépendance susceptible d’exister entre les réseaux. En outre, les matériaux, services, énergies et informations échangés peuvent aggraver ou atténuer les conséquences. À cause des interdépendances, la défaillance d'une partie du réseau est susceptible de se propager aux autres. Cette situation rend difficile toute analyse de risque ou de vulnérabilité. Par exemple à cause de l'interdépendance dans le transport aérien, l'éruption volcanique de 2010 en Islande affecta une vingtaine de pays. Malgré l'avancé des techniques d’analyse de la vulnérabilité et du risque, il est toujours difficile de prendre des décisions dans une situation de crise. En effet, une catastrophe est source de stress et d'anxiété pour les décideurs, dont les jugements peuvent être affectés.
La France et l’Europe ne sont pas à l’abri de ces éléments et des autres colères de la nature. Ils sont soumis à tous les événements redoutés existantes sur la planète. Témoin en est la vague de chaleur qui a sévi en été 2003. Cette chaleur a fait 35 000 morts sur le continent européen. En France, l'ensemble des dossiers départementaux des risques majeurs établis par les préfets permet de dresser un panorama de la répartition des risques naturels sur le territoire national. Aujourd'hui, avec des gravités très variables, 23500 communes sont exposées à un ou plusieurs risques naturels : cyclones et tempêtes, inondations sous ses différentes formes (de plaine, torrentielle, par remontées des nappes ou submersion), avalanches, mouvements de
6
terrain (glissement, chute de blocs, cavités souterraines et marnières, retrait-gonflement des argiles), tremblements de terre, éruptions volcaniques, feux de forêt. Compte tenu de cette diversité des catastrophes, de leurs amplitudes et de leurs fréquences, il est intéressant d'étudier les conséquences indirectes. En particulier celles induites par une défaillance réseau.
Ce sont ces raisons, qui nous ont motivé à poursuivre ces années de recherche sur l'analyse de la vulnérabilité des réseaux d’infrastructure.
Objectifs et délimitations
Cette thèse se concentre sur l’impact indirect des catastrophes naturelles sur les enjeux à travers les réseaux d’infrastructure. Les enjeux peuvent être la population ou une infrastructure vitale au fonctionnement de la société. Elle suppose que des personnes encore vivantes après l’occurrence ou le passage de la catastrophe naturelle meurent pour des raisons liées à l’incapacité des secours à intervenir dans des délais raisonnables - sur des zones touchées ou à mettre en œuvre des actions sanitaires efficaces. De telles situations sont fréquentes après un tremblement de terre. Celui d’Haïti est malheureusement là pour nous le rappeler. Une catastrophe est par définition une épreuve qui perturbe la société et laisse l'individu seul face à la crise pendant une période de temps plus ou moins longue. En temps de crise, les décideurs doivent faire face à des multiples situations : stress, perturbation des services publics, situation d'isolement, etc.
La majorité des conséquences différées sont en lien avec une perturbation des réseaux d’infrastructure. On entend par réseau un ensemble d’entités interconnectées facilitant la circulation de biens (nourriture, médicaments, vêtements, couvertures), matériels (outils, machines de déblaiement, infrastructures sanitaires), services (soins, électricité) ou informations (téléphone, internet). Cette thèse traite de la vulnérabilité des réseaux aux catastrophes naturelles comme point d’entrée d’une problématique qui peut accélérer ou augmenter par contrecoup les dommages causés à la population suite à une absence de décision ou une prise de décision inappropriée.
La prise en compte de chaque réseau séparément apporte des informations intéressantes mais non suffisantes pour prendre la bonne décision en toute connaissance de causes et de conséquences. Les dimensions organisationnelle et décisionnelle nécessaires à la mise en évidence de solutions préventives ou correctives pour affronter les catastrophes naturelles impliquent de travailler selon des modes collaboratifs. Ces modes de fonctionnement requièrent des outils adéquats, adaptés aux contextes et aux profils des utilisateurs potentiels. Ces outils d’aide à la décision doivent être développés sur la base de modèles multi-acteurs (experts, décideurs, usagers), multi-vues (avant, pendant, après la catastrophe) et multi-échelles (contexte local ou global).
Les techniques de sûreté de fonctionnement (Fiabilité, Maintenabilité, Disponibilité, Sécurité) et de gestion des risques (évaluation, prévention, atténuation, risk mapping) utilisées dans les domaines industriel et financier permettront d’établir un modèle de vulnérabilité. Les informations extraites de cette modélisation constituent des données d’entrée pour la prise de décision. Elles peuvent être utilisées dans le cadre de la
7
gestion des événements catastrophiques et prendre en compte les opinions de plusieurs acteurs (décideurs publics, experts, opérationnels) lors des prises de décision :
Pré-événements : Organisation et implantation des services opérationnels de secours, évaluation de l’impact d’une innovation technologique sur les conséquences éventuelles, estimation de la probabilité d’occurrence d’un événement particulier ;
Pendant l’événement : Évaluation des risques de répétition du phénomène, estimation du niveau des dommages en fonction de l’intensité et des premiers témoignages, estimation des moyens de secours à mettre en œuvre ;
Post-événement : Estimation des primes d’assurances par les professionnels d’assurance, évaluations des programmes de soutien des populations concernées, établissement des plans de redressement.
Cette thèse comprend toutes ces phases. Ses objectifs sont de surmonter ces problèmes par :
La modélisation des infrastructures critiques interdépendantes ;
La détermination de la vulnérabilité d’un réseau, d’un composant, d’un territoire et d’un enjeu ; La modélisation et l’évaluation des répercussions de l'interdépendance sur la vulnérabilité ; La corrélation entre l'intensité d'un événement redouté et les dommages aux enjeux ; L’identification les pires scénarios ;
La détermination d’un processus de décision pour la gestion de crise ;
La caractérisation d'un système d’aide à la décision pour la gestion des catastrophes.
Processus de recherche
Pour décrire et tenter d’apporter des solutions à la problématique décrite, notre recherche s’appuiera sur deux laboratoires du PRES (Pôle de Recherche et d'Enseignement Supérieur) de Toulouse scientifiquement complémentaires : Le Laboratoire Génie de Production (LGP), spécialisé en génie industriel et l’Institut de Recherche en Informatique de Toulouse (IRIT) - spécialisé en informatique. Le plan de la thèse est alors reparti en deux volets différents sur le plan scientifique, mais avec un objectif commun :
Volet 1 : Analyse de vulnérabilité des réseaux
Cette partie a été réalisée dans l'équipe Systèmes Décisionnels et Cognitifs (SDC) du Laboratoire Génie de Production. Ce laboratoire fait partie de l'École Nationale d'Ingénieurs de Tarbes. Nous avons travaillé sur les problématiques d'évaluation de la vulnérabilité des réseaux d'infrastructures dans un contexte les catastrophes naturelles.
8
Verrous Scientifiques : Représentation d'un système sociotechnique, corrélation entre l'intensité de l'événement redouté et les dommages causés au système, Modélisation de la vulnérabilité et des interdépendances.
Livrable : Modèle socio-technique pour l'évaluation de la vulnérabilité.
Après cette partie, nous avons fait un séjour de quatre mois à l'Université de Plymouth au Royaume-Uni. L'objectif était de consolider la collaboration avec la « School of Management » et d'échanger nos points de vue sur la prise de décision en environnement incertain.
Volet 2 : Aide à la décision en situation de crise
Cette partie a été réalisée dans l'équipe Systèmes Multi-Agents Coopératifs (SMAC) à l’Institut de Recherche en Informatique de Toulouse. Nous avons travaillé sur l'élaboration d'un processus d’aide à la décision et d’un système d’aide à la décision en situation de crise.
Verrous scientifiques : Identification du passage d’une situation nominale à une situation de crise, négociation et prise de décisions dans un environnement incertain.
Livrable : Un processus de décision mis en œuvre dans un système de d’aide à la décision basée sur le modèle développé dans le volet 1.
Le modèle de vulnérabilité développé dans la partie 1 doit être justifié selon les informations descriptives de la situation actuelle. Les résultats de la simulation réalisée par le biais du modèle de vulnérabilité constitueront des entrées pour le système d’aide à la décision mis en œuvre dans le volet 2.
9
CHAPTER I
LITERATURE
REVIEW
Résumé en Français
Ce chapitre traite de l’état de l’art dans de domaine de l’analyse de la vulnérabilité des réseaux d’infrastructure. Elle est divisée en deux parties : La première partie se focalise sur le concept de vulnérabilité et des modèles structurels associés. Une modélisation par la théorie des graphes étant préconisée, les différentes catégories de graphes sont présentées. Par la suite nous identifions les métriques de la vulnérabilité : Centralité, Intégrité, Connectivité, ainsi que d’autres fonctions.
La deuxième partie aborde les processus d’aide à la décision. Nous groupons l’ensemble des processus existants en trois catégories : Les processus linéaires, les processus cycliques et les processus hybrides. Les méthodes d’agrégation multicritère sont également catégorisées. Pour chaque méthode présentée, l’applicabilité à l’analyse de la vulnérabilité des réseaux est investie. Un accent est mis sur les méthodes de type ELECTRE. Pour cette dernière catégorie, le groupement est effectué en fonction des problématiques de base.
10
“There is nothing so strange and so unbelievable that it has not been said by one philosopher or another” Descartes
Literature review
11
INTRODUCTION
In the science of vulnerability analysis as in many others, words such as risk, system are polysemic and interpreted in different ways. The objective of this state of the art is to present studies related to the field of the vulnerability analysis. It is divided into two parts: the first is about the concept of vulnerability and associated structural models. Since the modelling is based on the graph theory, different categories of graphs will be presented. Following on, the existing vulnerability metrics: centrality, integrity, connectivity, as well as other vulnerability functions will be introduced. The second part deals with the decision aiding process. We classified existing processes into three categories: linear processes, cyclic processes and hybrid processes. Multicriteria aggregation methods are also categorized. For each presented method, the applicability to the network vulnerability analysis is investigated. A focus is done on the ELECTRE methods. For this latter category, the grouping categories are performed based on basic problems. The results of this part allowed us to propose a vulnerability model overcoming literature shortcomings. We begin by the infrastructure network management literature review presented in the next section.
I.1:
INFRASTRUCTURE NETWORK MANAGEMENT LITERATURE REVIEW
Feared event and type of
approach
Vulnerable elements (vulnerability type)
Seismicity Population Institutional Building Structural Network Economic
activity Urban System
Social Corporal Structural Functional
Damage observation Colbeau-Justin & de Vanssay, 1996 - Leone & Mavoungo, 2000 Mahue-Giangreco et al., 2001 Colbeau-Justin & de Vanssay, 1996 ATC-20 - AFPS Hassani &Takada, 1995 Chang, 1996 Mazzocchi & Montini, 2002 Menoni, 2001 Vulnerability diagnostic Mavoungo, 2006 ? ? HAZUS - ATC-88 - Gémitis Durville & Meneroud, 1987 ? Gémitis-Nice Gémitis-Nice (Lutoff, 2000)
Graph theory 12 Coburn et al., 1992 ATC-85 - Gémitis ATC-91 Volcano Damage observation de Vanssay & ColbeauJusti n, 2000 Baxter et al., 1997 Leone & Gaillard, 1999 - Voight, 1990 Spence et al., 1996 ? D'Ercole & Metzger, 2000 Gaillard, 2001 D'Ercole & Metzger, 2000 Vulnerability diagnostic D'Ercole, 1991- Dibben & Chester, 1999 ? Lesales, 2005 Pomonis et al., 1999 ? ? ? D'Ercole & Metzger, 2004
Scenario ? Baxter et al.,
1998 ? Leone, 2004 - Pomonis et al., 1999 Stieltjes & Mirgon, 1998 ? ? Gomez-Fernandez, 2000 Land slide Damage observation Leone, 1996 ? ? Alexander, 1988 - Leone, 1996 Leone, 1996 Leone, 1996 Leone, 1996 ? Vulnerability
diagnostic Cospar ? Cospar ? ? ? ? Finlay, 1996
Scenario ? Finlay, 1996 - Leone, 1996 ? Hulbergern & Carree, 1987 - Leone, 1996 Leone, 1996- Panizza et al, 2002 Leone, 1996 Mora, 1992 Mora, 1992 Wind Damage observation Sarant et al. , 2003 ? Sarant et al., 2003 Hamparian , 1999 ? ? ? ? Vulnerability diagnostic Pagney & Suédois, 1999 ? Sarant et al., 2003 Bonfanti, 2004- HAZUS ? ? ? ?
Literature review
13
Table I-1 : Infrastructure vulnerability review by [1]
Infrastructure network management has been studied for many areas. [2] studied the vulnerability of roads. The financial aspect related to infrastructure network failure was investigated in [3]. [1] made a comprehensive literature review in this topic summarized in Table I-1. Blue cells stand for standardized and reproducible approaches, yellow cells for non-standardized but reproducible approaches and green cells for approaches under research. It shows that with regards to networks study, there is a lack of study concerning many feared events. Infrastructure network failure is an issue which has not been much investigated. There is a lack of research at the structural or functional level. The structural level is related to the infrastructure architecture, and the function one to how it accomplishes its functions through flow circulation.
Morrow, 2003 - HAZUS Morrow, 2003 - HAZUS Flood Damage observation ? Jonkman et al., 2002 ? Kelman & Spence (2004) ? ? Torterotot, 1993 NRC, 1999 Vulnerability diagnostic DEFRA/FHR C, 2003 DEFRA/FHR C, 2003 Green, 1988 Lagadec, 1995 ? ? ? Ledoux & Sageris, 1999 Barbut et al., 2004 Hardy, 2003 Reghezza, 200
Scenario ? Ruin & Lutoff, 2004 Gilbert & Bourdeaux, 1999 Lagadec, 1995 HAZUS ? ? HAZUS
Liu Renyi & Liu Nan (2002) Islam (1997) Légende : 1- Disponibilité opérationnelle (approche standardisée et reproductible
Graph theory
14
The review performed in this thesis and presented in next section is divided into two parts. The first one focusses on the network modelling through the graph theory. The second introduces some vulnerability metrics.
I.1.1 GRAPH THEORY
The first step of network vulnerability analysis is modelling. In the modelling step, graph theory is mostly used. The foundations of the graph theory were built by Leonhard Euler (1707-83) when he presented the solution Königsberg bridges [4]. Since then, the theory has evolved considerably. Nowadays, it is applied to many disciplines like organic chemistry modelling [5], mechanical system reliability analysis [6], representation of engineering systems [7] etc.
A finite graph is defined by a finite set of nodes ; and a finite set of edge ; (|E|=M).
In the field of infrastructure network modelling, graph theory is mainly used in the literature. When infrastructure networks are related to graph, many classifications are then possible. One of them separate infrastructure networks into social network (Facebook, Linkedin), information network (World Wide Web, or knowledge network), biological network (food networks) and technological network (power grids).
Another classification is based on the network structure. From this point of view, networks can be classified according to their degree distribution [8]. This classification gives rise to three categories of network [9] : scale-free network, random graphs, and small word network. These categories are presented in the next three sections.
Scale-free Network
For many real networks the degree distribution follows a power law [10], [9], [8]. This kind of network is named Scale-free Network. But only their degree distribution is scale-free. For Scale-free Network, the node fraction with a degree follows a power law:
(I-1)
is the power law exponent, k is the degree.
This is the case of networks like the power grids [10], the World Wide Web, the internet, and the air transportation networks [11].
In the literature the degree of distribution could also be exponentials, such as those seen in the power grid, railway networks, and power laws with exponential cutoffs, such as those seen in the network of movie actors and some collaboration networks [12].
Literature review
15
Random graph
Random graph are also known as Erdös-Rényi graph. In general, in this model of graph, the probability that a node is of degree is given by the binomial law [8], [9]:
( ) (I-2)
N is the number of node. The average distance for these networks is proportional to [9].
Social networks belong to this category of network.
Small word network
This model was proposed by Watts and Strogatz. The distance between two nodes in small word network decreases very slowly with the number of nodes [13]. It reflects the fact that although the number of vertices in the graph is high, the average distance is relatively short. These networks combine a high degree of agglomeration and a low average distance [9].
Neural networks belong to this type of networks.
Structural characteristics resulting from each of these types are interesting and well analysed in the literature. From above definitions, it appears that infrastructure networks seem to belong to the category of scale-free network.
Once networks are modelled by graphs, there are many models of vulnerability that can be applied. These models are presented in the next section.
I.1.2 VULNERABILITY METRICS
The concept of vulnerability is used in several disciplines: psychology, sociology, political science, economic, epidemiology, biology, environmental and geoscience [14]. Many terms are related to vulnerability concept in the literature: service-ability, reliability, availability, survivability. With respect to infrastructures, vulnerability analysis aims are pointed out by [14]. The author argues that it consists in answering the following questions:
What can fail?
What are the consequences? How can this happen?
Vulnerability metrics
16
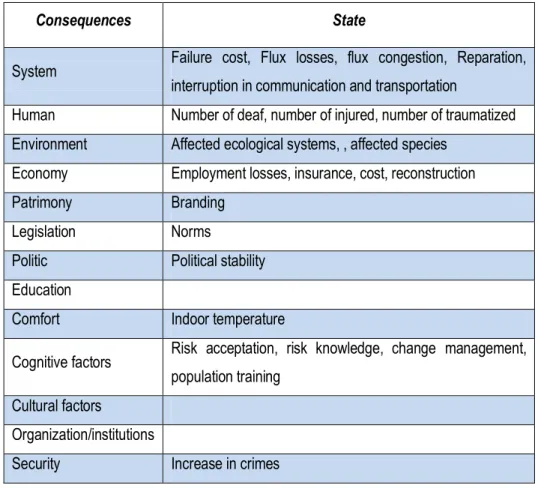
To answer the first question, we must focus on network components. Indeed, the resulting vulnerability is strongly linked to that of the components. The second question is more difficult to answer. The range of consequences is large and may take various forms. The third question refers to the feared events. With respect to the listed questions, the implementation of corrective actions is required to solve the problem. The issues pointed out by [14] allow the Decision Maker understanding the context, but they do not take into account one of the aspects of the analysis: what can aggravate or mitigate the consequences? The answer to this question is given in II.2.3.3.
These questions show that vulnerability emphasizes the degree in which people and their possessions are exposed to feared events. It indicates the level of damages which a certain phenomenon may produce and it is expressed on a scale varying from 0 to 1, 1 standing for the total destruction of material assets and loss of human lives in the affected area [15].
Vulnerability is defined in several ways in the literature. Table I-2 resumes some of them.
Definitions Author
Probability of a complete or partial failure of infrastructures and loss of their ability to
maintain their important functions for a certain period [16]
Propensity to damage or malfunction of various elements exposed to risk (commodities, peoples, activities, functions, systems) constituent a territory and a given society [1] System time progressive property to support failure in function of its state [17] How a system, organization, or human performance is degraded if some hazard or threat
exploits the vulnerability [18]
Ability of the system to withstand hazard or threat [19]
System overall susceptibility to lose due to a negative event, ie the magnitude of the
damage given a specific strain [19]
Susceptibility of rare, thought big, risks, while the victims can hardly change the course of
events and contribute little or nothing to recover [20]
Susceptibility to incidents that can result in considerable reductions in road network service-ability. These incidents may then be more or less predictable, caused voluntary or involuntary, by man or nature
[21]
Manifestation of the inherent states of the system (e.g., physical, technical, organizational, cultural) that can be exploited to adversely affect (cause harm or damage to) that system [18] Characteristic of a critical infrastructure’s design, implementation, or operation of that renders it susceptible to destruction or incapacitation by a threat [22] Vulnerability refers to how a system, an organization or human performance is degraded if some hazards or threats exploits the vulnerability
(Haimes 2006) in [19]
Literature review
17
Table I-2: Vulnerability definitions
Defintions given in Table I-2 highlight two viewpoints:
System-based view: focuses on how the considered system will fail or change from one state to another. This view is shared by [24], [17] and [18].
Event-based view: considers the amplitude and/or the frequency of one or more events. This view is shared by [16], [1] and [19].
These two points of views are complementary. The vulnerability perception of a system remains dependent on considered states, and analysts’ views.
For instance, the state of the system could be related to its performance [18] quoted by [19], to its reliability or to any others criteria.
In the literature, survivability is used as an antonym of vulnerability. Survivability is generally used when talking about a disaster when it has already occurred while vulnerability concern the characteristics of an asset to resist to the feared event before its occurrence [25]. The survivability is defined as the capability of a system to fulfil its mission in a timely manner in the presence of attacks, failures, or accidents [18] and concerns the system's performance after the occurrence of a feared event while vulnerability is the susceptibility of system facing feared events [26].
From definitions in Table I-2 we pointed out many attributes associated with vulnerability: magnitude
Flaw or weakness in the design, implementation, operation and/or management of an infrastructure system, or its elements that render it susceptible to destruction or incapacitation when exposed to a hazard or threat or reduces its capacity to resume new stable conditions
(Kröger et Nan) in [23]
Susceptibility (sensitivity) to threats and hazards that substantially will reduce the ability of
the system to maintain its intended function [14]
Collection of properties of an infrastructure system that might weaken or limit its ability to maintain its intended function, or provide its intended services, when exposed to threats and hazards that originate both within and outside of the boundaries of the system
Holmgren and Molin (2005) in [14]
Degree of loss or damage to the system when exposed to a perturbation of a given type and
magnitude [24]
The probability of damage to all or part of an infrastructure and the loss of its ability to
Vulnerability metrics
18 Vulnerability is time dependent;
A vulnerable system assumes the existence of a feared event;
Vulnerability is related to the system incapacity to play the role it has been designed for
In our view, vulnerability is necessarily associated with the system it characterizes. For this reason the following definition is provided.
Definition I-1: Vulnerability is the incapacity of a stake to resist to the occurrence of a feared event and to recover efficiently its nominal function during a given period of time.
The concepts of stake and feared event will be introduced in II.1.2.2.
As further shown below, many vulnerability metrics in the literature are based on the network structure. In fact, some authors consider that the effectiveness of network functions realization is affected by its structure [27]. In [28] the authors argue that at the occurrence of a feared event, loss and damage depend on the structural organization and vary from one network to another. Then, analysing the topology of the network allows a better comprehension of the dynamic phenomena that affects its performances [29], the identification of its weaknesses [30] and the estimation of its vulnerability [29], [31].
Network parameters for vulnerability analysis include the degree, the clustering coefficient, the average distance, and the load [29]. Besides these parameters, one can observe four other classes namely: efficiency, integrity, probability and others vulnerability functions. Whatever the function used, the vulnerability might not increase with the addition of edge [29] and its analysis should help to measure the system’s response after a feared event occurrence [28]. These parameters are presented in the following sections.
Betweenness centrality
The betweenness centrality stands for the fraction of path going through a node [32] quoted by [33].
∑
(I-3)
where is the number of geodesics (paths) between and , and is the number of geodesics between and that passes . The load is defined in the same way for an edge [33].
∑
(I-4)
Where is the number of geodesics between and , that includes the edge . The centrality determines the importance of a node in a network [33].
Literature review
19
For vulnerability estimation, the centrality of one component is calculated before and after the occurrence of the feared event (which means the removal of one or many nodes/edges) [11], [34], [35]. The centrality is a good indicator of the structural importance of a node or an edge in the graph. But from our view, it does not adjudicate on the vulnerability. Indeed, the vulnerability is induced by several failure modes. These modes result from component constitution, but also because of the overall dynamics.
Average Path Length
The average path length between two nodes is the mean of the edges number of shortest paths [9].
∑ ( ) (I-5)
To avoid infinite mean (the distance is infinite if no link exists between the nodes), the inverse of the average path [34] and [33] is commonly used.
∑ ∑ ( ) (I-6)
The average path measures the dispersion of the network and expresses the difficulty of communication between two nodes [36]. It also indicates the flow of traffic on the network. In our view, the average path length is a good indicator of structural vulnerability. The smaller is the parameter, the less vulnerable will be the global network.
is described in [11], [36], [37] and [38] as the efficiency and related to the network performance. The efficiency of a path between two vertices is the average efficiency of all the edges constituting the path. Resilience, which is one of the measures of vulnerability, is the drop of efficiency induced by the deterioration of edges [36], [35]. We will define this concept later in II.1.8. Vulnerability is then seen as the lack of network performance and is defined by.
(I-7)
Where is the overall efficiency of the system and is the efficiency of the network after removal of the edge . The overall vulnerability of the graph is then defined by:
[ ] (I-8)
Finally, some authors consider the loss of performance caused by the removal of a node instead of an edge [39] , [28]. The vulnerability of the graph and its nodes are assessed in the same way. This way of estimating the vulnerability is very interesting. Interest focuses on the structure but not on the real circulation of flows in the network. Furthermore this approach does not take into account the intrinsic reliability of each component.
Vulnerability metrics
20
Clustering coefficient
Let us consider three nodes , et . If the node is linked to the node , and the node to the node , the transitivity is the average probability that the node is linked to the node . It measures the density of triangles in the network [9]. The number of possible connections for a node of degree is [9]:
( ) [ ] (I-9)
By noting the number of links between vertices incident to node , the clustering coefficient of node is then [9]:
( ) (I-10)
The clustering coefficient of a graph will be then [9] , [33]:
∑ (I-11)
The clustering coefficient is a good indicator of network vulnerability. However, it does not give any idea on the vulnerability of a component. Indeed, the more, there will be of a triangle in the network, the less it will be vulnerable.
Connectivity
Node connectivity is called cohesion, and edge connectivity is called adhesion. The node connectivity (respectively edge) of a graph is the minimum number of nodes (respectively edges) to be removed from the graph to disconnect it [40], [29]. A disconnected graph is a graph for which some flow cannot reach its destination. Connectivity is a vulnerability measure [9]. The higher the connectivity the less vulnerable will be the network.
Integrity
Integrity is the ratio . Where is the size of the graph after damage of a fraction i of nodes compared with the initial size . Vulnerability can be seen as a lack of integrity [13], [41], [41] and [42]. Other authors define integrity in relation to the weight, the geodesic distance and the range (ratio between the distance and weight) [37]. The integrity is related to the graph robustness. It does not give any indication on the graph, node or edge resilience.
Literature review
21
Probability
The vulnerability of a system is measured in [9] and [14] as the probability for a given period of time that the negative consequence of the disturbance is greater than a value . Taking into account the occurrence of a feared event , the total probability would be the sum of probabilities.
∑ ( ) (I-12)
Where is the initiating event. The main concern with these functions is the correlation between consequences and feared events. The range of consequences is large. An estimation on the basis of the expertise is certainly interesting but insufficient for an objective assessment of the vulnerability.
Vulnerability function
Several authors suggest vulnerability functions in the literature. In [27] the authors define a vulnerability function for a graph with N nodes and M edges by:
( ) (I-13)
Where is the standard deviation of the degree distribution. This function does not take into account the vulnerability indicators such as cohesion (vertices degree) and adhesion (edges degree) [29], [40]. Moreover, the term does not allow the comparison between networks of different sizes and structures [29].
In this part, we have introduced the concept of vulnerability and approaches to estimate it. The majority of scientific approaches ignore the flow dynamics. We overcome these gaps with a simulation-based approach. We will thus introduce in II.1.8 some essential elements for the vulnerability estimation: flow, feared event, aggravation and mitigation factor etc.
Vulnerability assessment is often a prerequisite to decision-making. We thus present in the following a review of decision-making process in the field of the infrastructure networks vulnerability analysis.
I.2:
DECISION AIDING LITERATURE REVIEW
Decision theory aims to justify, analyse and streamline actions susceptible to have negative consequences [43]. Historically, decision theory comes from the hazard formalization on board games. Later, in the period just before the World War II, decision aiding knows a major development. It exists studies conducted by the British Army as part of the installation of radar systems and German communications decoding efforts (1936-37) [44]. The boost of the discipline will come with the success of operational research, linear programing and the game theory. Later in 1948, the development of project such as RAND [45] will give a new impulse to the discipline. Many theories will emerge to make the discipline increasingly relevant.
![Figure III-21 represents the architecture proposed by [121]. Database is endowed with data analysis capability performed by a data base management system (DBMS)](https://thumb-eu.123doks.com/thumbv2/123doknet/3535470.103520/146.892.190.776.598.1021/represents-architecture-proposed-database-analysis-capability-performed-management.webp)