14564
Journal of Applied Biosciences 142: 14529 - 14539
ISSN 1997-5902
Effective use of statistical tools in agricultural
sciences: a critical review of multivariate modelling
methods
Sewanou Hermann Honfo1*, Ariane Houetohossou1, Achille Assogbadjo2, Romain Glèlè Kakaï1
1 Laboratoire de Biomathématiques et d’Estimations Forestières, Faculty of Agronomic Sciences, University of Abomey-Calavi Campus (LABEF/FSA/UAC), Building CBIG (2nd floor), Abomey-Calavi, O4 BP 1525 Cotonou, Benin.
2 Laboratory of Applied Ecology, Faculty of Agronomic Sciences, University of Abomey-Calavi, Campus, Building Barthelemy KASSA, Abomey-Calavi, 01 BP 526 Cotonou, Benin
Corresponding author: E-mail: [email protected]
Original submitted in on 24th July 2019. Published online at www.m.elewa.org/journals/ on 31st October 2019
https://dx.doi.org/10.4314/jab.v142i1.10
ABSTRACT
Objectives: A critical review was conducted to assess effective use of multivariate modelling methods for data analysis in agricultural sciences and related fields.
Methodology and Results: Four main agricultural fields were considered: biology; agronomy; ecology; and food nutrition. Two journals were randomly selected per agricultural field and up to 250 articles were downloaded considering a ten-year period (2008-2017) per journal. From papers, information such as: statistical methods used; and whether multivariate modelling methods were required and used for data analysis or not, was recorded. Basic statistical methods: descriptive statistics, univariate parametric tests and related tests (post-hoc tests, normality test, and homoscedasticity tests) were the most frequently used. Advanced statistical methods such as multivariate descriptive and modelling methods, Bayesian methods, recorded the least use values. Multivariate modelling methods were rarely used though they were sometimes required according to agricultural fields. The highest and lowest effective uses of statistical methods were recorded for the agronomy and biology fields, respectively.
Conclusion and application of findings: There is a gap between the development of advanced statistical methods, their usefulness and accessibility to analyse data in applied sciences especially agricultural sciences. Further investigations in statistical methods’ development may integrate and justify their usefulness in applied sciences. Collaborations between applied scientists and statisticians are necessary for better analysis of research data.
Keywords: multivariate modelling techniques, effective use, agronomy, critical analysis, statistical methods INTRODUCTION
During centuries agriculture remains a relevant source for ensuring food security (Gebbers and Adamchuk 2010), which is an important worldwide challenge especially in developing countries (IFPRI
2015; Chadare et al. 2018). Agricultural research field enables science to be more applicable in the real life, by allowing scientific discoveries going beyond the improvement of human knowledge
14565
(conversion of fundamental sciences’ results to new technologies, new social processes, new materials and medical treatments). Applied sciences use statistics to make decision regarding various objectives. In agricultural and biological research, statistical techniques are used for efficient planning of experiments and for interpreting experimental data (Bayo 2014) More, for either studying the needs and future prospects of their products, or studying various phenomena such as wages, price analysis, analysis of time series, demand analysis (in economy), or assessing the quality control of an industrial product, statistical techniques are often used (Lind et al. 2012). Agricultural sciences often consider experimental studies to respond to various phenomena. A phenomenon of interest in agricultural sciences is often characterized by multiple variables that are essential to be measured on each individual considered in a given study. The development of statistical methods to model multiple variables has been an area of active research for many decades (Sammel et al. 1999). As a result, several multivariate modelling methods (MMM) such as multivariate linear mixed effects models (MLMM) have been developed.
Indeed, during the past decades, MLMM raise an increasing interest for scientists because of their appropriateness to analyse multivariate longitudinal data, which are most frequent in experiment studies (Schafer and Yucel 2002; Wang and Fan 2010; Bandyopadhyay et al. 2011; Yücel 2015; Adjakossa et al. 2016). These methods often faced various issues such as computational complexity due to the dimension of the covariance matrix of the random effects (Fieuws and Verbeke 2006) as well as the number of subjects per random effect. In general, various methods are still in development to improve the reliability of statistical outputs or to extend an existing method to a more general context. This is the case of MLMM (Reinsel 1982), which is an extension of linear mixed effects models (Laird and Ware 1982) to model phenomena characterized by likely correlated multiple variables of interest. This study focuses on MMM and checks whether they are really used for data analysis in agricultural sciences’ researches. Thus, it aims to assess the effective usefulness of statistical methods especially MMM to analyse agricultural data.
METHODS
Bibliographical review: Four main field categories were considered: agronomy; biology; ecology; and food nutrition. For each field category, two scientific journals were randomly selected from the list of journals proposed by OMICS International (Table 1) available on https://www.omicsonline.org/. Relevant keywords, which provided a likely chance to find articles that at least used a statistical method for data analysis, were identified through an explanatory study. This explanatory study consisted in selecting randomly 10 (open or free access) papers per considered journal for a total of 80 papers. From every single paper, we recorded key words in its abstract and we checked whether at least one statistical tool was used or not. We then identified key words related to papers that used at least one statistical method. These keywords were ranked according to their relative frequency of appearance. We finally came up with a short list of 6 keywords: assessment, modelling, effect, simulation, estimation, evaluation. A systematic review was
conducted considering a ten-year period from 2008 to 2017 inclusive. For each target journal, 25 (if possible) original papers were randomly selected and downloaded per year using the identified keywords. In total 1626 papers were downloaded as sometimes we did not reach 25 papers per year target. From each downloaded paper, we recorded the title, authors’ names, year, all statistical methods used, whether MMM were required to analyse data regarding the methodology and the study’s objectives or not, and whether MMM were used or not. The need to use MMM in a paper was evaluated as follows: (1) identification of the study’s objectives (abstract and introduction sections); (2) identification of data collected for each objective; (3) identification of data analysis methods used (Methodology and results sections); and (4) comparison of MMM application’s conditions with the characteristics of data collected and the study’s objectives. Some papers clearly showed significant correlations between variables of interest that were
14566 modelled in different separate models. For other papers, it was necessary to document the collected data and the possible links that may exist between variables and methods finally used. Essentially, the papers were stripped back and forth before making a decision (yes or no) about the need to use MMM or not. As their number was important, statistical methods were grouped in some categories of methods to make easier data analysis.
Data analysis: Relative frequency and curve graphs were used to describe the global importance of various statistical methods to analyse data in agricultural sciences and particularly the effective use of MMM. A logistic regression was performed to assess effects of period and agricultural field category on the need of using MMM in data analysis. The packages ggplot2 (Wickham 2009) and stats (R Core Team 2018) under the version R 3.5.0, were used to establish plots and to perform the logistic regression, respectively.
RESULTS
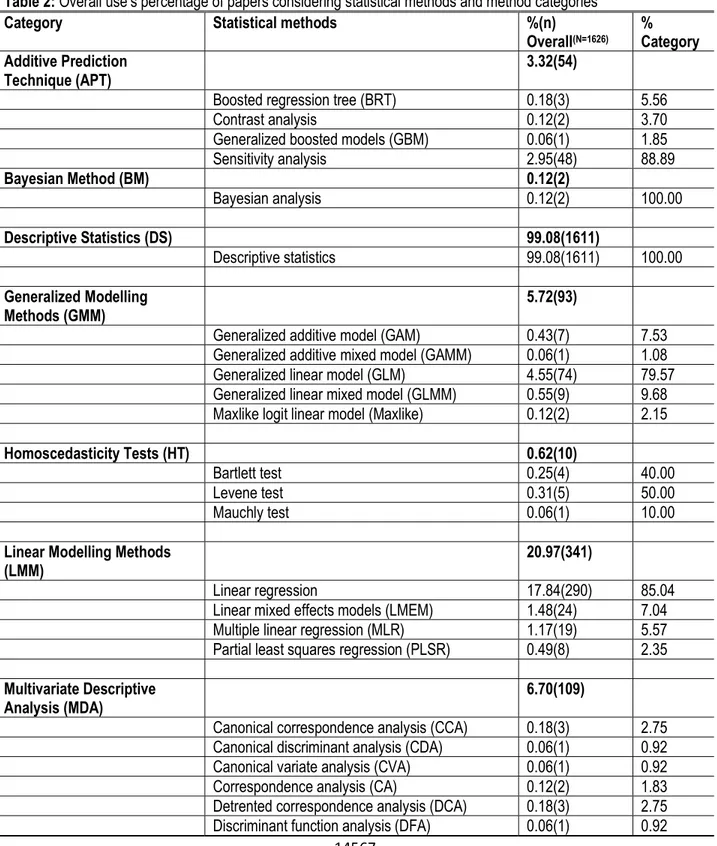
Statistical methods used in agricultural sciences for data analysis: Up to 64 statistical techniques were identified and grouped in 16 method categories. Multivariate descriptive methods (MDA) constituted the most diversified category with 15 statistical methods recorded. Descriptive statistics (mean, variance, range,
sum, quartiles, skewness, kurtosis, histogram, box, curve and bar plots) were the category of methods mostly used to analyse data in agricultural sciences. Indeed, in 1611 out of 1626 (99 %) papers downloaded, descriptive statistics were considered (Table 2).
Table 1. List of journals according to field categories
Field category Journals
Biology Ecosystems services
Journal of Agriculture and Food Chemistry
Agronomy Agriculture Ecosystems and Environments
Field Crop Research
Ecology Method in Ecology and Evolution
Environmental Modelling and Software
Food Nutrition Food Control
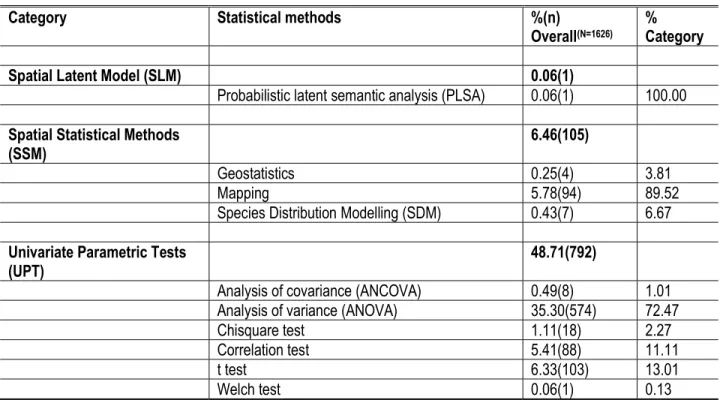
Food Research International The category of univariate parametric tests (UPT) was
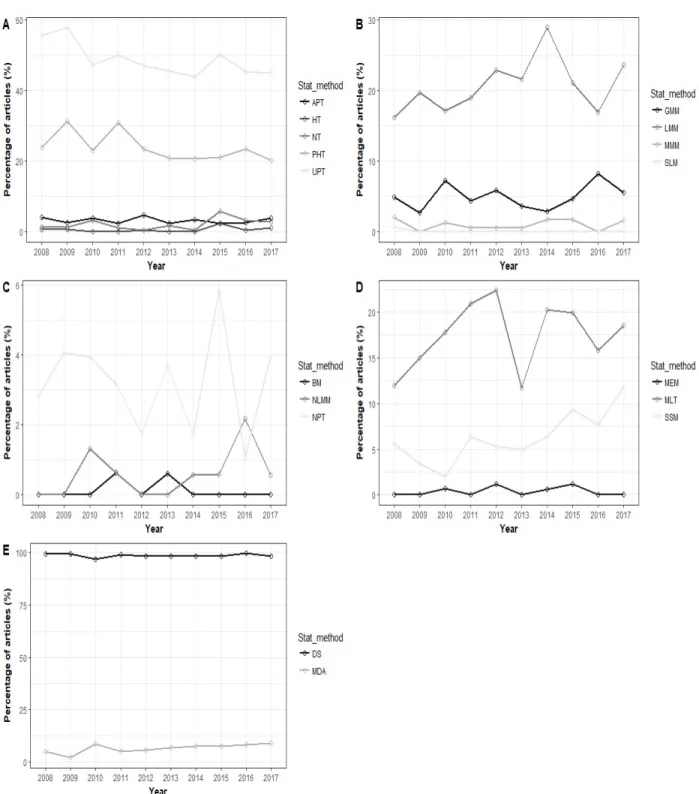
used in 49 % of papers among which 72.47 % was dedicated to univariate analysis of variance (ANOVA) (Table 2). Post-hoc tests (PHT) (24 %), linear modelling methods (LMM) (21 %), and machine learning techniques (MLT) (18 %) were also well used in data analysis. Only 1.23 % of papers considered used multivariate modelling methods (MMM) in particular MLMEM that recorded 0 % of use over the 1626 papers. Despite their high diversity, MDA recorded only 6.70 % of use with principal component analysis (PCA) being the most represented with almost 59 % of the 109 papers that used MDA (Table 2). Statistical latent modelling (SLM) and Bayesian methods (BM) were the least used with an overall importance of 0.06 % and 0.12 %, respectively. According to a general overview, the effective uses of UPT and PHT have decreased from 2008 to 2017 (Figure 1A) while the ones of spatial statistical methods (SSM), MDA and MLT have increased from 2010 to 2017 (Figures 1D and E). LMM
and generalized modelling methods (GMM) also showed an overall increasing usefulness during the last decade (Figure 1B). In addition, one can notice a variation of statistical techniques used according to agricultural science fields. Apart from the fact that DS, UPT and PHT (except for ecology) were useful for all fields, almost 50 % of papers that used LMM were from agronomy field (Table 3). Similar observation can be noticed for MLT that is well used for data analysis in papers published in agronomy and ecology fields representing 50 % and 38 % of papers that used MLT, respectively (Table 3).
Current need and effective use of MMM for data analysis in agricultural sciences: MMM included MLMM, MANOVA, PERMANOVA and RDA (Table 2). A cross tabulation between need and effective use of MMM, showed 19 effective uses over 75 overall needs (or possibilities of use). The need and effective use of MMM (Table 4) varied significantly according to agricultural fields considered. The difference was
14567 mainly observed between the agronomy field and the other considered fields in particular the field of food nutrition with an estimated marginal difference of 2.17 and 2.66 for need and effective use, respectively (Table 4 and Figure 2). From 2008 to 2017, the need and
effective use of MMM did not significantly varied (prob > 0.05, Table 4 and Figure 2 A). A real gap was observed between the need and the effective use of MMM to analyse data of agricultural science and related fields (Figure 2).
Table 2: Overall use’s percentage of papers considering statistical methods and method categories
Category Statistical methods %(n)
Overall(N=1626) % Category Additive Prediction
Technique (APT) 3.32(54)
Boosted regression tree (BRT) 0.18(3) 5.56
Contrast analysis 0.12(2) 3.70
Generalized boosted models (GBM) 0.06(1) 1.85
Sensitivity analysis 2.95(48) 88.89 Bayesian Method (BM) 0.12(2) Bayesian analysis 0.12(2) 100.00 Descriptive Statistics (DS) 99.08(1611) Descriptive statistics 99.08(1611) 100.00 Generalized Modelling Methods (GMM) 5.72(93)
Generalized additive model (GAM) 0.43(7) 7.53 Generalized additive mixed model (GAMM) 0.06(1) 1.08 Generalized linear model (GLM) 4.55(74) 79.57 Generalized linear mixed model (GLMM) 0.55(9) 9.68 Maxlike logit linear model (Maxlike) 0.12(2) 2.15
Homoscedasticity Tests (HT) 0.62(10)
Bartlett test 0.25(4) 40.00
Levene test 0.31(5) 50.00
Mauchly test 0.06(1) 10.00
Linear Modelling Methods
(LMM) 20.97(341)
Linear regression 17.84(290) 85.04
Linear mixed effects models (LMEM) 1.48(24) 7.04 Multiple linear regression (MLR) 1.17(19) 5.57 Partial least squares regression (PLSR) 0.49(8) 2.35 Multivariate Descriptive
Analysis (MDA) 6.70(109)
Canonical correspondence analysis (CCA) 0.18(3) 2.75 Canonical discriminant analysis (CDA) 0.06(1) 0.92 Canonical variate analysis (CVA) 0.06(1) 0.92
Correspondence analysis (CA) 0.12(2) 1.83
Detrented correspondence analysis (DCA) 0.18(3) 2.75 Discriminant function analysis (DFA) 0.06(1) 0.92
14568
Category Statistical methods %(n)
Overall(N=1626) % Category Fisher (linear) discrimant analysis (FlDA) 0.06(1) 0.92 Hierarchical clustering analysis (HCA) 0.55(9) 8.26 (Linear) discriminant analysis (lDA) 0.43(7) 6.42 Non-metric multidimensional scaling (NMDS) 0.55(9) 8.26 Orthogonal projections to latent structures
discrimant analysis (OPLSDA) 0.06(1) 0.92
Principal component analysis (PCA) 3.94(64) 58.72 Principal coordinate analysis (PCoA) 0.06(1) 0.92 Partial least squares discriminant analysis
(PLSDA) 0.31(5) 4.59
Variance component analysis (VCA) 0.06(1) 0.92 Maximum Entropy Modelling
(MEM) 0.37(6)
Maxent 0.37(6) 100.00
Machine Learning Technique
(MLT) 17.65(287) Decision tree 0.12(2) 0.70 Random forest (RF) 0.06(1) 0.35 Simulation 17.47(284) 98.95 Multivariate Modelling Methods (MMM) 1.23(20)
Multivariate ANOVA (MANOVA) 0.25(4) 20.00
Multivariate LMEM (MLMEM) 0.00(0) 0.00
Permutational PERMANOVA 0.18(3) 15.00
Redundancy analysis (RDA) 0.80(13) 65.00
Non Parametric Tests (NPT) 3.14(51)
Analysis of similarity (ANOSIM) 0.06(1) 1.96
Friedman test 0.06(1) 1.96
Kruskal Wallis 1.17(19) 37.25
Mann Whitney test 0.92(15) 29.41
Wilcoxon test 0.92(15) 29.41
Normality Tests (NT) 2.28(37)
Kolmogorov Smirov test (KST) 0.86(14) 37.84
Shapiro test 1.41(23) 62.16
Post-Hoc Tests (PHT) 23.92(389)
Bonferroni test 0.43(7) 1.80
Duncan’s multiple range test (DMRT) 5.04(82) 21.08
Dunnett test 0.49(8) 2.06
Least squares difference (LSD) 7.63(124) 31.88 Student Newman Keuls test (SNK) 1.05(17) 4.37
14569
Category Statistical methods %(n)
Overall(N=1626) % Category
Spatial Latent Model (SLM) 0.06(1)
Probabilistic latent semantic analysis (PLSA) 0.06(1) 100.00 Spatial Statistical Methods
(SSM) 6.46(105)
Geostatistics 0.25(4) 3.81
Mapping 5.78(94) 89.52
Species Distribution Modelling (SDM) 0.43(7) 6.67 Univariate Parametric Tests
(UPT) 48.71(792)
Analysis of covariance (ANCOVA) 0.49(8) 1.01 Analysis of variance (ANOVA) 35.30(574) 72.47
Chisquare test 1.11(18) 2.27
Correlation test 5.41(88) 11.11
t test 6.33(103) 13.01
Welch test 0.06(1) 0.13
Table 3. Effective use (percentage of papers) of various statistical methods for data analysis according to agricultural science fields considered
Category of
statistical methods Biology Agronomy Agricultural science fields Ecology Food Nutrition Overall
PT 0.06 1.41 1.23 0.62 3.32 BM 0.00 0.06 0.06 0.00 0.12 DS 18.27 30.14 20.85 29.83 99.08 GMM 0.62 2.09 1.97 1.05 5.72 HT 0.12 0.37 0.00 0.12 0.62 LMM 0.98 10.33 4.00 5.66 20.97 MLT 0.43 6.64 8.86 1.72 17.65 MEM 0.00 0.00 0.37 0.00 0.37 MDA 1.72 2.03 0.62 2.34 6.70 MMM 0.12 0.86 0.18 0.06 1.23 NPT 0.74 1.23 0.12 1.05 3.14 NT 0.18 1.41 0.00 0.68 2.28 PHT 6.89 8.18 0.06 8.79 23.92 SSM 1.17 1.91 3.38 0.00 6.46 SLM 0.06 0.00 0.00 0.00 0.06 UPT 12.42 18.08 1.72 16.48 48.71
14570
Table 4: Variation of MMM need for data analysis according to agricultural field category and time
Likelihood ratio test Tukey multiple pairwise test LR Chisq Pr(>Chisq) Estimate±SE z.ratio p.value
Need of MMM
Field category 106.48 < 2e-16***
Biology – Agronomy -2.39±0.47 -5.100 <0.0001***
Biology - Ecology -0.21±0.59 -0.364 0.984
Biology - Food Nutrition 0.13±0.59 0.217 0.996
Agronomy - Ecology 2.17±0.40 5.404 <0.0001***
Agronomy - Food Nutrition 2.52±0.40 6.279 <0.0001***
Ecology - Food Nutrition 0.34±0.54 0.636 0.921
Year 0.258 0.612
Effective use of MMM
Field category 16.77 <0.0008***
Biology – Agronomy -1.51±0.76 -1.986 0.193
Biology - Ecology -0.12±1.00 0.124 0.999
Biology - Food Nutrition 1.15±1.23 0.936 0.785
Agronomy - Ecology 1.63±0.76 2.151 0.137
Agronomy - Food Nutrition 2.66±1.04 2.565 < 0.047*
Ecology - Food Nutrition 1.02±1.23 0.835 0.838
14571
14572
Figure 2: Effective use of MMM according to agricultural field category and period DISCUSSION
Contrast between need and use of MMM in agricultural sciences: an overall gap between statistical method development and its current usefulness: The present study has investigated the effective need of MMM to analyse data in agricultural science and related fields namely, Biology, Agronomy, Ecology and Food Nutrition. With respect to the definition domain of our methodology, findings illustrate a gap between the need of MMM, which was important for agronomy regarding the other considered fields, and its effective rare use. MMM were more required in agronomy researches data analysis may be because of their methodology, which is mainly axed on field experimental designs. LMEM is a suit statistical technique to analyse experimental data (Laird and Ware 1982; Pinheiro and Bates 2011; Galecki and Burzykowski 2013; West et al. 2014). Though, in many situations, joint modelling of such data is required or
has additional advantages over the separate analyses of the different variables, Fieuws and Verbeke (2006) found that several applied researches used separate approaches. This fact can explain why despite the need, only few papers used MMM to analyse data. It can be also due to either the lack of statistical knowledge by applied scientists or the low collaboration between agricultural scientists and statisticians. Beyond MMM case, our findings help to notice that the gap is more general. There is a huge difference between the effective use of descriptive statistics and the one of multivariate descriptive statistics (Table 2), which is a technique whose goal is to describe multivariate data by simplifying such data and expressing what is going on a reduced set of dimensions (Rencher 2002). In addition, one can also notice the considerable difference between both effective uses of ANOVA and MANOVA (Table 2). MANOVA was supposed to help
14573 applied researchers considering more information (relationship between two or more variables of interest) while modelling. A common case observed in ecology is the separate modelling of height and size (diameter) of a given tree species with respect to some ecological factors, knowing that these measurements are likely correlated. This gap brings out some concerns : does statistical methods’ development go far from the real need of applied sciences (in particular agricultural sciences) since statistics are developed to improve applied sciences’ data analysis ? Does the sharing mechanism of information regarding statistics
development to applied sciences relevant? Do statisticians and applied scientists actually collaborate together for scientific studies? Is it always necessary to continue developing advanced methods that will not likely be used? These are some questions that we still discuss without clear solutions. Statistics and applied sciences efforts should be positively correlated as statistics are developed to analyse data, which are mainly provided by applied sciences. So in what extent statistical methods can fit more the needs of data analysis and be very useful for applied sciences in general and agricultural sciences in particular?
CONCLUSION
The present study critically reviewed the current use of statistical methods especially MMM to analyse data in agricultural sciences and related fields. It points out a frequent use of basic statistical methods such as descriptive statistics, univariate parametric tests and related tests (post-hoc tests, normality test, homoscedasticity tests). It also shows the least effective use of advanced statistical methods such as multivariate descriptive and modelling methods in particular MMM, whose effective use is rare though it
has been sometimes required. Our findings confirm the assumption that states the use of a knowledge increases as well as its accessibility increases. Further investigations in statistical methods’ development shall integrate and justify their usefulness for applied (especially agricultural) sciences. Important efforts have to be done to share statistical methods information to applied scientists through multi-disciplinary conferences, workshops and journals.
ACKNOWLEDGMENT
Authors acknowledge the Agropolis Foundation, Fondazione Cariplo and Foundation Daniel & Nina Carasso, for funding the project TREEFOOD nº 1507 - 143 in which this study was performed.
REFERENCES
Adjakossa EH, Sadissou I, Hounkonnou MN and Nuel G, 2016. Multivariate Longitudinal Analysis with Bivariate Correlation Test. PloS one, 11(8): e0159649.
Bandyopadhyay S, Ganguli B and Chatterjee A, 2011. A review of multivariate longitudinal data analysis. Statistical methods in medical research, 20(4): 299-330.
Bayo L, 2014. Applied Statistical Methods in Agriculture, Health and Life Sciences; Springer Cham Heidelberg New York Dordrecht London.
Chadare FJ, Fanou-Fogny N, Madode YE, Ayosso JOG, Honfo SH, Kayodé FPP, Linnemann AR and Hounhouiga DJ, 2018. Local agro-ecological condition-based food resources to promote infant food security: a case study from Benin. Food Security, 10(4): 1013-1031. Fieuws S and Verbeke G, 2006. Pairwise fitting of
mixed models for the joint modelling of
multivariate longitudinal profiles. Biometrics, 62(2): 424-431.
Galecki A and Burzykowski T, 2013. Linear mixed-effects models using R: A step-by-step approach; Springer Science & Business Media.
Gebbers R and Adamchuk VI, 2010. Precision agriculture and food security. Science, 327(5967): 828-831.
IFPRI, 2015. Global nutrition report 2014; DC: Washington.
Laird NM and Ware JH, 1982. Random-effects models for longitudinal data. Biometrics, 38(4): 963-974.
Lind DA, Marchal WG and Wathen SA, 2012. Statistical techniques in business & economics; New York, NY: McGraw-Hill/Irwin.
Pinheiro JC and Bates DM, 2011. Mixed-effects Models in S and S-PLUS; Corrected third printing.
14574 R Core Team, 2018. R: A Language and Environment
for Statistical Computing. R.F.f.S. Computing. Vienna, Austria.
Reinsel G, 1982. Multivariate repeated-measurement or growth curve models with multivariate random-effects covariance structure. Journal of the American Statistical Association, 77(377): 190-195.
Rencher AC, 2002. Methods of Multivariate Analysis, Second Edition; John Wiley & Sons, Inc. Sammel M, Lin X and Ryan L, 1999. Multivariate linear
mixed models for multiple outcomes. Statistics in Medicine, 18(17‐18): 2479-2492.
Schafer JL and Yucel RM, 2002. Computational strategies for multivariate linear mixed-effects models with missing values. Journal of computational and Graphical Statistics, 11(2): 437-457.
Wang W-L and Fan T-H, 2010. ECM-based maximum likelihood inference for multivariate linear mixed models with autoregressive errors. Computational Statistics & Data Analysis, 54(5): 1328-1341.
West BT, Welch KB and Galecki AT, 2014. Linear mixed models: a practical guide using statistical software; Chapman and Hall/CRC. Wickham H, 2009. ggplot2: Elegant Graphics for Data
Analysis; Springer-Verlag New York.
Yücel RM, 2015. R mlmmm Package: Fitting Multivariate Linear Mixed Effects Models with Missing Values. Turkiye Klinikleri Journal of Biostatistics, 7(1).