Takeovers in New Orleans and Boston
The MIT Faculty has made this article openly available.
Please share
how this access benefits you. Your story matters.
Citation
Abdulkadiroğlu, Atila, Joshua D. Angrist, Peter D. Hull, and Parag
A. Pathak. “Charters Without Lotteries: Testing Takeovers in New
Orleans and Boston†.” American Economic Review 106, no. 7 (July
2016): 1878–1920. © 2016 American Economic Association
As Published
http://dx.doi.org/10.1257/aer.20150479
Publisher
American Economic Association
Version
Final published version
Citable link
http://hdl.handle.net/1721.1/110240
Terms of Use
Article is made available in accordance with the publisher's
policy and may be subject to US copyright law. Please refer to the
publisher's site for terms of use.
1878
Charters without Lotteries:
Testing Takeovers in New Orleans and Boston
†By Atila Abdulkadiro ˘glu, Joshua D. Angrist, Peter D. Hull, and Parag A. Pathak*
Charter takeovers are traditional public schools restarted as charter schools. We develop a grandfathering instrument for takeover atten-dance that compares students at schools designated for takeover with a matched sample of students attending similar schools not yet taken over. Grandfathering estimates from New Orleans show sub-stantial gains from takeover enrollment. In Boston, grandfathered
students see achievement gains at least as large as the gains for students assigned charter seats in lotteries. A non-charter Boston turnaround intervention that had much in common with the takeover strategy generated gains as large as those seen for takeovers, while
other more modest turnaround interventions yielded smaller effects.
(JEL D44, H75, I21, I28)
No child’s chance in life should be determined by the luck of a lottery. — President Barack Obama
The National Alliance for Public Charter Schools (NACPS) reports a net increase of 1,092 charter schools between fall 2011 and fall 2015, with an enrollment gain of 43.6 percent. Charter growth has been especially strong in large urban districts where many students are poor and most are nonwhite. The schools in these dis-tricts are often described as low-performing, with low standardized test scores and
* Abdulkadiro˘glu: Duke University, 419 Chapel Drive, Durham, NC 27708 (e-mail: aa88@duke.edu); Angrist: Massachusetts Institute of Technology, 77 Massachusetts Avenue, Cambridge, MA 02139, and NBER (e-mail: angrist@mit.edu); Hull: Massachusetts Institute of Technology, 77 Massachusetts Avenue, Cambridge, MA 02139 (e-mail: hull@mit.edu); Pathak: Massachusetts Institute of Technology, 77 Massachusetts Avenue, Cambridge, MA 02139, and NBER (e-mail: ppathak@mit.edu). Our thanks to Raymond Cwiertniewicz, Alvin David, Gabriela Fighetti, and Jill Zimmerman from the Recovery School District; to Kamal Chavda and the Boston Public Schools; to Scott Given, Ryan Knight, and the staff at UP Education Network; and to Andrew Bott for graciously sharing data and answering our many questions. We’re grateful to Alonso Bucarey, Stephanie Cheng, Mayara Felix, Ye Ji Kee, Olivia Kim, Elizabeth Setren, Daisy Sun, and Danielle Wedde for exceptional research assistance, and to MIT SEII program directors Annice Correia Gabel and Eryn Heying for invaluable administrative support. Data from the Recovery School District were made available to us through the Institute for Innovation in Public School Choice. We gratefully acknowledge financial support from the Institute for Education Sciences (under Award R305A120269), from the National Science Foundation (under award SES-1426541), and from the Laura and John Arnold Foundation. Thanks also go to seminar participants at the Federal Reserve Bank of New York, the Stanford Graduate School of Business, the Fall 2014 NBER education meeting, and the 2015 SOLE/EALE annual meeting for helpful comments. Joshua Angrist’s daughter teaches at UP Academy Boston. The views expressed here are those of the authors alone. The Obama quote appears in Harmon (2011).
† Go to http://dx.doi.org/10.1257/aer.20150479 to visit the article page for additional materials and author
high truancy and dropout rates.1 Studies using randomized admissions lotteries to evaluate urban charter schools have repeatedly and convincingly shown remarkable achievement gains for urban charter lottery winners. The external validity of these estimates is less clear, however.
In the 2014–2015 school year, the New Orleans Recovery School District (RSD) became America’s first all-charter public school district. This unique transformation offers the opportunity to explore the predictive value of lottery-based charter effects. RSD emerged from a 2003 effort to improve underperforming public schools in New Orleans, home to some of the worst schools in the country. State legislation allowed the Louisiana Department of Education (LDE) to take control of, manage, and delegate the operation of low-performing schools to outside operators. New Orleans public schools that came under state control became part of RSD, while other schools remained under the authority of the Orleans Parish School Board (OPSB).2
Hurricane Katrina decimated New Orleans’ schools in August 2005. In the after-math of the storm, RSD took control of 114 low-performing New Orleans schools, leaving OPSB with authority over only 17 of the schools it ran before Katrina. At the same time, both RSD and OPSB converted increasing numbers of low-performing schools to charters. By fall 2008, when combined RSD and OPSB enrollment had reached 36,000 (just over half of pre-Katrina OPSB enrollment), the RSD charter share hit 49 percent. Since 2008, RSD charter enrollment growth has accelerated further: September 2014 saw the closure of the few remaining direct-run traditional public schools in RSD (OPSB continues to operate a mix of traditional and charter schools).
A distinctive feature of New Orleans’ charter expansion is the fact that most of the RSD charter schools that have opened since 2008 are takeovers. A charter take-over occurs when an existing public school, including its facilities and staff, comes under charter management. Importantly, takeovers guarantee seats for incumbent students, “grandfathering” these students into the new school. By contrast, most charter schools in other districts open as startups, that is, as new schools (some-times in existing school buildings), with no seats guaranteed by virtue of previous enrollment and an active enrollment process that uses a lottery when schools are oversubscribed.
Boston’s experiment with charter takeovers has unfolded with less urgency than New Orleans’, but some of the forces behind it are similar. At the end of the 2010– 2011 school year, nine schools in the Boston Public School (BPS) district were closed as a consequence of their persistently low performance. Two of these schools were replaced by charters: UP Academy Boston replaced the former Gavin mid-dle school and Boston Green Academy (BGA) replaced the former Odyssey high school. These in-district charter schools, known in the state bureaucracy as Type-III Horace Mann schools, mark a new approach to charter authorization and school 1 Charter schools are publicly funded private schools that operate outside the public sector. See the National
Center for Education Statistics (NCES 2013) for national enrollment statistics by sector and NACPS (2013, 2014a, and 2015) for statistics on charter growth and market share. The Center for Research on Education Outcomes (CREDO 2013a) compares the demographic characteristics of traditional public and charter school students; NACPS (2014b) gives statistics on charter shares by district.
autonomy in Massachusetts. The Boston School Committee authorizes in-district charter schools and funds them through the BPS general budget. In-district charter teachers are also members of the Boston Teachers Union. Outside of pay and benefits, however, terms of the relevant collective bargaining agreements are waived and these schools are free to operate according to their charters. Boston’s in-district charters opened with new school leaders and new teaching staff, employed on an essentially at-will basis, while guaranteeing seats to students formerly at Gavin and Odyssey (“legacy schools,” in our vernacular).
This paper evaluates the causal effects of RSD and Boston takeover schools on their students’ achievement using an instrumental variables (IV) strategy that exploits the grandfathering provisions used initially to fill takeover seats. By offering a tool for the evaluation of the rapidly proliferating charter takeover model, grandfathering provides the opportunity to answer new questions about urban school reform. The growing set of econometric estimates exploiting charter admissions lotteries con-sistently show large gains for students at urban charters, but these estimates neces-sarily capture causal effects only for charter applicants—a self-selected population that may be especially likely to see gains from the charter treatment.3 By contrast, grandfathered enrollment in charter takeovers is passive: an existing population is guaranteed seats in the new school. Takeover experiments therefore identify causal effects for students who haven’t actively sought a charter seat.
In addition to contributing to the long-running charter debate, our empirical results are of immediate policy interest. The proliferation of charter takeovers reflects a federal push to encourage states to “require significant changes in schools that are chronically underperforming and aren’t getting better” (Duncan 2010). The FY2011 federal budget addressed this challenge with a dramatic increase in funding for School Improvement Grants (SIGs). Federal SIGs, which offer up to two mil-lion dollars annually per qualifying school, support three restructuring models; the takeover charters studied here qualify for federal support under the “restart” model (US Department of Education 2009). Large urban districts besides Boston and New Orleans have also begun experimenting with takeovers. Tennessee’s Achievement School District and Michigan’s Education Achievement Authority are modeled on RSD, each with a large share of charter takeovers. Philadelphia’s Renaissance Initiative has likewise turned many low-performing schools over to charter man-agement. A British takeover model has also flowered in the form of England’s Academies, conversions of state-run schools that remain publicly-funded but oper-ate with charter-like autonomy (Eyles and Machin 2015).
Our results suggest takeover enrollment boosts achievement by as much or more than the gains seen for urban charter lottery applicants. In addition to a detailed anal-ysis of takeover treatment effects in Boston and New Orleans, we also look briefly at an alternative school restructuring model in Boston, known as a “turnaround.” One turnaround intervention was charter-like, replacing most staff with young outsiders 3 Lottery estimates are reported in, e.g., Abdulkadiro˘glu et al. (2011); Angrist et al. (2012); Angrist, Pathak,
and Walters (2013); Dobbie and Fryer (2011); Dobbie and Fryer (2013); Hoxby, Murarka, and Kang (2009); and Tuttle et al. (2013). Ravitch (2010, pp. 141–144) and Rothstein (2011) challenge the external validity of charter treatment effects estimated using lotteries. See also Rothstein’s account of high scores at KIPP: “They select from the top of the ability distribution those lower-class children with innate intelligence, well-motivated parents, or their own personal drives, and give these children educations they can use to succeed in life” (Rothstein 2004, p. 82).
much like those employed at UP and emphasizing data-driven instruction and stu-dent discipline and comportment. Two other middle school turnarounds were more modest, involving limited reforms and less staff turnover. The first intervention appears to have generated gains as large as those seen at Boston’s in-district charter middle school (subsidized, in part, by greater SIG funding), while the other turn-arounds yielded less impressive effects.
I. Background
A. Why Lottery and Grandfathering Estimates Might Differ
A stylized sample selection model shows why the effects of charter enrollment induced by grandfathering might differ from charter gains identified by admissions lotteries.4 Suppose students face a normally-distributed unobserved net cost of char-ter application, denoted η , applying when η < A for some constant threshold A . We write the gains from charter attendance in potential outcomes notation as Y 1 − Y 0 , also assumed to be normally distributed.
Lottery-generated admission offers, indicated by Z L , are randomly assigned con-ditional on application and therefore concon-ditionally independent of η and potential outcomes. For the purposes of this theoretical discussion we ignore ex post non-compliance with offers, assuming that any applicant offered a charter seat takes it. This implies that lottery-based comparisons of applicants identify the average causal effect for lottery applicants,
E [Y | Z L = 1, η < A] − E [Y | Z L = 0, η < A] = E [ Y 1 − Y 0 | η < A] . With joint normality of outcomes and costs, the average effect of charter enrollment on lottery applicants can be written
E [ Y 1 − Y 0 | η < A] = E [ Y 1 − Y 0 ] − ρ ( Y 1 − Y 0 , η) λ (A) ,
where ρ ( Y 1 − Y 0 , η) is the coefficient from a regression of gains on costs and λ (A) is a positive Mills ratio term.
The selection-on-net-costs model suggests ρ ( Y 1 − Y 0 , η) < 0 , since η equals costs minus benefits. This in turn implies that the average causal effect for lottery applicants exceeds the population average charter attendance gain, E [ Y 1 − Y 0 ] . In other words, as in a simple Roy (1951) model, applicants selected on gains see larger causal effects than would be seen in a random sample.
In the grandfathering scenario, school districts select takeovers from a set of candidate schools judged to be underperforming. Suppose that takeover candidates have Y b < L , where Y b is a standardized baseline score, assumed here to be con-stant within schools, and L is a performance cutoff (e.g., a “Level 4” designation
4 Oreopoulos (2006) similarly compares the causal returns to schooling parameters identified by alternative
in Massachusetts). Suppose also that takeover events, indicated by Z T , are as good as randomly assigned among the set of low-performing candidates (an assumption supported by the covariate balance tests discussed below). Conditional on candidacy, comparisons by grandfathering eligibility, that is, by Z T , identify the average causal effect for students with low baseline scores,
E [Y | Z T = 1, Y b < L]− E [Y | Z
T = 0, Y b < L] = E [ Y 1 − Y 0 | Y b < L] . Again using normality, we have
E [ Y 1 − Y 0 | Y b < L] = E [ Y
1 − Y 0 ] − ρ
(
Y 1 − Y 0 , Y b)
λ (L) ,where ρ
(
Y 1 − Y 0 , Y b)
is the coefficient from a regression of gains on baseline scores and λ (L) is a Mills ratio term. Here too, we ignore ex post noncompliance so as to focus on the takeover decision.In this model, the correlation between baseline scores and the gains from charter enrollment determines the average causal effect identified by grandfathering. We’ve seen elsewhere that applicants with low baseline scores often seem to reap espe-cially high gains from charter enrollment (e.g., Angrist et al. 2012). Most impor-tantly, however, conditional on the baseline score used to gauge low performance, the grandfathering instrument identifies a population average treatment effect.
This discussion shows why the grandfathering identification strategy might gen-erate a more representative average causal effect than lottery-based identification strategies, at least for populations with similar baseline scores. In practice, however, lottery applicants need not be selected on gains (indeed, Walters 2014 finds evidence for a kind of “reverse Roy” selection pattern). Ultimately, the relative magnitude of lottery- and grandfathering-based estimates is an empirical question, resolved in part by the analysis that follows.
B. Takeovers in New Orleans RSD
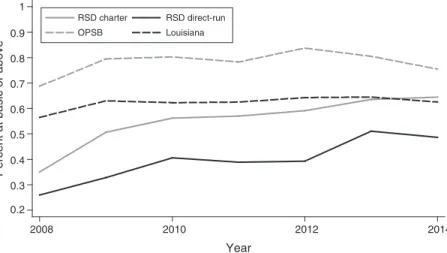
The 2008 school year marked the beginning of a period of relative stability in RSD enrollment, leadership, and finances, along with district-wide improvements in test scores. RSD achievement gains in both direct-run and charter schools are described by Figure 1, which compares post-2008 math achievement trends in RSD and OPSB with all schools in Louisiana. Average achievement for traditional and RSD charter students runs mostly below the statewide and OPSB averages, but the RSD shortfall was much reduced by 2014.
Among the RSD charter schools opened since fall 2008 and operating in spring 2014 (excluding alternative schools that serve special populations), 21 are takeovers and 13 are startups.5 Even by the standards of the heated debate over school reform, the proliferation of charter takeovers in New Orleans has proven to be especially controversial (see, for example, Darling-Hammond 2012).
Appendix Table A1 lists the 18 New Orleans RSD schools that experienced what the district calls a full charter takeover between fall 2008 and fall 2013. Full take-overs convert all grades in the legacy school at the same time; the takeover school grandfathers legacy students in the relevant grades, and typically opens in the leg-acy school building. Alternatives to the full takeover model include principal-led conversions, phased-in takeovers, and school mergers. We focus on full takeovers because these are broad and well-defined transformations, with a clearly identified grandfathering cohort at the relevant legacy school. Our takeover analysis omits charter-to-charter takeovers, for which we were unable to construct a credible con-trol group (though these play a role in a supplementary analysis that allows for non-takeover charter effects). The two high schools in the table are also omitted; our analysis focuses on schools with middle school grades (in RSD, these are almost all K–8 schools) because this is where takeovers are most common and because the legacy school scores used in our IV strategy are unavailable for high schoolers.6
The decision to effect a full takeover at a low-performing RSD school was driven in part by average test scores and in part by the availability of an interested and acceptable charter operator. Operators typically applied for a charter early in the legacy year, with some indicating a preference for specific schools. Takeover deci-sions were usually announced no earlier than December of the legacy year, with the charter operator selected between January and May. Low test scores figured importantly in takeover decisions, but legacy schools have not usually been the very 6 Louisiana issues five types of charters, according to whether the charter is authorized by the local school board
or the LDE, whether the school is new or a conversion, and whether it’s in RSD. RSD’s Type 5 charter schools, the focus of our study, are authorized and overseen by the LDE.
0.2 0.3 0.4 0.5 0.6 0.7 0.8 0.9 1
Percent at basic or above
2008 2010 2012 2014
Year
RSD charter RSD direct-run OPSB Louisiana
Figure 1. Math Scores in RSD and Elsewhere
Notes: This figure plots the average percentage of RSD, OPSB, and Louisiana students that achieve basic or above status on LEAP/iLEAP math exams in fifth–eighth grades. Scores for OPSB and Louisiana students are from the Louisiana Department of Education, https://www. louisianabelieves.com/resources/library/test-results (accessed October 14, 2014).
lowest-performers in the district. The matching strategy detailed below exploits the fact that many similarly low-performing direct-run schools continued to operate alongside legacy schools after the latter were converted to charters.
Table A1 shows that the 11 legacy schools in our study were taken over by 6 char-ter management organizations (CMOs), with the Crescent City and ReNEW CMOs each operating multiple schools. In two 2013 takeovers, two legacy schools were merged into a single takeover school. Table A1 also shows that seven out of nine study takeovers were operated by CMOs that identify with No Excuses pedagogy.7 The No Excuses model for urban education—sometimes also called “high expecta-tions”—is characterized by extensive use of tutoring and targeted remedial support, reliance on data and teacher feedback, a focus on basic skills, high expectations from students and staff, and an emphasis on discipline and comportment. New Orleans Parents’ Guide school brochures suggest that almost all takeovers enacted policies associated with No Excuses, including an extended school day, student uniforms, and parent involvement groups; many also extended the school year and added weekend classes. Angrist, Pathak, and Walters (2013) and Dobbie and Fryer (2013) present evidence suggesting that No Excuses practices explain the success of urban charters in Massachusetts and New York.
RSD’s charter schools function outside the collective bargaining agreement between OPSB and the United Teachers of New Orleans union that represents teach-ers at non-charter OPSB schools and a few OPSB chartteach-ers (Cowen Institute 2011). Appendix Table A2 compares teacher characteristics, expenditure, and class size at RSD direct-run and charter schools. Teachers at RSD charters tend to have less experience and earn lower base salaries than those at direct-run schools. Class sizes at takeover and legacy schools are similar and close to those seen at other charter and direct-run public schools. Per-pupil expenditure is somewhat lower at RSD charter schools, though this may reflect differences in the student body and the teacher experience distribution. The per-pupil expenditure contrast between takeover and legacy schools shows only a small gap.
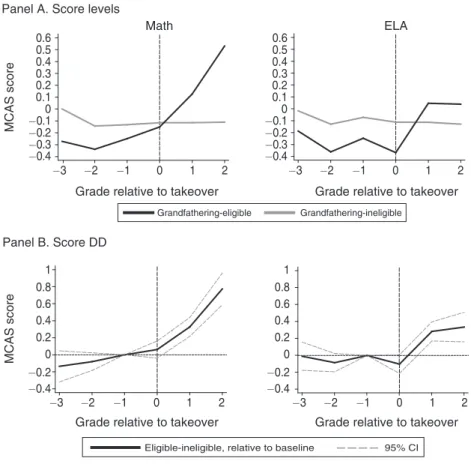
C. UP from Gavin Middle School
We supplement the RSD analysis with estimates of attendance effects at UP Academy, Boston’s first in-district charter middle school. The UP Education Network is rapidly expanding, having recently assumed responsibility for manage-ment of two schools in Boston’s Dorchester neighborhood (one elementary and one K–8), and opened two (non-charter) middle schools in Lawrence, Massachusetts. Our middle school focus necessarily excludes BGA, Boston’s in-district charter high school. In this context, it’s worth noting that BGA is more of an in-district conversion than a charter takeover, since it was initially staffed by BPS teachers and administrators previously employed elsewhere in the district.8
7 Table B1 in the online Appendix lists sources for this classification.
Boston’s in-district model is one of a number of policy experiments initiated at low-achieving schools in 2010.9 As in RSD, the birth of an in-district charter reflects both the district’s desire to address poor performance and the interest expressed by a qualified charter operator: UP Education Network was selected partly because UP was ready to grandfather all Gavin students (Toness 2010). Gavin students were automatically admitted to UP Boston, though a simple application form was required (UP staff visited Gavin students’ homes to encourage application).10
Unlike other charter schools in Boston, which operate as independent districts and are funded by inter-district transfers, UP’s spending appears in the BPS budget. Former Gavin teachers were free to apply for positions at UP, and a handful did so, but their positions were not grandfathered and, according to school officials, none were ultimately hired. UP administrators and staff are part of the collective bar-gaining units representing other BPS workers, but the school functions in a looser framework established in memoranda between UP and the district. UP is required to pay collectively bargained salaries, but school leaders and UP administrators make personnel decisions freely, as in a nonunion workplace.
As can be seen in column 8 of Table A2, which also compares teacher character-istics at the Boston schools in our study, UP’s teachers are much younger than the Gavin staff they replaced: 60 percent of the UP teachers in our sample are no older than 28. This is unusually youthful even by the standards of Boston’s other charter schools. UP class sizes are smaller and UP’s per-pupil expenditure is somewhat lower than at the Gavin school. Like most of our RSD takeovers, the UP charter aligns the school with No Excuses principles.11 The UP school day is two hours longer than the Gavin day had been and UP teachers are expected to report for work on August 1.
D. Related Research on Takeovers and Turnarounds
Dee (2012) uses the test proficiency cutoffs that determine SIG qualification to evaluate SIG participation in a regression discontinuity design. Dee’s estimates suggest that SIG-funded interventions improve performance for students at treated schools. A companion difference-in-differences analysis points to the intermediate federal turnaround model as the most effective, while estimates for the remaining two SIG strategies, including restarts, are not significantly different from zero. It’s worth
9 Gavin and Odyssey were among BPS’s lowest-performing schools in 2010, though not the lowest. The
state categorized these schools as “Level 3,” meaning they were found in the bottom 20 percent of the relevant grade-specific performance distribution. In response to our queries, BPS administrators emphasized that in-district charter conversion was one of several strategies available to the district for schools in Level 3. Lower-ranked Level 4 schools were not eligible for in-district conversion.
10 Some high needs special education students at Gavin were grandfathered into the Richard Murphy school,
which operates a satellite program in the former Gavin building (BPS 2013, p. 6, p. 146). These cases notwithstand-ing, the overall UP enrollment take-up rate for grandfathered special education students is close to that for other grandfathered students. Estimates conditional on baseline special education status are also similar to those from the full sample.
11 Specifically, UP’s charter application states “all stakeholders should not make or accept excuses for
any-thing less than excellence,” and describes key No Excuses practices as part of their educational programming (UP Academy 2010). More recent school documents emphasize a culture of “high expectations.” (http://www. upeducationnetwork.org/uploads/documents/15-1015-UPEN-frequently-used-terms-vf.pdf, accessed May 5, 2016.)
noting, however, that very few California schools opted for the more radical restart intervention, and Dee’s (2012) estimates for the restart treatment are imprecise.
Houston’s pioneering Apollo 20 program revamped educational practices along No Excuses’ lines in 20 of Houston’s lowest performing schools, while also replac-ing most school leaders and half of the teachreplac-ing staff in these schools; a similar effort was undertaken on a smaller scale in Denver. The insertion of charter school best practices in existing public schools provides a natural alternative to the takeover model studied here, and qualifies for the same sort of federal support. Fryer’s (2014) analysis of Apollo using randomized and quasi-experimental research designs shows statistically significant gains in math of between one-fifth and one-sixth of a standard deviation, with little effect on reading. In the spirit of our grandfathering strategy, Fryer’s quasi-experimental analysis uses baseline enrollment zones to con-struct instruments.12
CREDO (2013b) evaluates the effects of attending three RSD takeover charters. The CREDO study contrasts students based on baseline and post-takeover enroll-ment status, comparing, for example, students who move into and who exit from schools slated for charter conversion. The potential for selection bias would seem to make these sorts of comparisons hard to interpret. In related work, CREDO (2013c) reports modest gains from the New Orleans charter sector as a whole in a national matched-pair study of overall urban charter school effectiveness. Along the same lines, McEachin, Welsh, and Brewer (2014) offer a regression-controlled value-added style analysis of New Orleans school sectors that does not isolate effects on takeover students.
II. Grandfathering Identification A. The RSD Comparison Group
Our grandfathering research design uses a combination of matching and regres-sion to mitigate omitted-variables bias in comparisons of grandfathering-eligible and ineligible students. To see how the matched comparison group is constructed, consider the set of sixth graders enrolling at an RSD school slated for takeover at year’s end: sixth grade legacy school enrollment entitles this group to seventh grade seats in the takeover charter. Since legacy and takeover schools in RSD typ-ically enroll grades K–8, there are few non-legacy sixth graders who share a fifth grade school with the grandfathering-eligible group. We therefore look for a com-parison group in the population of sixth graders not enrolled at the legacy school, but who attended schools similar to those attended by legacy school students in fifth grade (we refer to these as baseline schools). Specifically, baseline schools are considered matched when they have School Performance Scores (SPS) in the
12 Unlike Fryer (2014), our grandfathering strategy matches on baseline school characteristics to eliminate
covariate differences associated with the grandfathering instrument and allows for violations of the exclusion restriction that may compromise naïve matched comparisons. In a methodologically related study, Jacob (2004) also uses an initial condition—whether a student resides in a public housing building later slated for demolition—as an instrument for the effect of public housing on children’s achievement.
same five-point bin.13 In addition to baseline schools, the RSD comparison sample matches grandfathering-eligible and ineligible students on race, sex, baseline year, baseline special education status, and baseline subsidized lunch eligibility.
In practice, the RSD grandfathering experiment involves multiple grades, schools, and years. The relationship between legacy grades, baseline grades, and takeover grades is described in Table 1. Because the earliest available baseline infor-mation is from third grade, the RSD sample covers legacy school enrollment in grades four through seven and takeover charter enrollment in grades five through eight. Potential takeover exposure thus ranges from one year for students in sev-enth grade in the legacy year to four years for students in fourth grade in the legacy year (or more if grades are repeated). Students may have been eligible for grand-fathering into multiple takeover charters; the grandgrand-fathering instrument indicates eligibility at any of the takeover schools we study. When pooling across grades, we retain students in the first year they become grandfathering-eligible or are matched to a grandfathering-eligible student. The number of grandfathering-eligible students enrolled in a legacy school in the fall of the year prior to takeover averages roughly 70 students per school and is about one-third the size of the matched comparison group (Table B2 in the online Appendix reports the number of observations contrib-uted by each RSD legacy school).
The primary RSD outcomes are math and English Language Arts (ELA) scores from the Louisiana Educational Assessment Program (LEAP) in fourth and eighth grade and the Integrated Louisiana Educational Assessment Program (iLEAP) in
13 SPS scores are used for accountability purposes within RSD. In the period relevant to our study, SPS scores
ranged from 0 to 200. Our results are virtually unchanged when smaller bins are used; bins wider than about 10 points generate a coarse match with many low-scoring schools grouped together. Instrument balance, documented in Table 2 and discussed below, is driven mainly by matching on SPS bins.
Table 1—Grade Progression in the Grandfathering Research Design Legacy
Baseline Legacy Takeover grades enrollment years
grade grade First Second Third Fourth (No. of schools)
Panel A. RSD Study takeovers 3 4 5 6 7 8 2009–2010 (5) 4 5 6 7 8 2010–2011 (1) 5 6 7 8 2011–2012 (1) 6 7 8 2012–2013 (4) Panel B. Boston UP 5 6 7 8 2010–2011 (1) 5 7 8 Dearborn/Harbor 5 6 7 8 2009–2010 (2) 5 7 8 Orchard Gardens 5 6 7 8 2009–2010 (1) 6 7 8
Notes: This table summarizes grade-based timing for the selection of baseline schools, grandfathering eligibility, and takeover outcomes in the RSD and Boston analysis samples. Grandfathering eligibility is determined by enrollment in the fall of the legacy enrollment year, while matching uses information from the baseline grade. Outcomes are from the spring of the corresponding school year for each takeover grade. The number of legacy schools in each aca-demic year appears in parentheses.
grades five through seven. Scores are from spring 2011, the first post-takeover test date for the schools in our sample, through 2014.14 A data Appendix details the construction of our analysis files from raw student enrollment, demographic, and outcome data. For the purposes of statistical analyses, scores are standardized to the population of RSD test-takers in the relevant subject, grade, and year.
As can be seen in the first two columns of Table 2, almost all RSD and RSD charter-bound students (those enrolled in an RSD charter school in the grades fol-lowing baseline) are black, and most are poor enough to qualify for a subsidized lunch. RSD charter-bound students have baseline scores near the overall district mean (zero, by construction). By contrast, students who enroll in takeover char-ters and those eligible for grandfathering have much lower baseline test scores. For example, the average baseline math score of grandfathering-eligible students in our analysis sample is around 0.27 σ below the corresponding RSD population average. This marks an important contrast with samples of lottery applicants at oversub-scribed charter schools, a group that’s often positively selected on baseline char-acteristics.15 Columns 3–5 of Table 2 compare characteristics of takeover charter students and grandfathering-eligible students with those of the grandfathering com-pliers for whom grandfathering instruments identify average causal effects. The lat-ter group is defined as the set of students who enroll in an in-district charlat-ter when grandfathered but not otherwise.16 Compliers’ baseline scores are not as low as the scores in the population of students at risk for grandfathering, but they still fall around 0.1–0.15 σ below the district average.
The RSD comparison group appears to be well-matched to the RSD grandfathering-eligible sample. This is documented in column 6 of Table 2, which reports regression-adjusted differences in variables that were not used for matching. The balance coefficients in column 6 come from a model that includes a full set of matching-cell fixed effects, with no further controls. These estimates show no sta-tistically significant differences in limited English proficiency rates or in baseline scores.
Table B3 in the online Appendix reports follow-up rates and measures of dif-ferential attrition in the RSD analysis sample. Follow-up scores are available for almost three-quarters of students in the first two post-takeover years. The follow-up rate declines in years three and four, reflecting RSD’s highly mobile low-income population. Importantly, however, the likelihood an RSD student contributes an out-come score to the analysis sample is unrelated to his or her grandfathering eligibility within matching cells. Column 7 of Table 2 similarly shows that baseline covariates are balanced in the subsample for which we can measure outcomes.
14 LEAP and iLEAP include multiple-choice and open-answer questions. LEAP scores are used for determining
grade progression according to Louisiana state guidelines. The iLEAP test combines a test of academic standards and (through 2013) a norm-referenced component from the Iowa Test of Basic Skills (ITBS) through 2012–2013.
15 In the middle school sample analyzed in Abdulkadiro˘glu et al. (2011), for example, the baseline math gap
between charter applicants and Boston students is around 0.36 σ .
16 Following Abadie (2003), complier means are computed as weighted averages, weighting by
κ = 1 − _________D (1 − Z)
1 − E [Z | X] − ( 1 − D) Z
_______
E | Z | X] , where D denotes takeover enrollment in the first exposure year and Z denotes grandfathering eligibility. For this purpose, E [Z | X] is estimated by a saturated regression of the grandfathering instrument on matching-cell fixed effects.
B. RSD Grandfathering Graphics
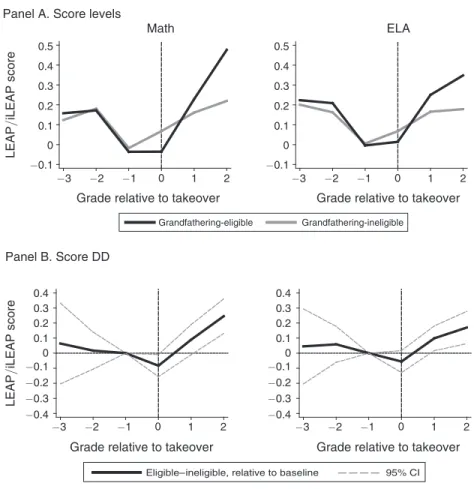
We motivate the grandfathering identification strategy for RSD with a graphical comparison of achievement trends in the grandfathering-eligible and matched com-parison samples. Provided scores in the eligible cohort and the comcom-parison group
Table 2—RSD Descriptive Statistics and Grandfathering Balance Sample means
RSD Analysis sample Balance coefficients
All students Charter-bound students Takeover charter students Grandfathering-eligible students Grandfathering compliers Analysis sample First exposure year (1) (2) (3) (4) (5) (6) (7) Hispanic 0.026 0.024 0.018 0.029 0.008 — — Black 0.964 0.971 0.994 0.982 0.997 — — White 0.019 0.016 0.008 0.016 0.004 — — Asian 0.008 0.008 0.001 0.009 0.000 — — Female 0.475 0.473 0.489 0.501 0.496 — — Special education 0.069 0.066 0.071 0.093 0.048 — — Free/reduced price lunch 0.912 0.926 0.955 0.919 0.963 — — Limited English 0.017 0.016 0.013 0.020 0.007 0.000 −0.001 proficient (0.001) (0.001) N 14,575 11,381 1,040 763 2,061 3,503 2,572 Baseline math −0.001 0.019 −0.320 −0.266 −0.151 −0.019 −0.042 score (0.048) (0.052) N 12,960 10,565 1,038 760 2,059 3,500 2,570 Baseline math −0.099 −0.084 −0.261 −0.254 −0.281 0.007 0.009 gain (0.069) (0.081) N 4,871 4,099 330 241 819 1,235 993 Baseline ELA 0.000 0.022 −0.303 −0.261 −0.112 −0.009 −0.032 score (0.048) (0.055) N 12,967 10,572 1,040 762 2,061 3,502 2,572 Baseline ELA −0.105 −0.097 −0.181 −0.182 −0.141 −0.015 0.001 gain (0.072) (0.079) N 4,879 4,105 330 241 819 1,235 993
Notes: This table reports sample means and coefficients from regressions of the variable in each row on a grandfa-thering eligibility dummy indicating enrollment in an RSD takeover legacy school in the fall of the academic year prior to takeover. Baseline test score gains are relative to the previous pre-baseline grade, constructed only for the subsample with pre-baseline information. All regressions include matching cell fixed effects (cells are defined by race, sex, special education status, subsidized lunch eligibility, baseline grade and year, and baseline school SPS scores in five-point bins). The sample in columns 3–7 is restricted to students enrolled in an RSD direct-run school at baseline. Column 1 reports means for a sample of RSD students enrolled in the same baseline years as the anal-ysis sample, while column 2 is restricted to those students that enroll in an RSD charter school in grades follow-ing the baseline grade. Column 3 reports means for students that enroll in a takeover charter in potential takeover grades, while column 4 describes students enrolled in a legacy school. Column 5 reports means and counts of grand-fathering compliers. Robust standard errors are reported in parentheses.
move in parallel in the pre-takeover period, differences in score growth between eligible and ineligible students in the post-takeover period offer compelling evi-dence of a takeover treatment effect. The scores plotted here are standardized to samples of students at RSD’s direct-run schools, so achievement trends are cast relative to this group (the statistical analysis uses scores standardized to the district, as in Table 2).
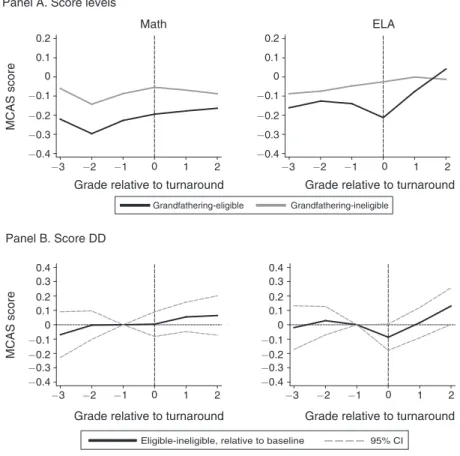
The upper panels of Figure 2 show remarkably similar pre-takeover trajectories for the math and ELA scores of grandfathering-eligible students and their matches (as for the balance regression estimates reported in Table 2, Figure 2 compares residuals from a regression on matching-cell fixed effects with no other controls). Consistent with RSD’s goal of transforming low-performing schools, relative achievement in the grandfathering-eligible group declines in the grade before take-over. Importantly, the pre-takeover dip (reminiscent of the pre-treatment earnings
A: Score levels -.4 -.3 -.2 -.1 0 .1 .2 .3 .4
Standardized LEAP/iLEAP score
( -.4 -.3 -.2 -.1 0 .1 .2 .3 .4 .5 .6
Standardized MCAS score
-3 -1 −0.1 0 0.1 0.2 0.3 0.4 0.5 −0.1 0 0.1 0.2 0.3 0.4 0.5 LEAP /iLEAP score LEAP /iLEAP score −3 −2 −1 1 2
Grade relative to takeover Grade relative to takeover
Grade relative to takeover Grade relative to takeover
Math ELA −0.4 −0.3 −0.2 −0.10 0.1 0.2 0.3 0.4 −0.4 −0.3 −0.2 −0.10 0.1 0.2 0.3 0.4 0 −3 −2 −1 0 1 2 −3 −2 −1 0 1 2 −3 −2 −1 0 1 2 Grandfathering-eligible Grandfathering-ineligible
Eligible–ineligible, relative to baseline 95% CI
Panel A. Score levels
Panel B. Score DD
Figure 2. Test Scores in the RSD Grandfathering Sample
Notes: Panel A plots average LEAP/iLEAP math and ELA scores of students in the RSD leg-acy middle school matched sample. Panel B plots achievement growth relative to the baseline (−1) grade. Estimates in both panels control for matching cell fixed effects. Scores are stan-dardized to those of students at direct-run schools in New Orleans RSD, by grade and year. Grade 0 is the last grade of legacy school enrollment.
dip documented by Ashenfelter (1978) for applicants to job training programs) is mirrored in the matched comparison group. The comparison in Figure 2 does not adjust for baseline student achievement, so parallel trends are not guaranteed, but rather reflects the success of the matching strategy in producing similar treatment and control groups.
Matching effectively eliminates baseline differences by grandfathering status, so simple post-treatment comparisons seem likely to reveal causal effects. Difference-in-differences (DD) style comparisons of achievement growth appear in the lower panel of Figure 2, which plots achievement growth in the grandfathering-eligible and ineligible subsamples relative to the baseline grade. Pre-baseline growth differences by grandfathering status are centered around zero, while achievement contrasts after the legacy year strongly favor the grandfathered cohort. Since around 66 percent of students are caused to matriculate at a takeover charter when grandfathered (a figure reported in Table 3, panel C), this pattern suggests takeover enrollment significantly boosts achievement.
Figure 2 shows parallel pre-takeover trends in years up to, but not including, the last grade of legacy school enrollment (grade 0 in the figure). The negative and significant (for math) DD contrast in the last legacy grade signals a possible causal effect of legacy enrollment per se, regardless of whether legacy attendance leads to subsequent enrollment in the takeover charter. This is an unsurprising but poten-tially important finding: legacy schools were slated for closure in part because of extraordinarily low and even declining achievement. Moreover, closure itself might be disruptive, with lasting consequences for legacy students. Our grandfathering IV strategy therefore allows for direct effects of legacy school attendance when using legacy school enrollment to instrument takeover attendance.
C. Econometric Framework
Consider a group of legacy school students and their matched comparison coun-terparts with covariate values falling in a single matching stratum. Achievement for each student is observed in two grades: at the end of the legacy grade, imme-diately prior to the takeover (grade l ), and after the takeover (grade g ). The grandfathering-eligible group is mostly enrolled in the takeover school in grade g , while few in the comparison group are. A dummy variable Z —the grandfathering instrument—indicates legacy school enrollment in grade l (observed at the start of the school year) while the variable D indicates takeover school enrollment at any time in grade g . Achievement in the two grades is denoted Y l and Y g , observed at the conclusion of the school year.
Legacy school enrollment in grade l potentially affects grade g achievement through two channels: by increasing the likelihood of takeover attendance in grade g and by adding a year’s exposure to the legacy school in grade l , an event that may have lasting consequences. Potential outcomes in grade g are therefore double-indexed. Specifically, we write Y zdg to indicate the grade g outcome that would be observed when Z = z and when D = d . Potential outcomes in grade l , written Y zl , are indexed against Z alone, since grade l predates takeover exposure. Using the potential treat-ments notation of Imbens and Angrist (1994), legacy enrollment shifts takeover
exposure from D 0 to D 1 . In this setup, observed outcomes are determined by poten-tial outcomes and grandfathering as follows:
Y l = Y 0l + Z
(
Y 1l − Y 0l)
, D = D 0 + Z ( D 1 − D 0 ) , Y g = Y 00g + Z(
Y 10g − Y 00g)
+ D ( Y 01g − Y 00g + Z(
Y 11g − Y 10g −(
Y 01g − Y 00g)
)
) = Y 00g + Z(
Y 10g − Y 00g)
+ ( D 0 + Z ( D 1 − D 0 )) ( Y 01g − Y 00g +Z(
Y 11g − Y 10g −(
Y 01g − Y 00g)
)
) , where the last line uses the expression for D to obtain a representation for observed Y g as a function of potential outcomes, potential treatments, and the instrument.We assume potential outcomes and treatments satisfy the following assumptions: ASSUMPTION 1 (Independence):
(
Y 0l , Y1l , Y 00g , Y 01g , Y 10g , Y 11g , D 0 , D 1
)
⫫ Z. ASSUMPTION 2 (Monotonicity): Pr ( D 1 ≥ D 0 ) = 1.ASSUMPTION 3 (First stage): Pr ( D 1 > D 0 ) > 0.
Assumption 1—Independence—asserts that the grandfathering instrument is as good as randomly assigned, that is, independent of potential outcomes and poten-tial treatment take-up (implicitly, within matching strata). Table 2 and Figure 2, which show that matching eliminates covariate and baseline score differences in our RSD analysis sample, support this. Monotonicity says that legacy enrollment either induces takeover enrollment or has no effect for everyone in the analysis sample. Assumption 3 requires legacy enrollment to induce takeover enrollment, at least for some.
As in the Angrist, Imbens, and Rubin (1996) framework for identification of local average treatment effects (LATEs) with possible violations of the exclusion restriction, Assumptions 1–3 allow for direct effects of legacy exposure on grade g outcomes. Such effects arise if Y 1dg ≠ Y 0dg when D is fixed at d . In other words, main-taining the assumption that legacy enrollment is as good as randomly assigned, we’ve allowed for violations of the exclusion restriction associated with use of Z as an instrument for D . This is motivated by the possibility that an additional year of exposure to a low-performing school has lasting effects.
Rather than defend a conventional exclusion restriction in this setting, we replace it with a weaker restriction on potential achievement gains. This allows for direct additive effects of legacy enrollment that are free to vary within the LATE subpopulations of always-takers (those with D 1 = D 0 = 1 ), never-takers (those with D 1 = D 0 = 0 ), and compliers (those with D 1 > D 0 ):
ASSUMPTION 4 (Gains Exclusion): E [ Y 1dg − Y 1l | T ] = E [ Y
0dg − Y 0l | T ] , where
T = a D 0 + n (1 − D 1 ) + c ( D 1 − D 0 ) identifies always-takers ( a ), never-takers ( n ),
Assumption 4 requires that expected potential achievement gains be the same for those who do and don’t attend the legacy school in grade l , once takeover enrollment is fixed. This allows for Y 1dg ≠ Y 0dg , while also weakening the canonical exclusion restriction applied to gains, which says that Y 1dg − Y 1l = Y 0dg − Y 0l for everyone rather than just on average. Balance in pre-baseline to baseline score gains by grandfather-ing eligibility status—documented for the RSD matched sample in Table 2—serves as an indirect test of this assumption.
Assumption 4 is justified by an additive structure for expected potential outcomes in each grade:
(1) E [ Y zl | T = s] = α
1s + z γ s
(2) E [ Y zdg | T = s] = α 2s + z γ s + d β s .
The parameters α 1s and α 2s in these expressions are subgroup-specific potential outcome means with both the legacy- and takeover-enrollment indicators switched off; γ s is an additive legacy school enrollment effect common to grades l and g , and β s is the causal effect of takeover attendance for LATE subgroup s . This additive model rules out interactions between legacy and takeover attendance effects, while allowing legacy effects to persist across grades.
The theorem below (proved in the Appendix) shows that under Assumptions 1–4, a Wald-type IV estimator applied to achievement gains captures the average causal effects of takeover attendance on grandfathering compliers’ achievement:
THEOREM 1: Under Assumptions 1–4,
_______________________________E [ Y g − Y l | Z = 1] − E [ Y g − Y l | Z = 0]
E [D | Z = 1] − E [D | Z = 0] = E [ Y 11
g − Y
10g | D 1 > D 0 ]
= E [ Y 01g − Y 00g | D 1 > D 0 ] .
In the notation of equations (1) and (2), this theorem establishes identification of β c for a model where legacy enrollment has direct effects.
We use Theorem 1 in two ways: to capture causal effects of Bernoulli takeover enrollment in the year following a takeover and to capture causal effects of years of takeover exposure on outcomes in later years. The latter is supported by an exten-sion of Theorem 1 detailed in the Appendix, which shows how the IV estimand for an ordered treatment can be interpreted as a convex combination of incremen-tal average causal effects. The Appendix also discusses results from a model that relaxes Assumption 4.
These econometric considerations motivate a two-stage least squares (2SLS) estimator with second-stage estimating equation that can be written
(3) Y itg − Y il = α′ X it +
∑
j κ j d ij + β D it + η it ,
where Y itg is student i ’s score in year t in grade g and Y il is i ’s score in the last grade in which he or she was potentially enrolled at the legacy school. The treatment variable
here, D it , counts the number of years student i spent at the takeover school as of year t , up to and including the grade enrolled in that year ( D it is Bernoulli for tests taken in the first year of takeover operation).
The first stage equation that accompanies (3) is (4) D it = δ′ X it +
∑
j μ j d ij + π Z i + ν it ,
where Z i is the excluded instrument, an indicator of legacy enrollment in the fall of the legacy school’s final year in operation, and π is the associated first stage coefficient. As with the models used to investigate covariate balance, equations (3) and (4) control for matching cell fixed effects. In particular, because the compar-ison sample is generated by an exact match on race, sex, baseline special educa-tion status, baseline subsidized lunch eligibility, baseline school SPS bins, baseline year, and the legacy grade, equations (3) and (4) include dummies for each of these cells, denoted d ij for cell j . The empirical first- and second-stage models also include dummies for English proficiency and year-of-test (denoted by the vector X it , with coefficients α and δ ). Finally, although baseline scores appear to be uncorrelated with grandfathering exposure in RSD, X it includes these controls to boost precision.
III. Charters without Lotteries in New Orleans RSD A. Grandfathering Results
Each year of enrollment in an RSD takeover charter increases math and ELA scores by an average of 0.21σ and 0.14σ , respectively (the associated standard errors are on the order of 0.04 ). These IV estimates, reported in the last column of Table 3, are generated by a first stage of about 1.1 years of additional takeover exposure for grandfathered students (first stage estimates are reported in column 3 of the table).17
Analyses that disaggregate by outcome grade and by years of potential takeover exposure show that takeover effects are larger in seventh and eighth grade than ear-lier, and are larger in the first two years of takeover exposure than later. The first stage effect of grandfathering eligibility on enrollment in the first exposure year, reported at the top of panel C, reveals that grandfathering boosted initial takeover enrollment rates by around 66 percentage points.
The IV estimates generated by the grandfathering design exceed (and, in many cases, are significantly different from) the corresponding OLS estimates reported in column 2 of Table 3. This suggests that uninstrumented comparisons by take-over enrollment status, such as those reported in CREDO (2013b), may be biased downward.
IV estimates that fail to adjust for possible effects of pre-takeover legacy school enrollment also appear to be too small. Fitting versions of equations (3) and (4) to post-treatment levels rather than gains generates math and ELA effects of 0.16σ
17 In January 2016, ReNEW SciTech Academy was accused of breaking state testing rules in the 2014–2015
school year (Dreilinger 2016). This year is not in our data. Estimates of takeover effects are changed little by the omission of SciTech and ReNEW schools.
and 0.11σ , respectively. Differences between these estimates and those for gains are consistent with the negative legacy-year treatment effects suggested by Figure 2. Appendix Table A3 reports legacy year treatment effects and estimates of models that weaken Assumption 4 to allow for partial pass-through of legacy effects—these estimates differ little from the estimates reported in Table 3.18
B. Interpreting RSD Takeover Effects
The RSD grandfathering identification strategy compares students that mostly attend takeover charters with a grandfathering-ineligible comparison group that went to various sorts of schools. Most students in the comparison group began 18 Estimates of effects on science and social science are reported in Table B4 of the online Appendix. Estimates
by sex and baseline achievement appear in online Appendix Table B5.
Table 3—Grandfathering IV Estimates of RSD Takeover Effects
2SLS Comparison
group mean OLS First stage Enrollment effect
(1) (2) (3) (4)
Panel A. All grades
(Fifth through eighth) Math (N = 5,625) −0.089 0.123 1.073 0.212
(0.020) (0.052) (0.038)
ELA (N = 5,621) −0.092 0.082 1.075 0.143
(0.018) (0.052) (0.039)
Panel B. By grade
Fifth and sixth grades Math (N = 2,579) −0.091 0.099 0.738 0.165
(0.035) (0.041) (0.068)
ELA (N = 2,579) −0.116 0.023 0.745 0.101
(0.033) (0.042) (0.070)
Seventh and eighth grades Math (N = 3,046) −0.086 0.133 1.355 0.231
(0.020) (0.070) (0.037)
ELA (N = 3,042) −0.071 0.104 1.352 0.171
(0.019) (0.070) (0.036)
Panel C. By potential exposure
First exposure year Math (N = 2,553) −0.105 0.200 0.659 0.230
(fifth through eighth grades) (0.044) (0.023) (0.069)
ELA (N = 2,553) −0.103 0.099 0.659 0.197
(0.043) (0.023) (0.068)
Second exposure year Math (N = 1,664) −0.151 0.168 1.148 0.332
(sixth through eighth grades) (0.031) (0.061) (0.058)
ELA (N = 1,664) −0.124 0.101 1.158 0.158
(0.028) (0.061) (0.051)
Third and fourth exposure year Math (N = 1,408) 0.015 0.097 1.698 0.117
(seventh and eighth grades) (0.022) (0.131) (0.042)
ELA (N = 1,404) −0.033 0.077 1.698 0.094
(0.020) (0.132) (0.043)
Notes: This table reports OLS and 2SLS estimates of the effects of RSD takeover charter enrollment on fifth through eighth grade LEAP/iLEAP math and ELA test scores using the grandfathering eligibility instrument. The sample in columns 2–4 includes RSD direct-run school students matched to legacy school students. The endogenous regres-sor counts the number of years enrolled at a takeover charter prior to testing. All models control for matching strata, limited English proficiency, baseline test scores, and year/grade effects. Robust standard errors, clustered by stu-dent, are reported in parentheses. Means in column 1 are for grandfathering-ineligible matched students.
middle school at one of RSD’s direct-run public schools. But the distribution of takeover alternatives evolved as RSD closed its direct-run schools and as students changed schools for reasons other than closure. Estimates of RSD takeover effects therefore reflect a growing share of charter-to-charter comparisons. If non-takeover charters also boost achievement, the takeover effects reported in Table 3 might mask a higher charter-versus-traditional average causal effect.
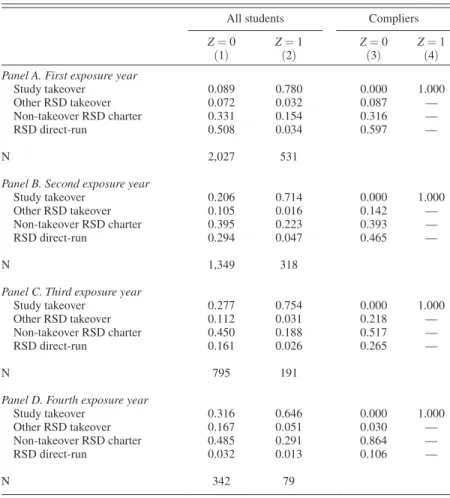
Table 4 describes the counterfactual school sector distribution in detail, focus-ing on the distinction between the charters that define the takeover treatment for the purposes of Table 3 (“study takeovers”), other takeover schools (including charter-to-charter conversions), non-takeover RSD charters, and direct-run RSD schools. Specifically, the first two columns show the distribution of school types by grandfathering status, while column 3 describes the types of schools attended by untreated compliers. Complier counterfactuals are constructed by estimating causal effects of the takeover enrollment dummy, D , on a vector of school sector indicators, W . Associated with each W are potential attendance outcomes, W 0 and W 1 , describ-ing school choices in non-treated and treated states (that is, potential school type
Table 4—The Changing School Sector Distribution in RSD
All students Compliers
Z= 0 Z= 1 Z= 0 Z= 1
(1) (2) (3) (4)
Panel A. First exposure year
Study takeover 0.089 0.780 0.000 1.000
Other RSD takeover 0.072 0.032 0.087 —
Non-takeover RSD charter 0.331 0.154 0.316 —
RSD direct-run 0.508 0.034 0.597 —
N 2,027 531
Panel B. Second exposure year
Study takeover 0.206 0.714 0.000 1.000
Other RSD takeover 0.105 0.016 0.142 —
Non-takeover RSD charter 0.395 0.223 0.393 —
RSD direct-run 0.294 0.047 0.465 —
N 1,349 318
Panel C. Third exposure year
Study takeover 0.277 0.754 0.000 1.000
Other RSD takeover 0.112 0.031 0.218 —
Non-takeover RSD charter 0.450 0.188 0.517 —
RSD direct-run 0.161 0.026 0.265 —
N 795 191
Panel D. Fourth exposure year
Study takeover 0.316 0.646 0.000 1.000
Other RSD takeover 0.167 0.051 0.030 —
Non-takeover RSD charter 0.485 0.291 0.864 —
RSD direct-run 0.032 0.013 0.106 —
N 342 79
Notes: Columns 1 and 2 contrast the school sector distribution for grandfathering eligible ( Z = 1 ) and ineligible ( Z = 0 ) students; columns 3 and 4 show the same for grandfathering compliers. The category labeled “other RSD takeover” includes charter-to-charter conversions, principal-led conversions, and mergers. Non-takeover RSD charters include startup charters created since the 2008–2009 academic year, and charters operating as of 2007–2008.
when D = 0 and D = 1 ). Column 3 of Table 4 reports estimates of E [ W 0 | D 1 > D 0 ] , the distribution of school types among compliers when they don’t enroll in a take-over.19 By definition, treated compliers enroll in a takeover school when they’re grandfathering-eligible; column 4 in the table is included as a reminder of this fact.
The grandfathering first stage contrasts a 78 percent first-year takeover enroll-ment rate for those grandfathered (reported in column 2 of Table 4) with a 9 percent comparison group enrollment rate (reported in column 1). The first-year increase in study takeover enrollment reflects a substantial reduction in attendance at non-takeover charters (compare 0.33 with 0.15) and, especially, a sharp reduction in attendance at direct-run schools (compare 0.51 with 0.03). The counterfactual attendance distribution in column 3 shows that 32 percent of untreated compliers enrolled initially in a non-takeover charter school, while 60 percent attended a direct-run school.
Not surprisingly, both the takeover first stage and the proportion of the non-grandfathered comparison group enrolled in direct-run schools shrank over our sample period. The (study) takeover first stage in the third year of potential takeover exposure was around 0.48 (0.754–0.277), while the counterfactual direct-run enroll-ment share for compliers fell to about 0.27. The remainder of third-year non-treated complier enrollment was in other RSD charter schools. Reflecting RSDs accelerat-ing charter transformation, the other-charter enrollment rate for compliers exceeded 86 percent after four years of exposure.
The growing share of the RSD comparison sample enrolled in charter schools dilutes estimated takeover effects if other charter schools generate similar achieve-ment gains. This observation motivates a 2SLS model with two endogenous variables, one tracking attendance at study charters and one tracking attendance at other charters. Our model with two charter treatments is
(5) Y itg − Y il = α′ X it +
∑
j κ j d ij + β D D it + β C C it + η it ,
where C it counts the number of years of attendance in charters other than those cov-ered by D it . Equation (5) is identified here by the addition of interactions between the grandfathering instrument and covariates to the instrument list (specifically, 22 inter-actions with dummies for baseline year, baseline grade, and special education sta-tus/SPS bins). These interactions contribute to the first stage for C it because students with differing characteristics are more or less likely to wind up in non-takeover charters in the event they aren’t grandfathered. This multiple-instruments strategy therefore identifies β D and β C in a constant-effects framework.
As can be seen in the contrast between the estimated takeover effects reported in columns 1 and 2 of Table 5, removing other charters from the counterfactual outcome distribution increases the estimated takeover effect on math scores by 19 The counterfactual school type distribution is estimated using a weighting scheme
sim-ilar to that used to construct complier characteristics means in Table 2. The weights in this case are given by κ 0 = (1 − D)
E [Z | X] − Z
________________
E [Z | X] (1 − E | Z | X] ) . E[Z | X] is modeled using a probit specification that includes the same controls as were used for Table 3, as well as matching cell fixed effects. Abdulkadiro˘glu, Angrist, and Pathak (2014) sim-ilarly estimate the counterfactual school sector distribution for applicants to Boston and New York exam schools.
70 percent. Column 1 reports an over-identified estimate of the takeover effect anal-ogous to the just-identified estimates of takeover effects reported in Table 3, while column 2 reports 2SLS estimates of β D and β C . The takeover estimate for math in the latter specification rises to 0.36σ , while the other RSD charter effect is a less precisely estimated 0.34σ . These results are similar to the estimates of math effects for Boston charter lottery applicants reported in Abdulkadiro˘glu et al. (2011), and much larger than the observational estimates for New Orleans charters found by CREDO (2013c). At the same time, the other-charter ELA effect in column 2 is close to zero. Consequently, the takeover effect on ELA scores remains near 0.14 σ when estimated with or without a second endogenous variable.
Although motivated by a constant-effects model, 2SLS estimates of β D and β C in equation (5) have a LATE interpretation when treatment is Bernoulli and average causal effects are mean-independent of the stratification variables used to generate instruments (Hull 2015). It is therefore of interest to consider models identified with
Table 5—Grandfathering IV Estimates of RSD Charter Effects
(1) (2) (3) (4) (5) (6) Panel A. Math Takeover charter 0.210 0.358 0.344 (0.037) (0.079) (0.138) [72.3] [33.4] [194.9] Other RSD charter 0.342 0.308 (0.164) (0.376) [12.6] [27.4] Any RSD charter 0.366 0.359 0.385 (0.060) (0.095) (0.071) [41.7] [237.9] [223.4] No. of instruments 23 23 2 23 2 1 N 5,625 5,625 2,553 5,625 2,553 5,625 Panel B. ELA Takeover charter 0.141 0.154 0.205 (0.038) (0.077) (0.140) [71.4] [33.8] [192.8] Other RSD charter 0.031 0.022 (0.161) (0.363) [12.7] [27.1] Any RSD charter 0.214 0.281 0.257 (0.061) (0.098) (0.072) [43.0] [238.0] [228.0] No. of instruments 23 23 2 23 2 1 N 5,621 5,621 2,553 5,621 2,553 5,621
Notes: This table reports 2SLS estimates of the effects of enrollment in study takeovers and other RSD charters. The endogenous regressors count the number of years enrolled in RSD charters prior to testing. The grandfathering instrument is used to construct the estimates in col-umn 6. Colcol-umns 1, 2, and 4 report 2SLS estimates from models that add interactions between grandfathering eligibility and baseline special education/SPS bin cells, baseline year, and baseline grade to the instrument list. The estimates in columns 3 and 5 add only interactions with a dummy for baseline year after 2009 and limit the sample to the first outcome grade. All models control for the covariates used to construct the estimates in Table 3. Robust standard errors, clustered by student, are reported in parentheses. First-stage F-statistics are reported in brackets (in models with two endogenous variables, these are as described in Angrist and Pischke 2008).