UNIVERSITÉ DU QUÉBEC À MONTRÉAL
LINKING BIOGEOCHEMISTRY AND MICROBIAL ECOLOGY TO UNDERSTAND THE FATE OF METHANE IN LAKES AND HYDROPOWER
RESERVOIRS THESIS PRESENTED AS PARTIAL REQUIREMENT OF THE PHD IN BIOLOGY BY
PAULA CAMPOS JUNQUEIRA REIS
UNIVERSITÉ DU QUÉBEC À MONTRÉAL
COUPLER LA BIOGÉOCHIMIE À L'ÉCOLOGIE MICROBIENNE POUR COMPRENDRE LE SORT DU MÉTHANE DANS LES LACS ET LES
RÉSERVOIRS HYDROÉLECTRIQUES
THÈSE PRÉSENTÉE
COMME EXIGENCE PARTIELLE DU DOCTORAT EN BIOLOGIE
PAR
PAULA CAMPOS JUNQUEIRA REIS
UNIVERSITÉ DU QUÉBEC À MONTRÉAL Service des bibliothèques
Avertissement
La diffusion de cette thèse se fait dans le respect des droits de son auteur, qui a signé le formulaire Autorisation de reproduire et de diffuser un travail de recherche de cycles supérieurs (SDU-522 – Rév.10-2015). Cette autorisation stipule que «conformément à l’article 11 du Règlement no 8 des études de cycles supérieurs, [l’auteur] concède à l’Université du Québec à Montréal une licence non exclusive d’utilisation et de publication de la totalité ou d’une partie importante de [son] travail de recherche pour des fins pédagogiques et non commerciales. Plus précisément, [l’auteur] autorise l’Université du Québec à Montréal à reproduire, diffuser, prêter, distribuer ou vendre des copies de [son] travail de recherche à des fins non commerciales sur quelque support que ce soit, y compris l’Internet. Cette licence et cette autorisation n’entraînent pas une renonciation de [la] part [de l’auteur] à [ses] droits moraux ni à [ses] droits de propriété intellectuelle. Sauf entente contraire, [l’auteur] conserve la liberté de diffuser et de commercialiser ou non ce travail dont [il] possède un exemplaire.»
ACKNOWLEDGEMENTS
First, I am very thankful to my supervisor Yves Prairie for his guidance and scientific support. Thank you Yves for being available and always welcoming me to walk in your office at any time. I am also grateful to you for accepting my research ideas and for greatly upgrading them with modelling and other quantitative approaches. You are a remarkable scientist and I have learned a lot from your way of thinking and doing science. Merci, Yves!
I am thankful to all funding agencies that have supported me or this project throughout these years. Thanks to the Fonds de recherche - Nature et technologies du Québec for the doctoral scholarship and for the opportunity to study in Québec. Thanks to the CREATE-NSERC ÉcoLac program for the financial support and enriching training activities. Also thanks to the Groupe de recherche interuniversitaire en limnologie (GRIL), the Natural Sciences and Engineering Research Council of Canada Discovery grants, and the UNESCO Chair in Global Environmental Change for the research funding given to Yves that made this project viable.
I am incredibly grateful to Clara Ruiz-González for the collaboration, support, and help throughout my PhD. Clarita, you have been a great mentor and friend, muchísimas gracias por todo!
Thanks to all the other collaborators, without whom this thesis would not be possible: Shoji Thottathil for the many discussions about methane, the field and lab time spent together, and fruitful collaborations; Cynthia Soued for the scientific exchange and shared field work in Malaysia; and Sophie Crevecoeur for all discussions throughout
these years and guidance in the molecular lab and bioinformatics. Also, thanks to Sarawak Energy and the Malaysian staff for the help with the logistics and in the field. Special thanks to Jenny Choo for helping also in the lab and for always being so kind.
I am grateful to Paul del Giorgio for his inputs and suggestions to improve my work throughout my PhD. Paul, I have learned a lot from you, and you have been a role model for me alongside Yves and Clara throughout these years. Also, thanks for always including me in the microbial activities that your lab is involved in – these were extremely important parts of my training.
I am very thankful to the committee, Trista Vick-Majors, Hans Peter Grossart and Paul del Giorgio for taking the time to read and provide insightful feedback on my work. Thank you also for the thoughtful discussions during the defense, it was a great experience.
Thanks to all colleagues and friends in Montréal that helped me scientifically and/or emotionally during these years. It has been a great pleasure to spend these years in such lively and diverse group. Special thanks to Jihyeon Kim, Naíla Barbosa, Masumi Stadler, Michaela Melo, Marie Gérardin, Mathilde Couturier, Sophie Crevecoeur, Cynthia Soued, Sofia Baliña, Teresa Aguirrezabala, Facundo Smufer, Mario Muscarella, Maximilian Lau, Pedro Barbosa, Martin Demers, Yudhistir Reddy, Amir Shahabinia, Tristy Vick-Majors, Tonya DelSontro, Ryan Hutchins and Juan Pablo Niño-García. Thank you all for the support and unforgettable moments spent together. Thanks also to all ICM-CSIC friends, especially Marta Sebastián, Eli Alacid, and Fran Cornejo, who, along with Clara, made the CARD-FISH analyses in Barcelona a great scientific and personal experience. Los echo de menos!
I am extremely grateful to my family and friends in Brazil for supporting my decision to study abroad and for always celebrating and enjoying together when I went to visit.
These visits were extremely recharging and crucial to keep me going for these five years abroad. Imensurável o meu amor por vocês!
Finally, thanks to Felipe for the scientific discussions, daily support, and for making the whole process much smoother simply by being by my side. I am very grateful for our encounter. Te amo!
DEDICATION
I dedicate this work to my nephew Mateus, whom I love so much and look forward to meeting in person. Te amo, Tequinho!
TABLE OF CONTENTS
DEDICATION ... vi
LIST OF FIGURES ... xi
LIST OF TABLES ... xviii
RÉSUMÉ ... xix
ABSTRACT ... xxi
INTRODUCTION ... 1
0.1 Context ... 1
0.1.1 The CH4 cycle and the role of CH4 oxidation in lakes and hydropower reservoirs ... 1
0.1.2 Significance of aerobic and anaerobic CH4 oxidation in freshwaters ... 3
0.1.3 Phylogenetic and metabolic diversity of methanotrophs ... 4
0.1.4 Metabolic and ecological diversity within Proteobacterial MOB ... 6
0.1.5 Regulation of aerobic CH4 oxidation rates in lakes ... 8
0.1.6 Hydrologic connectivity of microbial communities and the effect of the damming of rivers ... 10
0.1.7 The role of methanotrophy in lake carbon cycling ... 11
0.2 Thesis objectives ... 12
0.3 General approach ... 14
CHAPTER I NICHE SEPARATION WITHIN AEROBIC METHANOTROPHIC BACTERIA ACROSS LAKES AND ITS LINKS TO METHANE OXIDATION RATES ... 16
1.1 Abstract ... 17
1.2 Introduction... 17
1.3.1 Study lakes and sampling ... 20
1.3.2 Nutrients, chlorophyll-a, and organic carbon concentrations ... 21
1.3.3 CH4 oxidation rates ... 22
1.3.4 Alpha- and Gamma-MOB cell enumeration by CARD-FISH ... 23
1.3.5 Statistical Methods ... 24
1.4 Results ... 24
1.4.1 Vertical variations in temperature, O2, CH4, and MOB community ... 24
1.4.2 CH4 oxidation rates and MOB dynamics during incubations ... 28
1.4.3 Drivers of the abundance of MOB groups ... 29
1.4.4 Relationship between MOB groups and CH4 oxidation rates ... 31
1.4.5 Contribution of MOB to the prediction of CH4 oxidation rate ... 33
1.5 Discussion ... 34
1.5.1 Niche separation of MOB groups in lakes is mostly driven by O2 ... 35
1.5.2 Both MOB groups contribute to overall CH4 oxidation, but Gamma-MOB dominate methanotrophy in lakes ... 37
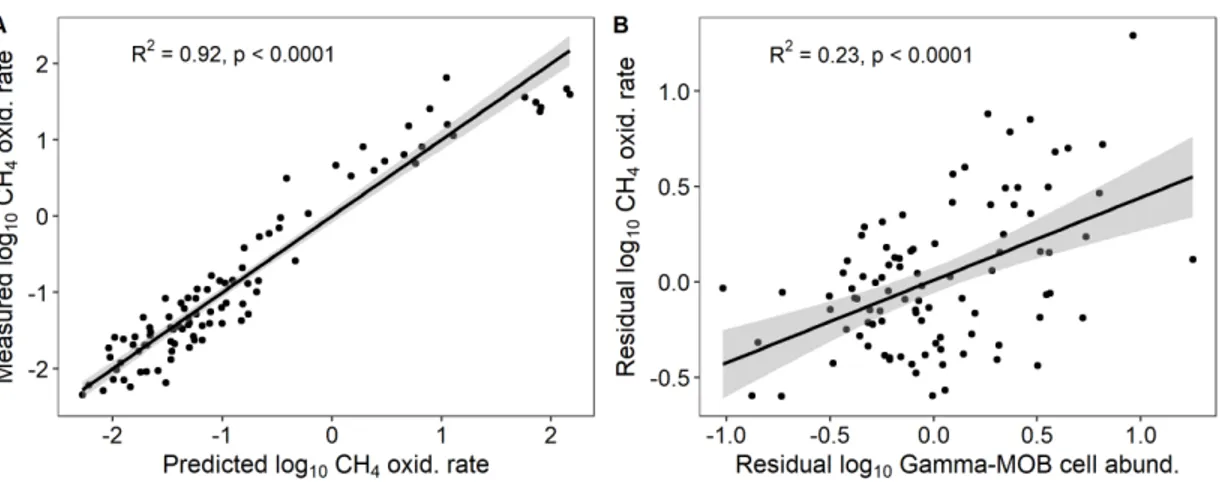
1.5.3 The addition of Gamma-MOB cell abundance improves models of CH4 oxidation rate ... 39
1.6 Conclusions ... 40
1.7 Acknowledgements... 41
1.8 Supplementary information ... 42
CHAPTER II RAPID SHIFTS IN METHANOTROPHIC BACTERIAL COMMUNITIES MITIGATE METHANE EMISSIONS FROM A TROPICAL HYDROPOWER RESERVOIR AND ITS DOWNSTREAM RIVER ... 49
2.1 Abstract ... 50
2.2 Introduction... 50
2.3 Methods ... 53
2.3.1 Study site and sampling ... 53
2.3.2 CH4 concentration, stable isotopic signature, and downstream CH4 oxidation ... 55
2.3.3 MOB community composition ... 56
2.3.4 Cell abundance of Proteobacterial MOB groups ... 58
2.3.5 Statistical analyses ... 59
2.4 Results ... 59
2.4.1 CH4, δ13CH4, and O2 dynamics ... 59
2.4.2 Relative abundance of MOB in DNA and RNA samples and abundance of MOB cells ... 60
2.4.3 MOB diversity ... 64
2.4.4 Dynamics of major MOB groups along the river-reservoir system ... 65
2.4.5 Environmental drivers and connectivity of MOB communities ... 67
2.4.6 CH4 oxidation and MOB cells dynamics in downstream waters ... 70
2.5 Discussion ... 72
2.5.1 High total MOB DNA and RNA sequences in Batang Ai reservoir ... 73
2.5.2 Hydrologic connectivity of MOB communities along the system ... 74
2.5.3 Rapid MOB growth in the downstream river ... 75
2.5.4 The importance of combining microscopy and sequencing data for the study of MOB communities ... 77
2.6 Conclusion ... 77
2.7 Acknowledgements... 78
2.8 Supplementary Information ... 79
CHAPTER III MICROBIAL METABOLISM AND LAKE CHARACTERISTICS DETERMINE THE RELATIVE IMPORTANCE OF METHANOTROPHY TO WHOLE-LAKE BACTERIAL CARBON CYCLING ... 88
3.1 Abstract ... 89
3.2 Introduction... 89
3.3 Methods ... 91
3.3.1 Study sites and sampling ... 91
3.3.2 Methanotrophic C consumption rate ... 92
3.3.3 Heterotrophic C consumption rate ... 93
3.3.4 Methanotrophic and total bacterial cells counts, size, and biomass ... 93
3.3.5 C consumption per bacterial biomass ... 94
3.3.6 Whole-lake methanotrophy and heterotrophy during summer ... 95
3.4 Results ... 95
3.4.1 Cells abundance, size, and biomass ... 95
3.4.2 C consumption per biomass ... 97
3.4.3 C consumption by methanotrophy and heterotrophy in incubations ... 98
3.4.4 Relative importance of methanotrophy to whole-lake bacterial C consumption... 99
3.5 Discussion ... 102
3.5.1 Larger MOB cells indicate selective grazing ... 103
3.5.2 High MOB activity per biomass is linked to CH4 concentration and metabolic characteristics ... 103
3.5.4 The relative importance of methanotrophy to whole-lake bacterial C
processing is greater in well-stratified high-DOC lakes ... 105
3.6 Conclusion ... 107
3.7 Acknowledgements... 107
CONCLUSION ... 109
LIST OF FIGURES
Figure Page
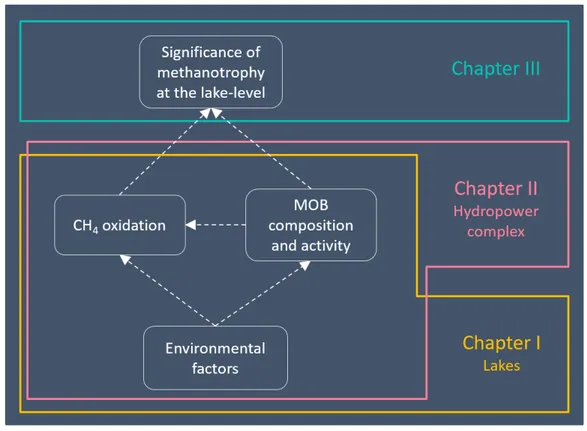
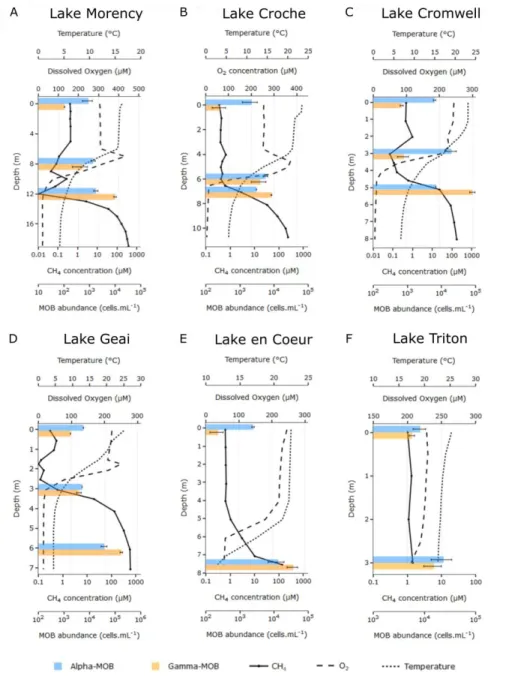
0.1. Conceptual diagram showing the structure of this thesis. ... 13 1.1. Vertical profiles of temperature, O2, CH4, and MOB cell abundance in the
water column of study lakes. Alpha-MOB (first horizontal bar, in blue) and Gamma-MOB (second horizontal bar, in orange) cell abundances were enumerated by CARD-FISH in duplicates or triplicates using specific probes. Note log scale in the axes of CH4 concentration and MOB cell abundance. Bars for MOB abundance indicate mean and whiskers indicate standard deviations. ... 26 1.2. Vertical differences between Alpha-MOB and Gamma-MOB cell
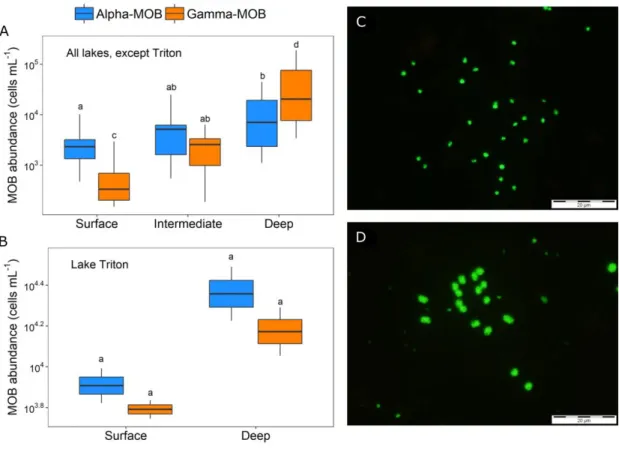
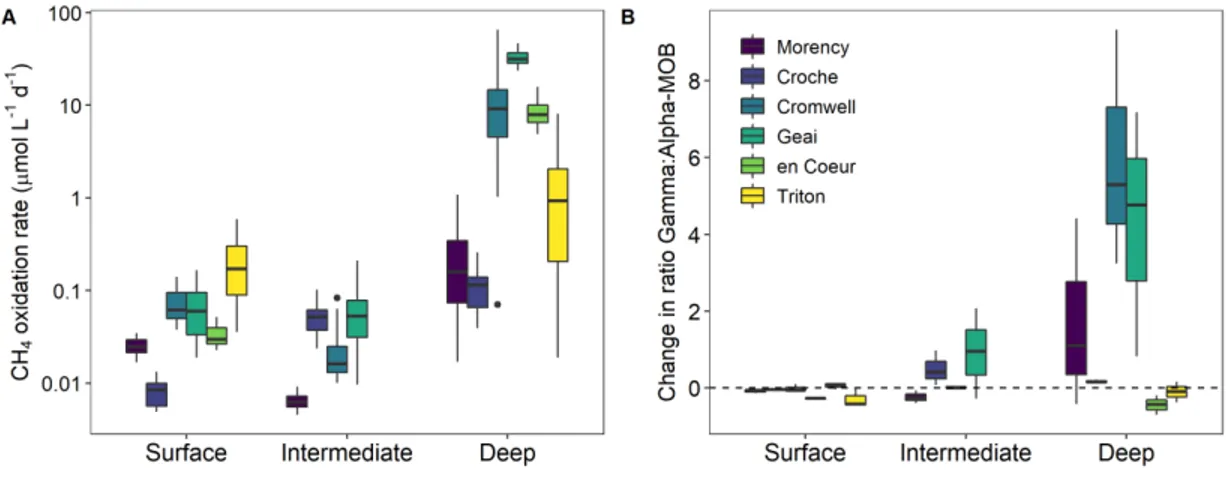
abundances across the water column of study lakes. Alpha-MOB (first, in blue) and Gamma-MOB (second, in orange) absolute cell abundance (cells mL−1) in situ in (A) stratified lakes (all, except Triton) (Alpha-MOB: N = 35; Gamma-(Alpha-MOB: N = 32) and in (B) Triton, the only lake with well-oxygenated deep waters (Alpha-MOB: N = 4; Gamma-MOB: N = 4). C) Alpha-MOB and D) Gamma-MOB cells under the microscope visualized by CARD-FISH. Boxplots represent median, first and third quartiles (hinges), and 1.5 x interquartile range (whiskers). Levels not connected by same letter have significantly different means (p < 0.05; paired t-tests were used to detect differences between MOB groups within depths, and ANOVA and Tukey–Kramer HSD were used to detect differences within MOB groups across depths). ‘Intermediate’ refers to the intermediate depths sampled in the four deeper lakes and ‘Deep’ refers to the deepest layer sampled in each lake (as shown in Fig. 1.1). Note log scale in the y axes of A and B. Whole scale bars in C and D represent 20 μm. ... 27 1.3. CH4 oxidation rates and MOB dynamics in incubations in each studied
oxidation rates B) Change in the ratio between the cell abundance of Gamma-MOB and Alpha-MOB at the end of incubations relative to in
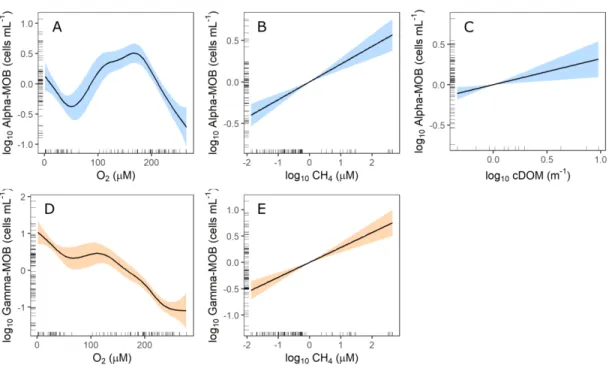
situ ratio (final ratio – in situ ratio). Plotted data include all CH4 oxidation rates and MOB cell abundances measured across incubations, pooling together incubations carried out at different temperatures. Boxplots represent median, first and third quartiles (hinges), and 1.5 x interquartile range (whiskers). Dashed line in B indicates no change in the Gamma:Alpha-MOB ratio. ‘Intermediate’ refers to the intermediate depths sampled in the four deeper lakes and ‘Deep’ refers to the deepest layer sampled in each lake (as shown in Fig. 1.1). ... 29 1.4. Partial effect plots (GAMs) of significant environmental predictors of each
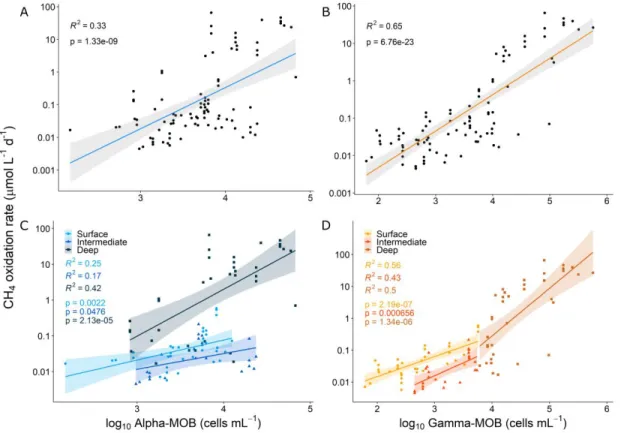
MOB group abundance (cells mL−1). Significant predictors of Alpha-MOB were (A) O2, (B) CH4, and (C) cDOM, and of Gamma-Alpha-MOB were (D) O2 and (E) CH4. Shaded areas mean 95% confidence intervals and marginal rug lines represent data distribution. ... 31 1.5. Relationship between MOB groups and CH4 oxidation rates in the water
column of studied lakes. A-B) Linear regressions between measured CH4 oxidation rates (y axes) and MOB cell abundances (x axes) across all lakes and C-D) distinguishing between water column layers (circles: surface, triangles: intermediate, and squares: deep). Plotted data include samples from the six studied lakes. Note log-scale in y axes. ... 32 1.6. Effect of the addition of Gamma-MOB cell abundance to environmental
model predicting CH4 oxidation rate. A) Measured by predicted plot of the model of CH4 oxidation rate using environmental variables and Gamma-MOB cell abundance as predictors. B) Linear regression between the residuals of the model of Gamma-MOB cell abundance using temperature, CH4 concentration and square of O2 concentration as predictors and the residuals of the environmental model of CH4 oxidation rates. ... 34 S 1.1. Alpha- (first, in blue) and Gamma-MOB (second, in orange) cell
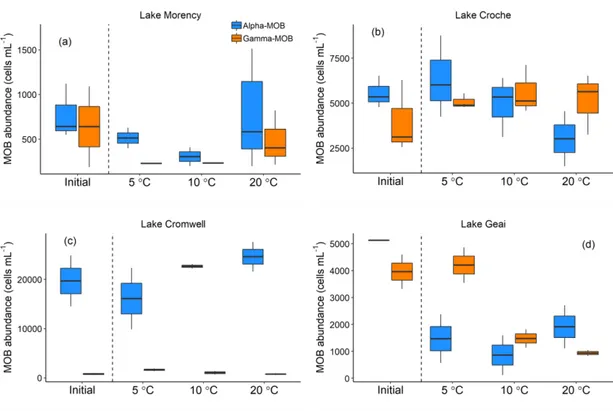
abundance (cells mL-1) measured before ('initial') and after experimental incubations with surface waters at different incubation temperatures. (a) Lake Morency; (b) Lake Croche; (c) Lake Cromwell; (d) Lake Geai; (e) Lake en Coeur; (f) Lake Triton. Boxplots represent median, first and third quartiles (hinges), and 1.5 x interquartile range (whiskers). Intermediate temperature is the approx. in situ temperature (20 °C). ... 43
S 1.2. Alpha- (first, in blue) and Gamma-MOB (second, in orange) cell abundance (cells mL-1) measured before ('initial') and after experimental incubations with intermediate waters at different incubation temperatures. (a) Lake Morency; (b) Lake Croche; (c) Lake Cromwell; (d) Lake Geai. Boxplots represent median, first and third quartiles (hinges), and 1.5 x interquartile range (whiskers). Intermediate temperature is the approx. in
situ temperature (10 °C). ... 44
S 1.3. Alpha- (first, in blue) and Gamma-MOB (second, in orange) cell abundance (cells mL-1) measured before ('initial') and after experimental incubations with deep waters at different incubation temperatures. (a) Lake Morency; (b) Lake Croche; (c) Lake Cromwell; (d) Lake Geai; (e) Lake en Coeur; (f) Lake Triton. Boxplots represent median, first and third quartiles (hinges), and 1.5 x interquartile range (whiskers). Intermediate temperature is the approx. in situ temperature (10 °C for deep lakes (a, b, c, d) and or 20 °C for shallow lakes (e, f)). ... 45 S 1.4. Environmental model of CH4 oxidation rate predicted by temperature,
CH4, and square O2 concentrations (R2 = 0.90, n = 277, RMSE = 0.33, Generalized Regression, Adaptive Elastic Net, AICc validation). (a) Actual by predicted CH4 oxidation rates. (b) Prediction profilers of each predictor variable of the model showing their individual effects on CH4 oxidation rate (O2: p < 0.0001, temperature: p < 0.0001; CH4: p < 0.0001). ... 47 S 1.5. Relationship between in situ δ13C-CH4 and average Alpha-MOB (a) and
Gamma-MOB (b) cell abundance (cells mL-1) in the surface waters of studied lakes... 48 2.1. Map of Batang Ai hydropower reservoir (Borneo Island, Malaysia)
showing sampling locations of this study. Sites A, B, C, and I are located in the reservoir, with site I being the closest to the water intake for the turbines. Sites E, F, G, and H are located upstream of the reservoir. Site Dw-I is located at the power station right after the dam and Dw-II is located at 2.7 Km further downstream. One extra site at 0.6 Km downstream of the dam (not shown) was sampled for CH4 concentration and stable isotopic signature (see Fig. 2.6). Map created in ArcGIS 10.1. . 55 2.2. CH4, O2, and total methane-oxidizing bacteria (MOB) abundance along
the Batang Ai river-reservoir system. A) Dissolved CH4 concentration (n = 36). B) CH4 stable isotopic signature (n = 32). C) Dissolved O2
concentration (n = 34). D-E) Abundance of total MOB sequences relative to the total bacterial community (%) in terms of DNA (n = 37) and RNA (n = 37) sequences, respectively. F) Total MOB cell abundance determined by CARD-FISH (n = 20). MOB cells were not determined in the mixed layer of the reservoir since the abundance of MOB 16S rRNA sequences, when detected, was < 0.1% in this layer. Sampling locations are grouped as shown in Fig. 1 with ‘Res. Mix. Layer’, ‘Res. Oxic Hypo.’, and ‘Res. Hypoxic Hypo.’ denoting the surface mixed layer, the oxic layer of the hypolimnion (O2 > 2 mg L-1), and the hypoxic layer of the hypolimnion (O2 < 2 mg L-1) within the reservoir. Boxplots represent median, first and third quartiles (hinges), and 1.5 x interquartile range (whiskers). Diamonds denote means. Note log scale in y axes of A and F. 62 2.3. Vertical profiles of temperature, O2 concentration, CH4 concentration,
and CH4 stable isotopic signature measured in the main basin of the reservoir (site I) in 2018. Dashed red line: water temperature. Dashed blue line: dissolved O2 concentration. Purple dots and line: CH4 concentration. Green triangles and line: CH4 stable isotopic signature. Asterisks show depths where samples for DNA and RNA were taken in this profile. ... 63 2.4. Dynamics of major methane-oxidizing bacteria (MOB) groups from
upstream to downstream waters in the Batang Ai river-reservoir system. A) Absolute abundances of Alpha-MOB and Gamma-MOB cells determined by CARD-FISH (n = 20). Boxplots represent median, first and third quartiles (hinges), and 1.5 x interquartile range (whiskers). Diamonds denote means and stars denote significant difference (p<0.05, Welch’s unequal variances t-test) between average cell abundance of MOB groups within location. Note log scale in the y axis. Plotted data include both sampling campaigns. B) Relative abundance of DNA and RNA sequences belonging to major taxonomic MOB groups (sum of all MOB sequences in a sample = 1). Each bar represents a sample taken at a different campaign, site, and depth (n = 37). In the x axis, the letters indicate the site code as in Fig. 1, followed by two numbers indicating the sampling depth and the sampling campaign (2017 or 2018), respectively. Empty slots mean that MOB were not detected (Res. Mix. Layer) or that the sample was lost during rarefaction (n.a.; Res. Oxic Hypo. and Res. Hypoxic Hypo.). Res. Mix. Layer: reservoir’s mixed layer; Res. Oxic Hypo.: reservoir’s oxic hypolimnion; Res. Hypoxic Hypo.: reservoir’s hypoxic hypolimnion. ... 66
2.5. Dynamics of methane-oxidizing bacteria (MOB) communities along the river-reservoir system. A-B) Canonical Analysis of Principal Coordinates (CAP) based on Bray-Curtis distance of the DNA (p=0.001) and RNA (p=0.001) MOB community profiles, respectively. 32 samples that did not contain missing values were used in both DNA and RNA CAP analyses. C) Proportion of DNA and RNA MOB sequences associated to MOB ASVs categorized depending on the location of the river-reservoir system where they were first detected. Values are expressed as a fraction of the total MOB sequences for the different sampled sites and campaigns. Res. Mix. Layer: reservoir’s mixed layer; Res. Oxic Hypo.: reservoir’s oxic hypolimnion; Res. Hypoxic Hypo.: reservoir’s hypoxic hypolimnion; Turb. Intake: closest available sample to the turbine water intake (2017: site A, depth 20 m; 2018: site I, depth 24 m); Downs0km: Downstream site at the power station; Downs2.7km: Downstream site at 2.7 km further downstream. ... 69 2.6. CH4 oxidation and MOB cell dynamics along the sampled sites from the
turbines’ water intake (located in the hypolimnion of the reservoir) until 2.7 km downstream from the dam (the dam is indicated by the gray vertical bar). A) Dissolved CH4 concentration. B) CH4 stable isotopic signature. C) Cumulative fraction of CH4 oxidized (Fox) calculated from the concentration and isotopic signature of CH4 at each point using the turbine water intake as CH4 source. D) Cumulative amount of CH4 oxidized, calculated from Fox and CH4 concentration. E) Dissolved O2 concentration. F) Alpha- and Gamma-MOB cell abundances enumerated by CARD-FISH. The abundance of MOB cells entering the turbines was determined in the closest available sample to the turbine water intake (2017: site A, depth 20 m; 2018: site I, depth 24 m). ... 71
S 2.1. Correlation between methane-oxidizing bacteria (MOB) and δ13CH4 in Batang Ai river-reservoir system. A) Total MOB cells (determined by CARD-FISH). B) Total MOB DNA (% of total 16S rRNA gene sequences). C) Total MOB RNA (% of total 16S rRNA sequences). Plotted data does not include the reservoir mixed layer, since MOB cells count was not determined in this layer due to the very low MOB sequences abundance (<0.1%). Note log scale in the x axis of A. ... 81 S 2.2. Relative abundance (%) of sequences belonging to all
methane-oxidizing bacteria (MOB) genera detected across the dataset (sum of all MOB sequences in a sample = 1). Each bar represents a sample taken at a different campaign, site, and depth. In the x axis, the letters indicate the
site code as in Fig. 1, followed by two numbers indicating the sampling depth and the sampling campaign, respectively (2017 or 2018). Empty slots mean that no MOB was detected in the sample (Res. Mixed Layer) or that sample was lost during rarefication (Res. Oxic Hypo. and Res. Anoxic Hypo.). NA genus includes unclassified Methylomonaceae and Methylococcaceae (Gamma-MOB) ASVs. ... 82 S 2.3. Contribution of each methane-oxidizing bacteria (MOB) group detected
in this study to the total MOB 16S rRNA sequences across samples. Alpha: Alphaproteobacteria MOB; Gamma: Gammaproteobacteria MOB; NC10: candidate phyla NC10 MOB. Boxplots represent median, first and third quartiles (hinges), and 1.5 x interquartile range (whiskers). Diamonds denote means. ... 83 S 2.4. Correlation between CARD-FISH MOB cell counts (% of total DAPI
counts) and MOB 16S rRNA sequences (DNA and RNA) (% of total bacterial 16S rRNA sequences) across samples in Batang Ai reservoir. a-b) total Proteobacteria MOB (Alpha- and Gamma-MOB). c-d) Alphaproteobacteria MOB. e-f) Gammaproteobacteria MOB. ... 84 S 2.5. Correlation between MOB cells and amount of CH4 oxidized from the
intake of the turbines in the hypolimnion of the reservoir to the power station (0 km) and from 0 km to 2.7 km further downstream at both sampling campaigns. a) Alphaproteobacteria MOB cells. b) Gammaproteobacteria MOB cells. ... 85 S 2.6. Potentially dividing Alphaproteobacteria MOB cells in the downstream
river section between 0 and 2.7 Km downstream of the dam. Cells under the microscope visualized by CARD-FISH (catalyzed reporter fluorescent in situ hybridization) using specific probes. Whole scale bars represent 20 µm. ... 86 3.1. Difference in the cell abundance and size of methanotrophic (Alpha-MOB
and Gamma-MOB) and bulk bacteria (Other bact.) across incubations with water from different lakes and depths. A) Cell abundance. B) Cell size. C-D) Microscopic picture of Gamma-MOB cells visualized by CARD-FISH and corresponding picture of the same field of view showing all cells visualized by DAPI staining, respectively. E-F) Microscopic picture of Alpha-MOB cells visualized by CARD-FISH and corresponding picture of the same field of view showing all cells visualized by DAPI staining, respectively. White scale bars in C to F
represent 20 μm. Different letters in A and B indicate significant difference between means (p < 0.05, ANOVA and Tukey HSD). Note log scale in y axis of A... 96 3.2. Carbon (C) consumption per bacterial biomass across incubations. A) C
consumption per unit biomass in methane-oxidizing bacteria (MOB) and in heterotrophic bacteria (HB). Different letters indicate statistical difference (p < 0.05; t-test). B) Change in C consumption per MOB biomass along the gradient in CH4 concentration. Plotted trend line is a loess curve and shaded area around line indicates 95% confidence interval. Color of points show the O2 concentration. Note log scale of y axis in A and of y and x axes in B. ... 97 3.3. Methanotrophic and heterotrophic carbon (C) consumption rates measured
in incubations. A) Change in methanotrophy and heterotrophy total C consumption along the gradient in CH4:O2 molar ratio. Plotted trend lines are loess curves and shaded area around line indicates 95% confidence interval. B) Ratio between methanotrophy and heterotrophy C consumption (MCC and HCC, respectively) – calculated on the predicted values of the loess curves in A – along the gradient in CH4:O2 molar ratio. The dashed horizontal line indicates MCC = HCC and the dashed vertical line crosses the x axis at 0.2. Note log scale of both axes in A and B. ... 98 3.4. Contribution of heterotrophy (in rose) and methanotrophy (in green) to
whole-lake bacterial carbon consumption (volume weighted rates) during summer in each studied lake. Lakes are plotted in order of increasing proportion of water column volume with CH4:O2 molar ratio > 0.2. ... 100 3.5. Vertical profiles of CH4, O2, and temperature taken at the early, mid, and
late summer in 2015 in each studied lake. Shaded areas indicate the thickest layer of CH4:O2 molar ratio > 0.2 measured in that year. ... 101 3.6. Relationships between the mean fraction of C consumed by
methanotrophy over summer and lake characteristics in the studied lakes. A) Relationship with dissolved organic carbon concentration (DOC). B) Relationship with the attenuation coefficient of photosynthetically active radiation (Kd PAR). Lines indicate linear relationship between the percentage of C consumed by methanotrophy and DOC or Kd PAR in the well-stratified lakes only (i.e. excluding lakes Triton and en Coeur). ... 102
LIST OF TABLES
Table Page
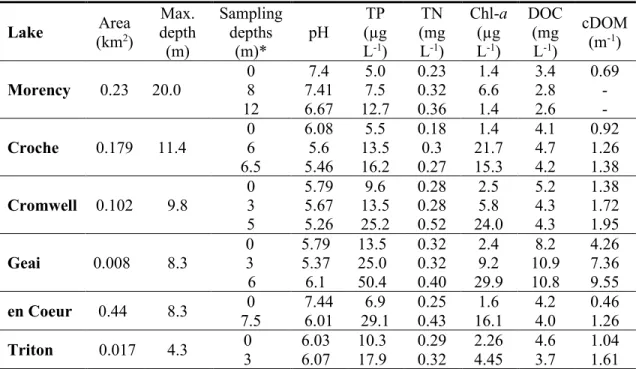
0.1. Taxonomic distribution of known methanotrophic bacterial taxa (Kalyuzhnaya et al., 2019 ; Knief, 2015). ... 6 1.1. General characteristics of study lakes. ... 22
S 1.1 Group specific 16S rRNA target probes used for the detection of Proteobacterial aerobic methanotrophic bacteria. Probes Mγ84 and Mγ705 were used together in order to cover the whole Gamma-MOB group and provide good hybridization signal. ... 42 S 1.2. Summary statistics for generalized additive models (GAM) predicting
Alpha-MOB and Gamma-MOB cell abundances (cells mL-1) based on environmental variables. Significant predictors for Alpha-MOB were O2 (µM), CH4 (µM), and cDOM (m-1), and for Gamma-MOB were O2 (µM) and CH4 (µM). CH4 and cDOM were used as linear terms whereas O2 was used as smoothed term. ... 46 S 2.1. Details of the samples for MOB community characterization analyzed in
this study. Site codes and location as shown in Fig. 1. ... 79 S 2.2. Group specific 16S rRNA targeted probes used for the detection of
Proteobacterial methane-oxidizing bacteria. Probes Mγ84 and Mγ705 were used together as suggested in Eller et al. (2001). ... 80
RÉSUMÉ
Le méthane (CH4) est un puissant gaz à effet de serre avec un potentiel de réchauffement 34 fois plus élevé que le dioxyde de carbone. Les lacs et les réservoirs d’eau douce sont des sources importantes de CH4 vers l’atmosphère, mais une large fraction du CH4 produit dans ces écosystèmes est oxydée par des bactéries oxydatives du méthane (BOM), et n’atteint jamais l’atmosphère. Malgré l’importance bien connue de l’oxydation du CH4 dans l’atténuation des émissions de CH4 vers l’atmosphère, beaucoup moins de connaissances existent quant à comment l’environnement et les traits de la communauté BOM interagissent pour déterminer le sort du CH4 dans les lacs et réservoirs. Pour aider à résoudre cette problématique, cette thèse étudie les liens entre l’environnement, les BOM (du niveau cellulaire à la communauté), et l’oxydation du CH4 dans les lacs et dans un complexe hydroélectrique.
Le chapitre I examine le couplage entre la structure de la communauté BOM et les taux d’oxydation du CH4 dans la colonne d’eau de six lacs tempérés d’eau douce. Les résultats montrent une séparation verticale de niche au sein de la communauté BOM, principalement modulée par la concentration en oxygène. Les approches de modélisation suggèrent que les facteurs environnementaux et la composition de la communauté BOM influencent tous les deux les taux estivaux d’oxydation du CH4 dans les lacs, avec un effet indépendant de l’abondance des BOM-Gamma.
Le chapitre II examine comment le CH4 et l’abondance, la composition, et l’activité de la communauté BOM changent dans l’eau d’amont en aval d’un complexe hydroélectrique tropical. Les changements de la communauté BOM le long du système rivière-réservoir reflètent un tri environnemental des taxons et une interruption de la connectivité hydrologique. Le pic de BOM se trouvait dans l’hypolimnion hypoxique dans le bassin principal du réservoir, où l’oxydation microbienne du CH4 déconnecte le CH4 en profondeur des émissions de CH4 vers l’atmosphère. L’oxydation du CH4 dans la rivière en aval était accompagnée d’un changement rapide de la communauté, avec une croissance préférentielle des BOM-Alpha, permettant la réduction des émissions de CH4 également dans les eaux en aval du barrage.
Le chapitre III montre que, bien que généralement présentes en faibles abondances dans les lacs, les cellules BOM, particulièrement au sein des BOM-Gamma, sont plus grandes et plus actives que le reste de la communauté bactérienne. À hauts ratios molaires CH4 : O2, les BOM ont un avantage écologique par rapport aux bactéries hétérotrophes, métabolisant une plus grande quantité totale de carbone. À l’échelle d’un lac, l’importance relative de la méthanotrophie dépend de la concentration en carbone organique dissout (COD) et de la morphométrie, à travers leurs effets sur la stratification et l’oxygénation de la colonne d’eau. Dans les lacs riches en COD, la méthanotrophie peut être le processus principal de transformation du carbone, remettant en question notre compréhension actuelle de la boucle microbienne.
Dans l’ensemble, les résultats des trois chapitres montrent que le sort du CH4 dans les lacs et complexes hydroélectriques dépend des caractéristiques environnementales et microbiennes. L’environnement contrôle les conditions de base pour que l’oxydation du CH4 se produise, et façonne aussi la composition, l’abondance, et l’activité des BOM, ce qui peut à son tour affecter le sort du CH4 dû à des différences intrinsèques de niche, de métabolisme, et de taille de cellule. Différents taxons de BOM peuvent être responsables de taux d’oxydation locaux dépendamment des conditions environnementales, et les caractéristiques métaboliques des BOM influencent l’importance de la méthanotrophie dans le cycle du carbone à l’échelle de l’écosystème et dans le potentiel du CH4 à supporter les réseaux trophiques dans les lacs.
ABSTRACT
Methane (CH4) is a potent greenhouse gas, with a global warming potential approximately 34 times greater than carbon dioxide. Lakes and freshwater reservoirs are important sources of CH4 to the atmosphere, but a large fraction of the CH4 produced in these ecosystems is oxidized by methane-oxidizing bacteria (MOB) and never evades to the atmosphere. Despite the well-known importance of CH4 oxidation in mitigating CH4 emissions to the atmosphere, much less is known about how environment and MOB microbial features interact to determine the fate of CH4 in lakes and reservoirs. To help overcome this problem, this thesis investigates the links between environment, MOB (from the community to the cell level), and CH4 oxidation in lakes and a hydropower complex.
Chapter I examines the coupling between MOB community structure and CH4 oxidation rates along the water column of six freshwater temperate lakes. The results show that there is a consistent vertical niche separation within the MOB community, mostly driven by the oxygen concentration. Modelling approaches suggested that both environmental factors and MOB community composition influence summer CH4 oxidation rates in lakes with an independent effect of Gamma-MOB abundance. Chapter II investigates how CH4 and MOB community abundance, composition, and activity change from upstream to downstream waters in a tropical hydropower complex. MOB community shifts along the river-reservoir system reflected environmental sorting of taxa and an interrupted hydrologic connectivity. MOB peaked in the hypoxic hypolimnion at the main basin of the reservoir, where microbial CH4 oxidation disconnected the deep CH4 from CH4 emissions to the atmosphere. CH4 oxidation in the downstream river was accompanied by a rapid community shift with preferential growth of Alpha-MOB, enabling mitigation of CH4 emissions also in waters below the dam.
Chapter III shows that despite generally present in low abundance in lakes, MOB cells, particularly within Gamma-MOB, are larger and more active than the bulk bacteria. At high CH4:O2 molar ratios, MOB have an ecological advantage over heterotrophic bacteria, processing a higher total amount of carbon. At the lake-level, the relative importance of methanotrophy depends on lake dissolved organic carbon
(DOC) concentration and morphometry, through their effects on the stratification and oxygenation of the water column. In DOC-rich lakes, methanotrophy can be the main process of bacterial carbon transformation, challenging our current understanding of the microbial loop in lakes.
Taken together, the results from the three chapters show that the fate of CH4 in lakes and hydropower complexes depends on both environmental and microbial characteristics. While the environment controls the basic conditions for CH4 oxidation to occur, it also shapes MOB composition, abundance, and activity which in turn can affect the fate of CH4 due to intrinsic differences in niches, metabolism, and cell size. Different MOB taxa may be responsible for local CH4 oxidation rates depending on the environmental conditions, and MOB metabolic characteristics influence the importance of methanotrophy to the ecosystem scale carbon cycling and potential CH4 support to food webs in lakes.
INTRODUCTION
0.1 Context
0.1.1 The CH4 cycle and the role of CH4 oxidation in lakes and hydropower reservoirs
Methane (CH4) is a potent greenhouse gas (GHG), with a global warming potential roughly 34 times greater than carbon dioxide (CO2) over a 100 years’ perspective (IPCC 2013). Despite the relatively small global area covered by freshwaters (about 3% of Earth’s land surface; Downing et al. 2006), these ecosystems are important environmental sources of CH4 to the atmosphere, emitting roughly 103 Tg of CH4 year−1 or 25% of the land GHG sink (Bastviken et al., 2011). Biogenic CH4 is mostly produced by methanogenic archaea during the final step of anaerobic organic matter degradation when inorganic oxidants such as sulfate, nitrate, or ferric iron are depleted (Conrad, 2005, 2009). In lakes, methanogenesis is the dominant degradation process in anoxic sediments and waters, making these environments hotspots of CH4 production (Bastviken et al., 2004 ; Conrad, 2009). In addition, CH4 can be produced in oxic waters contributing to the overall CH4 production and emission from lakes (Bogard et al., 2014 ; Donis et al., 2017 ; Grossart et al., 2011 ; Günthel et al., 2019). Different pathways for CH4 production in oxic waters have been proposed, including CH4 production in anoxic microhabitats such as in the gut of organisms (Oremland, 1979) or in sinking particles (Karl et Tilbrook, 1994), CH4 release during the cleavage of dissolved compounds by bacteria (Repeta et al., 2016 ; Yao et al., 2016), and CH4 production by algae (Lenhart et al., 2016) and cyanobacteria (Bižić et al., 2020) as a byproduct of photosynthesis.
Of the total CH4 produced within lakes, a substantial but variable portion is not emitted to the atmosphere as it is microbially oxidized into CO2 and microbial biomass (Bastviken et al., 2002, 2008 ; Conrad, 2009). For instance, in temperate lakes, the extent of CH4 oxidation can vary from negligible to near complete (Bastviken et al., 2008 ; Thottathil et al., 2018) and in the tropical permanently stratified Lake Kivu, between 51 and 89% of the upward flux of CH4 is oxidized across seasons (Morana et al., 2015). Similarly, during water column overturn, CH4 oxidation removes roughly 94% of the stored CH4 in Lake Nojiri (Japan) (Utsumi et al. 1998), 83-88% in a polyhumic boreal lake (Kankaala et al. 2007b), and 95-98% of the CH4 stored annually in Lake Rotsee (Zimmermann et al., 2019). Therefore, microbial CH4 oxidation may vary among systems and the physical structure of the water column, but certainly plays a central role in the regulation of CH4 emissions from freshwaters.
Likewise, in hydropower reservoirs, a large fraction of the CH4 produced can be microbially oxidized, strongly mitigating the carbon footprint of such impoundments. The damming of rivers often leads to increased CH4 production due to flooding of terrestrial organic carbon, increase in water residence time, and creation of anoxic conditions in the bottom of reservoirs (Tremblay et al., 2005).However, pelagic CH4 oxidation has been shown to reduce CH4 emissions by more than 85% in reservoir-river systems (Guérin et Abril, 2007). In addition to diffusive CH4 emissions at the surface of reservoirs, hydropower complexes can emit significant amounts of CH4 in the downstream river below the dam since the water intake for the turbines is often located in CH4-rich hypolimnia. Downstream CH4 emissions are particularly important in strongly stratified reservoirs, where stable conditions and slow gas exchange across the thermocline allows microbial CH4 oxidation of most of the upward CH4 flux (e.g. Borges et al. 2011; Itoh et al. 2015). Due to the drastic change in pressure from the hypolimnion to the river below the dam, most of he CH4 emitted downstream is released through degassing right after the turbines, while another
portion is emitted by diffusion at the surface of the downstream river (Guérin et al., 2006 ; Soued et Prairie, 2020). However, evidence from stable isotopes and mass balance has shown that microbial CH4 oxidation in downstream waters mitigate diffusive CH4 emissions below the dam, further reducing the carbon footprint of hydropower complexes (Abril et al., 2005 ; Guérin et Abril, 2007 ; Kemenes et al., 2007 ; Soued et Prairie, 2020).
0.1.2 Significance of aerobic and anaerobic CH4 oxidation in freshwaters
The microbial oxidation of CH4 consists of aerobic and anaerobic processes. While a fraction of the CH4 produced in lakes can be anaerobically oxidized within anoxic sediments or anoxic waters (e.g. Eller et al. 2005; Schubert et al. 2010, 2011), more often most CH4 is consumed aerobically by methane-oxidizing bacteria (MOB or methanotrophic bacteria) as it reaches the oxygenated sediments or water column (Carini et al., 2005 ; Frenzel et al., 1990 ; Pasche et al., 2011 ; Zigah et al., 2015). This efficient aerobic CH4 filter is clear from profiles in stratified water columns where CH4 concentration accumulates in the anoxic hypolimnia but drastically reduces (often 2-3 orders of magnitude) as it approaches the oxic-anoxic interface. These changes are followed by mirrored carbon stable isotopic signatures of CH4 (δ13CH4), which remain very negative and stable within the anoxic layer but quickly become less negative in the presence of oxygen (Morana et al., 2015 ; Schubert et al., 2010 ; Thottathil et al., 2018). Such enrichment in the δ13CH4 indicates the extent of CH4 oxidation since the methane monooxygenase enzyme (MMO), which oxidizes CH4 into methanol in the first step of aerobic CH4 oxidation, preferentially uptakes 12CH4, leaving the remaining CH4 pool enriched in 13CH4.
Differently from the oceans, in freshwaters, the significance of aerobic CH4 oxidation is often greater than that of the anaerobic process because freshwaters are generally depleted in sulfate which is the main electron acceptor in the anaerobic oxidation of CH4 (Bastviken, 2009 ; Conrad, 2007). However, recent evidence for CH4 oxidation
in the absence of oxygen by traditional aerobic methanotrophic bacteria has challenged the current knowledge on microbial processes and players in the oxidation of CH4 in freshwaters (Blees et al., 2014 ; Milucka et al., 2015 ; Oswald et al., 2015, 2016b, 2016a ; Rissanen et al., 2018). Different pathways have been proposed to explain the activity of aerobic methanotrophic bacteria in virtually anoxic conditions, which include cryptic photosynthetic oxygen production at the bottom of the oxycline (Oswald et al., 2015 ; Savvichev et al., 2019), use of alternative electron acceptors such as metal oxides (Oswald et al., 2016b) and the ability to perform anaerobic respiration by denitrification (Kits et al., 2015b ; Oswald et al., 2017 ; Skennerton et
al., 2015). Still, the relative importance of such pathways across lakes is unknown.
0.1.3 Phylogenetic and metabolic diversity of methanotrophs
Methanotrophs use CH4 as source of carbon and energy and can use O2 (aerobic) or other electron acceptors (anaerobic) to oxidize CH4. Anaerobic methanotrophs are archaea belonging to three clades (ANME-1, 2, and 3) related to the Orders Methanosarcinales and Methanomicrobiales (Borrel et al., 2011). They oxidize CH4 by performing ‘reversed’ methanogenesis in consortia with sulfate-reducing Deltaproteobacteria or using nitrate as electron acceptor without a bacterial partner (ANME-2d) (Timmers et al., 2017). Like methanogenic archaea, they posses the
mcrA (methyl coenzyme M reductase A) gene, which is also an essential and
diagnostic gene of methanogenesis (Hallam et al., 2003). In addition, anaerobic CH4 oxidation coupled to iron and manganese reduction by an uncultivated marine benthic group-D has been detected in marine seep sediments (Beal et al., 2009), but the process and identity of microbial players are still unclear.
In contrast, all known aerobic methanotrophs are bacteria. Methane-oxidizing bacteria (MOB or methanotrophic bacteria) are a subset of methylotrophs (i.e. aerobic bacteria that utilize one-C compounds more reduced than formic acids) (Hanson et Hanson, 1996). The presence of methane monooxygenase enzymes (MMO) encoded
by pmoCAB genes is a defining characteristic of MOB and confers to these bacteria the ability of oxidizing methane to methanol. MOB comprise a polyphyletic group of bacteria distributed in the Proteobacteria, Verrucomicrobia, and candidate NC10 phyla (Dunfield et al., 2007 ; Ettwig et al., 2010 ; Hanson et Hanson, 1996) (Table 0.1). MOB belonging to the NC10 candidate phylum (Ca. Methylomirabilis oxyfera) are a particular case, as they produce oxygen internally from nitrite to perform aerobic CH4 oxidation under anoxic conditions (Ettwig et al., 2010). Due to this unique metabolism of Ca. Methylomirabilis oxyfera and related taxa, these microorganisms are also classified as anaerobic methanotrophs in the literature. Although MOB comprise a relatively restricted group of taxa (approx. 60 cultivated species, but an unknown number of uncultivated species, Knief (2015)), they are widespread and ecologically diverse, are present in terrestrial and aquatic habitats and grow optimally in a wide range of temperature, pH, and salinity (Hanson et Hanson, 1996 ; Knief, 2015 ; Semrau et al., 2010 ; Trotsenko et Khmelenina, 2005).
The mechanisms behind the rise of methanotrophy in different prokaryotic clades is still under debate. Within the Proteobacteria, some studies support vertical descent based on phylogenetic congruence between 16S rRNA and pmoA sequence analyses (Knief, 2015 ; Stein et al., 2012), while others found evidence for an important role of horizontal gene transfer in the spread of methanotrophy (Khadka et al., 2018 ; Osborne et Haritos, 2018).
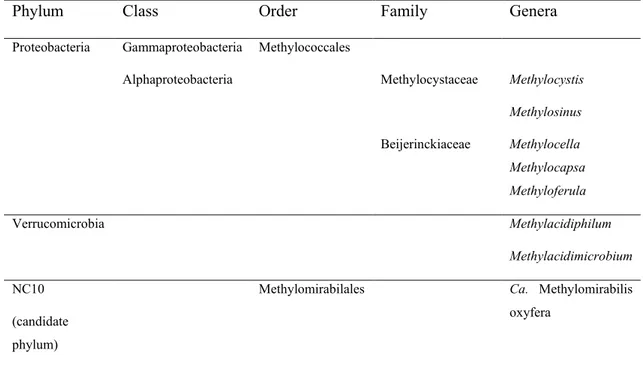
Table 0.1. Taxonomic distribution of known methanotrophic bacterial taxa (Kalyuzhnaya et al., 2019 ; Knief, 2015).
Phylum Class Order Family Genera
Proteobacteria Gammaproteobacteria Methylococcales
Alphaproteobacteria Methylocystaceae Methylocystis Methylosinus Beijerinckiaceae Methylocella Methylocapsa Methyloferula Verrucomicrobia Methylacidiphilum Methylacidimicrobium NC10 (candidate phylum)
Methylomirabilales Ca. Methylomirabilis oxyfera
0.1.4 Metabolic and ecological diversity within Proteobacterial MOB
Within Proteobacteria, methanotrophs are distributed in the classes Gammaproteobacteria (Gamma-MOB, also known as Type I and X MOB) and Alphaproteobacteria (Alpha-MOB, also known as Type II MOB; Hanson and Hanson 1996; Bowman 2006). In lakes, the Proteobacterial MOB taxa are commonly the most abundant and active methanotrophs (e.g. Blees et al., 2014b; Carini et al., 2005; Crevecoeur et al., 2015; Oswald et al., 2015) while Verrucomicrobia MOB are typically found in acidic environments such as volcanic soils and hot springs (Dunfield et al., 2007 ; Op den Camp et al., 2009 ; van Teeseling et al., 2014) and the general importance of NC10 in lakes is less known but has been demonstrated in lake
sediments and in a subtropical reservoir (Deutzmann et al., 2014 ; Kojima et al., 2014).
Gamma- and Alpha-MOB differ in their phylogenetic affiliation and in morphological, physiological, and metabolic traits (Hanson et Hanson, 1996 ; Knief, 2015 ; Semrau et al., 2010). Major morphological differences are the arrangement of internal membranes and major phospholipids fatty acids (PLFAs), with most Alpha-MOB showing signature PLFAs with 18 carbons, while signature PLFAs of Gamma-MOB have 16 carbons (Bodelier et al., 2009 ; Bowman et al., 1991). These signature PLFAs not only distinguish MOB types but are also MOB-specific, being useful markers of these organisms in the environment (Bodelier et al., 2009 ; Boschker et Middelburg, 2002). A distinctive feature between Gamma- and Alpha-MOB is their pathways for C assimilation (Knief 2015). The ribulose monophosphate (RuMP) pathway characteristic of Gamma-MOB has a higher C conversion efficiency than the serine pathway characteristic of Alpha-MOB. While the RuMP pathway produces a 3-C intermediate compound from formaldehyde (which is the central intermediate in anabolism and catabolism in methanotrophs), the serine pathway produces a 2-C compound from formaldehyde and additionally utilizes CO2 in a longer and less energetically efficient pathway (Hanson et Hanson, 1996 ; Trotsenko et Murrell, 2008). This metabolic difference suggests that Gamma-MOB and Alpha-MOB may show different growth rates in the environment and thus that microbial physiology may be an important factor to consider in lake CH4 cycling, as demonstrated for C cycling in soils (Allison et al., 2010 ; Wieder et al., 2013).
Ecophysiologically, Gamma- and Alpha-MOB seem to differ mainly regarding optimal temperatures and CH4, O2, and inorganic nitrogen concentrations, but the literature is often contradictory. Experiment-based studies have shown that Gamma-MOB outcompete Alpha-Gamma-MOB under relatively low CH4 concentrations, while Alpha-MOB is favored under higher CH4, lower O2, and higher temperatures (Amaral
et Knowles, 1995 ; Börjesson et al., 2004 ; Hanson et Hanson, 1996 ; He et al., 2012). However, Alpha-MOB strains have also been shown to be active at trace atmospheric levels of CH4 due to the possession of two pMMO isozymes with different CH4 oxidation kinetics (Baani et Liesack, 2008 ; Dunfield et al., 1999). Another physiological difference between Proteobacterial MOB groups is the ability of Alpha-MOB to fix nitrogen (N). Due to this ability, when N compounds are limiting, it is expected that Alpha-MOB dominates over Gamma-MOB (Hanson et Hanson, 1996). However, it has been shown that N-fixing genes may be present in many MOB taxa within Gammaproteobacteria as well (Heylen et al., 2016 ; Knief, 2015).
The diversity of traits within MOB has been related to different life strategies between MOB groups and to a selective advantage of taxa under different environmental conditions (Ho et al., 2013). This suggets that the taxonomic composition of MOB communities may change largely along environmental gradients and that such variations could translate into differences in CH4 oxidation rates within and across ecosystems. Similarly, due to metabolic differences, changes in the taxonomic composition of MOB communities may lead to variations in the fraction of the CH4-derived C that is assimilated into biomass and thus becomes available to higher trophic levels.
0.1.5 Regulation of aerobic CH4 oxidation rates in lakes
Aerobic methane oxidation (MOx) is a highly variable process among and within lakes (e.g. Utsumi et al. 1998; Bastviken et al. 2008; Blees et al. 2014a; Martinez-Cruz et al. 2015). Individual studies collectively indicate that a complex interaction of chemical, physical, and biological factors influence aerobic CH4 oxidation, and this complex regulation makes MOx rates highly variable both spatially and temporally. Besides the concentrations of substrates (CH4 and O2), light, inorganic nitrogen, phosphorus, and grazing have been shown to influence the abundance and activity of MOB in the environment (Devlin et al., 2015 ; Hanson et Hanson, 1996 ; Kankaala et
al., 2007a ; Lofton et al., 2014 ; Martinez-Cruz et al., 2015 ; Murase et Sugimoto,
2005 ; Oswald et al., 2015 ; Rudd et al., 1976 ; Semrau et al., 2010 ; Veraart et al., 2015). In experimental studies, CH4 concentrations seem to primarily regulate MOx rates (Lofton et al., 2014 ; Sundh et al., 2005), however, a direct effect of CH4 concentration on MOx or MOB activity is not always observed (Crevecoeur et al., 2017 ; Steinle et al., 2017). Highest methanotrophic activity and abundances in lakes are usually observed at low oxygen concentrations at oxic-anoxic interfaces (e.g. Lidstrom and Somers 1984; Kankaala et al. 2006; Schubert et al. 2010; Blees et al. 2014a). The mechanism behind the higher abundance and activity of MOB under low O2 concentrations is not clear, but it may be related to the fact that lower O2 concentrations are coincident with higher CH4 concentrations in the water column (Harrits et Hanson, 1980 ; Lidstrom et Somers, 1984), the ability to use electron acceptors other than O2 by some of these organisms (Kits et al., 2015b ; Oswald et
al., 2016a, 2017 ; Skennerton et al., 2015), or inhibition at high O2 concentrations (Thottathil et al., 2019). However, although at lower rates, CH4 oxidation also occurs under high O2 and low CH4 concentrations in shallower waters (Kankaala et al., 2006 ; Thottathil et al., 2019 ; Zigah et al., 2015).
Light has been shown to influence MOx in lakes in different ways. While some studies found evidence for light inhibition of MOB activity (Dumestre et al., 1999b ; Murase et Sugimoto, 2005 ; Thottathil et al., 2018), others found higher MOx rates under light conditions suggesting that MOx is coupled to light-dependent photosynthetic oxygen production at the bottom of the oxycline in lakes (Oswald et
al., 2015 ; Savvichev et al., 2019). Top-down control seems to be another important
factor regulating MOx rates as shown by microcosms and whole-lake experiments that grazing by protists and zooplankton can affect the amount of CH4 consumed by MOB (Devlin et al., 2015 ; Kankaala et al., 2007a).
Community composition may not influence metabolic responses in widely distributed metabolic processes such as heterotrophic bacterial production or respiration (Comte et del Giorgio, 2011), but a more direct link between taxonomic composition and metabolism may exist in highly specialized processes that are more narrowly distributed across taxa (Levine et al., 2011 ; Schimel, 1995). For instance, in soils, Levine et al. (2011) found that higher methanotrophic diversity is related to stability in CH4 consumption and suggested that conserving methanotroph diversity could help mitigate atmospheric CH4 concentrations. Judd et al. (2016) found that methanotrophic activity and community composition co-varied in grassland soils suggesting a strong potential for community composition effect on CH4 uptake. These studies indicate that microbial community structure may also influence MOx rates in lakes and freshwater reserovirs and may play a role in the complex regulation of CH4 oxidation at the ecosystem level.
0.1.6 Hydrologic connectivity of microbial communities and the effect of the damming of rivers
The importance of hydrologic connectivity in shaping the structure of freshwater bacterioplankton has been shown for whole communities (Niño-García et al., 2016 ; Ruiz-González et al., 2013, 2015a) and specifically for MOB assemblages across boreal lakes and rivers (Crevecoeur et al., 2019). The relative position in the aquatic network, hydrologic connections, and local water residence time are known to regulate the role of immigration and species sorting in the structure of aquatic bacterial communities (Lindström et al., 2005, 2006 ; Logue et Lindström, 2010 ; Read et al., 2015). Dams create a discontinuity in rivers that can cause large changes between upstream, reservoir, and downstream segments such as differences in local water residence time, physical structure of the water column, temperature, and many others that affect both connectivity of communities and species sorting. The changes caused by dams have been shown to alter the structure of inflowing river bacterioplankton communities (Dumestre et al., 2001; Ruiz-González et al., 2015b,
2013) and to rearrange them among water column layers due to thermal stratification within reservoirs (Dumestre et al., 1999a). This microbial shifts may be particularly important to methanotrophic taxa, given that the damming of rivers cause displacement of carbon processes over space and time with, for example, anoxia in and increased CH4 concentrations in reservoirs (Prairie et al., 2017 ; Tremblay et al., 2005). Such changes have the potential to trigger shifts in the total abundance of MOB taxa as well as the establishment of distinct MOB communities and associated activity between zones within hydropower complexes. Changes in MOB community size and structure may have important implications to the role of MOB taxa in mitigating CH4 emissions and thus the carbon footprint of hydropower impoundments.
0.1.7 The role of methanotrophy in lake carbon cycling
During CH4 oxidation, methanotrophs produce carbon dioxide (CO2) and bacterial biomass from CH4, being this the sole source of metabolic energy and structural carbon (C) to obligate methanotrophs (Hanson and Hanson 1996). Given that a substantial fraction of the CH4 produced in lakes is oxidized by MOB, methanotrophy is a potentially important pathway of C transformation and of biomass and CO2 production in lakes.
Indeed, Bastviken et al. (2003) showed that methanotrophy can represent a notable pathway of C incorporation into microbial biomass in boreal lakes, particularly during the winter when it corresponded from 3 to 120% of heterotrophic bacterial production. By assuming a MOB growth efficiency between 10 and 40%, Kankaala et al. (2013) estimated that MOB production can contribute to a major part of the total pelagic C mobilization in small humic lakes where high CH4 concentrations accumulate in the hypolimnion during summer. In the tropical meromictic Lake Kivu, Morana et al. (2015) determined that methanotrophic production was equivalent to 16-60% of average primary production and MOB contributed significantly to the microbial biomass at the oxycline. Collectively, these studies indicate that
methanotrophy is an important pathway of biomass production, comparable in some cases to the total C fixation by heterotrophic bacteria and primary production, and a substantial potential C source to consumers in lakes. In addition, there is widespread stable isotopic and biomarkers evidence of CH4-derived C incorporation into aquatic food webs (Grey, 2016 ; Jones et Grey, 2011 and references therein). However, the mechanisms controlling the relative importance of methanotrophy at the lake level are still to be determined.
Besides the factors controlling CH4 oxidation rates, the importance of methanotrophy at the lake level may depend also on metabolic features that may render ecological advantage of MOB relative to the bulk dissolved organic carbon (DOC)-consuming bacteria. These features include cell size and activity, turnover rates (rate of cell replacement), total biomass, and efficiency in producing cellular C from the CH4 consumed (i.e. MOB growth efficiency). Consequently, determining these characteristics of MOB at in situ conditions is crucial to understanding their biogeochemical and ecological roles in the environment.
0.2 Thesis objectives
The general objective of this thesis is to better understand how the fate of CH4 in lakes and hydropower reservoirs is influenced by the interplay between the environment and methanotrophic composition, activity, and metabolism. More specifically, the research presented here aims at assessing the ecological mechanisms influencing the oxidation of CH4 in lakes and hydropower complexes and the importance of methanotrophy at the lake level. This thesis is divided in three chapters (Figure 0.1) that address the following specific objectives:
Chapter I: assess the environmental drivers of the abundance of Proteobacterial MOB groups in lakes and determine how their abundances relate to CH4 oxidation rates along and across water columns.
Chapter II: determine how CH4 and MOB community abundance, composition, and activity change from upstream to downstream waters in a tropical hydropower complex and assess whether CH4 oxidation dynamics are accompanied by microbial shifts in this system.
Chapter III: determine the relative importance of methanotrophy to the total bacterial carbon cycling in lakes and identify the metabolic and environmental factors driving the importance of methanotrophy at the lake level.
0.3 General approach
To address the objectives outlined above, a combination of approaches that encompasses biogeochemical and microbial measurements was used. These include field sampling, laboratory incubations, carbon stable isotopic measurements, microscopic identification, enumeration and size determination of cells, DNA-RNA sequencing, and modelling.
In chapter I, CH4 oxidation rates were measured in laboratory incubations using unamended lake water from different depths of six temperate lakes located in the Laurentians region of Québec. The lakes were chosen to cover large environmental gradients in CH4, O2, DOC, size, maximum depth, and others. In situ and experimental Proteobacterial MOB composition and abundance were determined through microscopic cell identification and enumeration by catalyzed reporter deposition-fluorescent in situ hybridization (CARD-FISH). The absolute cell abundance of Proteobacterial MOB groups provided by CARD-FISH allowed the utilization of modelling approaches to assess the environmental drivers of MOB taxa and their individual role in the bulk CH4 oxidation rates.
In chapter II, MOB and CH4 dynamics were studied in the tropical hydropower complex Batang Ai (Borneo island, Malaysia). Two field campaigns were performed, in which samples from different locations from upstream to downstream waters and from different depths within the reservoir were taken for the determination of CH4 concentration and carbon stable isotopic signature, DNA-RNA sequencing, and CARD-FISH. The DNA-RNA sequencing provided a fine characterization (at the amplicon sequence variant-ASV level) of potentially active MOB assemblages and enabled the tracking of MOB taxa along the river-reservoir system. In contrast, the CARD-FISH allowed cell enumeration and the detection of rapid MOB cell growth that could not be inferred from the sequencing data.
Finally, in chapter III, laboratory incubations, microscopy, and lake profiles performed in the same lakes of chapter I in Québec were used to investigate the importance of methanotrophy as a pathway of carbon transformation in lakes. CARD-FISH and DAPI (4',6-diamidino-2-phenylindole) staining and microscopic visualization were used to measure heterotrophic and methanotrophic microbial cell abundance, size, and biomass. Rates of heterotrophic and methanotrophic metabolisms were determined in incubations and the importance of methanotrophy at the lake level was estimated based on lake profiles taken across the summer period and a model developed in a parallel study (Thottathil et al., 2019).
CHAPTER I
NICHE SEPARATION WITHIN AEROBIC METHANOTROPHIC BACTERIA ACROSS LAKES AND ITS LINKS TO METHANE OXIDATION
RATES
Paula C. J. Reis1, Shoji D. Thottathil1†, Clara Ruiz-González2 and Yves T. Prairie1
1Département des Sciences Biologiques, Groupe de Recherche Interuniversitaire en Limnologie, Université du Québec à Montréal, Montréal, QC, H2X 1Y4, Canada.
2Departament de Biologia Marina i Oceanografia, Institut de Ciències del Mar (ICM-CSIC), Barcelona, E-08003, Spain.
†Present address: Department of Environmental Science, SRM University AP, Amaravati, Andhra Pradesh 522 502, India.
Published in Environmental Microbiology (2020) DOI: 10.1111/1462-2920.14877
1.1 Abstract
Lake methane (CH4) emissions are largely controlled by aerobic methane-oxidizing bacteria (MOB) which mostly belong to the classes Alpha- and Gammaproteobacteria (Alpha- and Gamma-MOB). Despite the known metabolic and ecological differences between the two MOB groups, their main environmental drivers and their relative contribution to CH4 oxidation rates across lakes remain unknown. Here, we quantified the two MOB groups through CARD-FISH along the water column of six temperate lakes and during incubations in which we measured ambient CH4 oxidation rates. We found a clear niche separation of Alpha- and Gamma-MOB across lake water columns, which is mostly driven by oxygen concentration. Gamma-MOB appears to dominate methanotrophy throughout the water column, but Alpha-MOB may also be an important player particularly in well-oxygenated bottom waters. The inclusion of Gamma-MOB cell abundance improved environmental models of CH4 oxidation rate, explaining part of the variation that could not be explained by environmental factors alone. Altogether, our results show that MOB composition is linked to CH4 oxidation rates in lakes and that information on the MOB community can help predict CH4 oxidation rates and thus emissions from lakes.
1.2 Introduction
Freshwater lakes are disproportionally large sources of methane (CH4) – a highly potent greenhouse gas – to the atmosphere, emitting roughly 71.6 Tg CH4 per year despite their small global area (Bastviken et al., 2011 ; Downing et al., 2006 ; Kirschke et al., 2013). To a large extent, lake CH4 emissions are controlled by the activity of aerobic methane-oxidizing bacteria (MOB), which oxidize a substantial, but variable portion of the total CH4 produced before it is emitted (Bastviken et al., 2008 ; Morana et al., 2015 ; Thottathil et al., 2018 ; Utsumi et al., 1998). CH4
oxidation rates in lakes have been shown to vary widely depending on water column stratification (Kankaala et al., 2007b ; Morana et al., 2015), the ratio between area of deep and epilimnetic sediments (Bastviken et al., 2008), light (Dumestre et al., 1999; Murase and Sugimoto, 2005; Oswald et al., 2015), and dissolved organic carbon (DOC) concentration (Thottathil et al., 2018), all of which affect the availability of substrates (CH4 and oxygen, O2) or other putative drivers of MOB abundance and activity. However, it remains unknown how these drivers affect the different MOB groups or how MOB community composition is related to CH4 oxidation rates across lakes.
Lake methanotrophic bacteria are mostly distributed between the classes Alphaproteobacteria (also known as Type II, hereafter Alpha-MOB) and Gammaproteobacteria (also known as Type I, hereafter Gamma-MOB) (Bowman, 2006 ; Hanson et Hanson, 1996). Alpha- and Gamma-MOB are known to differ in many metabolic and ecological traits (Hanson et Hanson, 1996 ; Knief, 2015 ; Semrau et al., 2010), such as different carbon conversion efficiencies of the C1 assimilation pathways (Kalyuzhnaya et al., 2015 ; Trotsenko et Murrell, 2008), the possession of two particulate methane monooxygenases (pMMOs) isozymes within Alpha-MOB (Baani et Liesack, 2008), the ability of Gamma-MOB to oxidize CH4 in virtually anoxic environments (Blees et al., 2014 ; Oswald et al., 2016b ; Rissanen et
al., 2018), and different life strategies (Ho et al., 2013). Yet, the environmental
factors that drive the abundance and activity of each MOB group remain poorly constrained, limiting our understanding on the relative role of these microorganisms in the oxidation of CH4 under natural conditions. For example, some studies have detected the presence or activity of MOB groups under highly variable CH4 and O2 levels (Amaral et Knowles, 1995 ; Biderre-Petit et al., 2011 ; Crevecoeur et al., 2015 ; Graef et al., 2011 ; Zigah et al., 2015), while others have found a strong temperature effect on MOB composition (Börjesson et al., 2004 ; He et al., 2012 ; Knoblauch et