O
pen
A
rchive
T
OULOUSE
A
rchive
O
uverte (
OATAO
)
OATAO is an open access repository that collects the work of Toulouse researchers and makes it freely available over the web where possible.
This is an author-deposited version published in : http://oatao.univ-toulouse.fr/
Eprints ID : 9231
To cite this version : Ansart, Renaud and Hemati, Mehrdji and Neau,
Hervé and Simonin, Olivier 3D numerical simulation of Circulating Fluidized Bed: comparison between theoretical results and
experimental measurements of hydrodynamic. (2013) In: Fluidization Congress XIV From Fundamentals to Products , 26-31 May 2013, Noordwijkerhout, The Netherlands
Any correspondance concerning this service should be sent to the repository administrator: [email protected]
3D numerical simulation of Circulating Fluidized Bed:
comparison between theoretical results and experimental
measurements of hydrodynamic
Renaud Ansart13, Mehrdji Hemati13, Herv ´e Neau23, Olivier Simonin23
1 Universit ´e de Toulouse; INPT, UPS; LGC
4 All ´ee Emile Monso, BP 84234 31432 Toulouse Cedex 4, France,
2 Universit ´e de Toulouse; INPT, UPS; IMFT
2 All ´ee du Professeur Camille Soula, F-31400 Toulouse, France,
3 CNRS; F ´ed ´eration de Recherche FERMAT; F 31400 Toulouse, France
Abstract
This work was realized in the frame of the European GAYA project supported by ADEME. This paper presents a description of the hydrodynamic into a CFB according to experimental mea-surements of gas pressure and solid mass flux. These experimental data are compared to three dimensional numerical simulation with an Eulerian approach. The obtained numerical results show that the applied mathematical models are able to predict the complex gas-solid behavior in the CFB and highlight the large influence of the particle wall boundary condition. In-deed, it is shown that free slip wall boundary condition gives a good prediction a solid mass flux profile in comparison with experimental measurements nevertheless a convex shape. More-over, the numerical solid hold-up is underestimated compared to the experimental data. On the contrary, a no-slip boundary condition improves the profile shape of solid mass flux but highly overestimates its intensity and the solid hold-up. A compromise appears to be a friction particle-wall boundary condition such as Johnson and Jackson (1) but the model parameters have to be chosen very carefully especially the restitution coefficient.
INTRODUCTION
Circulating fluidized beds are used in a wide range of industrial applications such as Fluidized Catalytic Cracking (FCC), Chemical Looping Combustion, and biomass gasi-fication. Since few years, the development of computational ability and Computational Fluid Dynamic (CFD) allows 3-dimensional realistic simulations of industrial configura-tions by using eulerian multi-fluid approach. In the application of CFD models, careful validation with experimental measurements is needed. Indeed, the several complex phenomena involved in industrial circulating fluidized bed, such as particle-turbulence interaction, particle-particle and particle-wall collisions or heat and mass transfer, and the large dimensions of industrial plants are challenging for numerical modeling. This study addresses the effects of particle wall boundary conditions in circulating fluidized bed. Benyahia et al. (2) pointed out different boundary conditions and showed that they significantly affect the predicted dilute gas/solid flow in pipe. Moreover according to comparisons with PEPT measurement in dense fluidized bed, Fede et al. (3) have shown that free slip wall boundary condition overestimates the downward mean parti-cle velocity in the near wall region and no-slip conditions improve this velocity profile.
MODELING OF THE GAS-SOLID TWO-PHASE FLOW
mod-eling approach for poly-dispersed fluid-particle flows implemented in NEPTUNE CFD software which is developed by IMFT (Institut de M ´ecanique des Fluides de Toulouse). This software is a multiphase flow code developed in the framework of the NEP-TUNE project, financially supported by CEA (Commissariat `a l’ ´Energie Atomique), EDF ( ´Electricit ´e de France), IRSN (Institut de Radioprotection et de S ˆuret ´e Nuc ´eaire) and AREVA-NP.
The multiphase eulerian approach is derived from a joint fluid-particle Probability Den-sity Function equation allowing to derive transport equations for the particle velocity’s moment. In the proposed modeling approach, transport equations (mass, momentum and fluctuating kinetic energy) are solved for each phase and coupled through inter-phase transfer terms. The momentum transfer between the inter-phases is modeled using the drag law of Wen & Yu limited by Ergun equation for the dense flows (4). The col-lisional particle stress tensor is derived in the frame of the kinetic theory of granular media (5). The fluid turbulence modeling is achieved by the two equations k ´ ε model extended to particle-laden flows (accounting for additional source terms due to the inter-phase interactions) (6). For the dispersed phase, a coupled transport equation system is solved on particle fluctuating kinetic energy and fluid-particle fluctuating co-variance (qp2´ qf p). The effect of the particle-particle contact force in the very dense
zone of the flow are taken into account in the particle stress tensor by the additional frictional stress tensor (7). In this paper, three kinds of wall particle boundary con-ditions were evaluated. The Johnson and Jackson (1) wall boundary concon-ditions are written: $ ’ ’ ’ ’ & ’ ’ ’ ’ % ˆ νp BUp,τ Bn ˙ wall “ ´ φπg0 2?3αmax p Up,τ c 2 3q 2 p ˆ Kp Bqp2 Bn ˙ wall “ φπg0 2?3αmax p Up,τ2 c 2 3q 2 p´ ? 3πg0`1 ´ e2w ˘ 4αmax p ˆ 2 3q 2 p ˙32 , (1)
where νp and Kpare the particle viscosity and diffusivity, Up,τ the wall tangential
com-ponent of particle velocity. The parameter φ is the specularity coefficient which varies from zero (smooth wall) to one (rough wall). The dissipation of solid turbulent kinetic energy by collisions with the wall is specified by the particle-wall restitution coefficient ew which ranges from 0 (deposition) to 1 (elastic bouncing). The particle fluctuating
kinetic energy flux exchanged with the wall has two contributions: a positive one which represents the production of agitation by wall roughness (through a energy redistribu-tion from the mean moredistribu-tion) and a second term of dissiparedistribu-tion due to inelastic bouncing. φ “ 0 corresponds to a smooth wall with inelastic rebound without friction. Different specularity coefficients φ were applied in the literature with high values (« 0.5) for dense fluidized bed (8), whereas low values (« 10´4) were recommended for
circulat-ing fluidized bed. Benyahia et al. (9) reported that the specularity coefficient strongly affected the core-annular flow in dilute gas-solid system: the higher specularity the lower is the concentration at the wall. Li and Benyahia (10) derived the specularity coefficient dependence on the particle-wall restitution and wall frictional coefficients and gave an analytical expression of φ for a flat, frictional surface with a low frictional coefficient. However as the authors explained, it is difficult to incorporate such a model into the boundary conditions for two-fluid model, as the individual collisional angle is not tracked. In this study, free slip wall boundary conditions are corresponding to φ “ 0 and ew “ 1 and no-slip conditions are corresponding to pUp,τqwall “ 0 and
´ Kp
Bq2p
Bn
¯
wall “ 0. The free slip and no-slip wall boundary conditions for solid phase
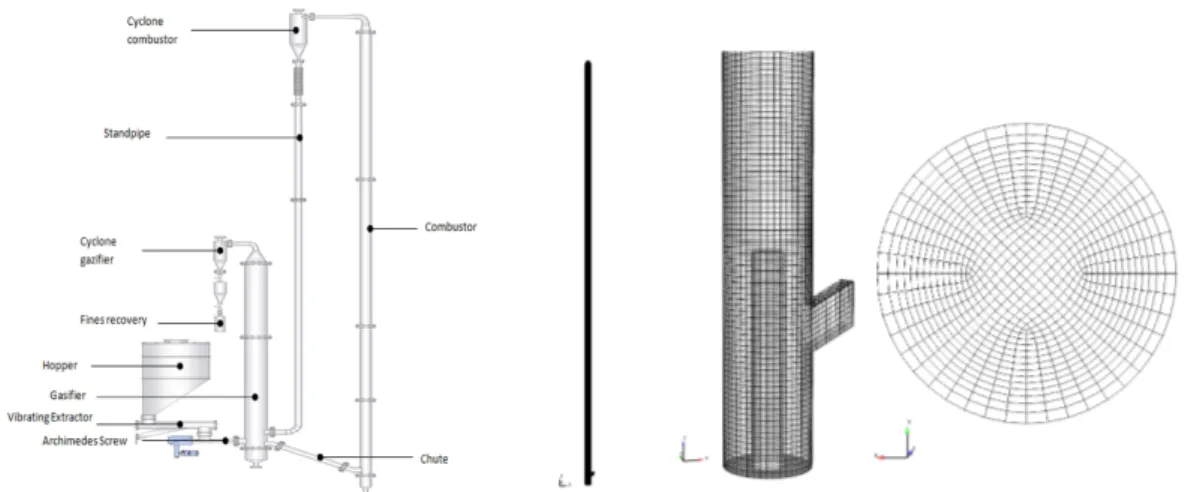
Figure 1: Overall design of FICFB pilot plant.
Figure 2: Mesh of circulating fluidized bed.
EXPERIMENTAL SETUP CONFIGURATION
The experimental setup is a cold Fast Internal Circulating Fluidized Bed Biomass Gasi-fier (FICFB) designed and built in the LGC (Laboratoire de Gnie Chimique). The basic concept of the FICFB gasifier is to separate the fluidized bed into two zones, a gasifi-cation zone and a combustion zone (Figure 1). Between these two zones, a circulating loop of Heat Carrier Particles (HCP) is created but the gases remain separated (11). The HCP, usually Sand or Olivine, influence the thermodynamic and hydrodynamic behavior of the system. During circulation, the HCP transfer the heat generated in the combustion zone to the gasification zone where the overall reaction process is endothermic and thus, influence the thermodynamic behavior of the system. The flu-idized HCP also has an important role to play in controlling the hydrodynamics of the system. Indeed, it is very difficult to fluidize the relatively large sized-biomass particles in the absence of the media particles. In this paper, we focus on the hydrodynamic of the HCP behavior into the combustion zone at ambient temperature. The geometry of the combustor is 10.4 cm diameter and 7 m high. A uniform gas inlet condition is considered at the fluidization grid. Particles are introduced through the L-valve with a diameter of 5.5 cm, placed 12.25 cm above the distributor and inclined with an angle of 300. 25 cm above the fluidization grid, a secondary inlet gas injection is set according
to a tube of 3.8 cm diameter to reach superficial gas velocity higher than the termi-nal settling velocity of the particles. Thus, a dense fluidized and a transported bed are generated respectively below and above this secondary gas injection. The parti-cle size distribution of the HCP (sand) partiparti-cles is d50 “ 378 µm, d32 “ 269 µm and
span “ 2.
Pressure probes spread along the riser, provide axial pressure profiles. An iso-kinetic sampling probe, based on Rhodes and Laussman (12), provides local upwards and downwards solid mass flux. Figure 3 illustrates the probe used. Two iso-kinetic probes of different diameters (4 mm and 8 mm) were tested to measure the solid mass flux. The integrated local solid flux over the riser cross-section measured with the 4 mm diameter probe are higher than the averaged solid fluxes obtained by measuring solid height in the standpipe when the particle transfer from the standpipe to the gazeifier is cut off. With the 8 mm diameter probe the integrated local solid flux is in a good
agreement with a averaged solid flux measured in the standpipe.
Figure 3: Suction iso-kinetic probe.
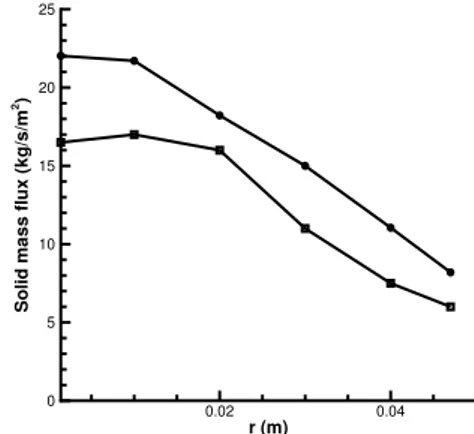
r (m) S o li d m a s s f lu x ( k g /s /m 2) 0.02 0.04 0 5 10 15 20 25
Figure 4: Solid mass flux measured by secondary inlet gas mass flow rate. (
‚
): Qg,II “ 126 kg ¨ h´1 (˝): Qg,II “108 kg ¨ h´1.
It is widely accepted that core-annulus structure is the typical structure existing in CFB risers: a dilute central solid region with high velocities for both fluid and solids and a high solids concentration near the walls. Salvaterra et al. (13) have shown that the profile of solid mass flux was parabolic and that flow distribution could be considered to be symmetrical. It can be observed from Figure 4 that the solid mass flux measured with 8 mm diameter probe follows a parabolic trend and the mean solid mass flux increases as the secondary gas flow rate rises. Moreover, this measurement technique gives reproducible results with an accuracy of 10 %.
NUMERICAL PARAMETERS
The 3D mesh is composed of 858,000 hexahedra, based on O-grid technique with approximately ∆r “ 2.5 mm and ∆z “ 6 mm (Figure 2). The numerical simulations
have been performed on parallel computers with 64 cores. The fluidization grid and the secondary inlet gas injection are an inlet for the gas with imposed gas mass flow rate. These same sections correspond to walls for particles. At the top of the column, a free outlet for both gas and particles is defined. The wall-type boundary condition is friction for the gas. The Table 1 summarized the phase properties and mass flow rate retained for the simulations. We have to underline that the particles are assumed to be spherical and monodispersed. A numerical simulation is divided into two step: a transitory step to reach a predicted total mass of particle constant in the column and an established regime during which the statistics are computed for 30 s. The time-averaged radial profiles will be presented by circumference averaging.
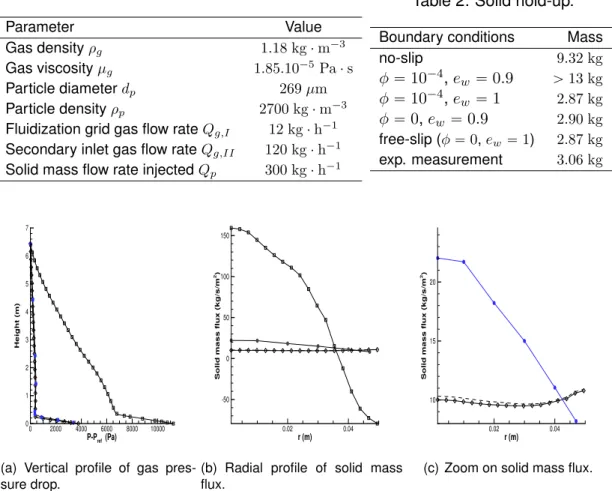
Table 1: Parameters for numerical simulations. Parameter Value Gas density ρg 1.18 kg ¨ m´3 Gas viscosity µg 1.85.10´5Pa ¨ s Particle diameter dp 269 µm Particle density ρp 2700 kg ¨ m´3
Fluidization grid gas flow rate Qg,I 12 kg ¨ h´1
Secondary inlet gas flow rate Qg,II 120 kg ¨ h´1
Solid mass flow rate injected Qp 300 kg ¨ h´1
Table 2: Solid hold-up.
Boundary conditions Mass
no-slip 9.32 kg φ “ 10´4, e w “ 0.9 ą 13 kg φ “ 10´4, e w “ 1 2.87 kg φ “ 0, ew“ 0.9 2.90 kg free-slip (φ “ 0, ew“ 1) 2.87 kg exp. measurement 3.06 kg P-Pref (Pa) H e ig h t ( m ) 0 2000 4000 6000 8000 10000 0 1 2 3 4 5 6 7
(a) Vertical profile of gas pres-sure drop. r (m) S o li d m a s s f lu x ( k g /s /m 2) 0.02 0.04 -50 0 50 100 150
(b) Radial profile of solid mass flux. r (m) S o li d m a s s f lu x ( k g /s /m 2) 0.02 0.04 10 15 20
(c) Zoom on solid mass flux.
Figure 5: Comparison between experimental measurement and time-averaged numer-ical results for the solid hold-up and the solid mass flux. (˝): no-slip; ( ): Johnson and Jackson φ “ 10´4, e
w “ 1; (♦): free-slip, (
‚
): experimental measurements.RESULTS
Table 2 shows the solid mass predicted according to the integration of the pressure profiles from Figure 5(a). We note that the riser solid loading is strongly dependent on the wall particle boundary condition. We found that the higher the friction, the higher the predicted solid mass. The no-slip condition largely overestimates the solid mass. For φ “ 10´4, the inelastic bouncing (e
w “ 0.9) provides a very high solid mass larger
than the one predicted by no-slip condition. As observed by He and Simonin (14), Sakiz and Simonin (15) for dilute particle-laden high velocity flow, the particle velocity fluctuation anisotropy is very important close to the wall and must be accounted for in the derivation of the wall boundary condition. As a matter of fact the particle kinetic energy dissipation effect is controlled by the wall-normal velocity fluctuation which can be much lower than the longitudinal one. Thus, the isotropic description of the inelastic bouncing through mean fluctuation may be not appropriated by leading to an overesti-mation of the fluctuating kinetic energy dissipation by the inelastic bouncing at the wall. Moreover, a slight increase of the predicted mass is observed for inelastic bouncing applied to φ “ 0. Consequently for high velocity transport flow as observed in CFB
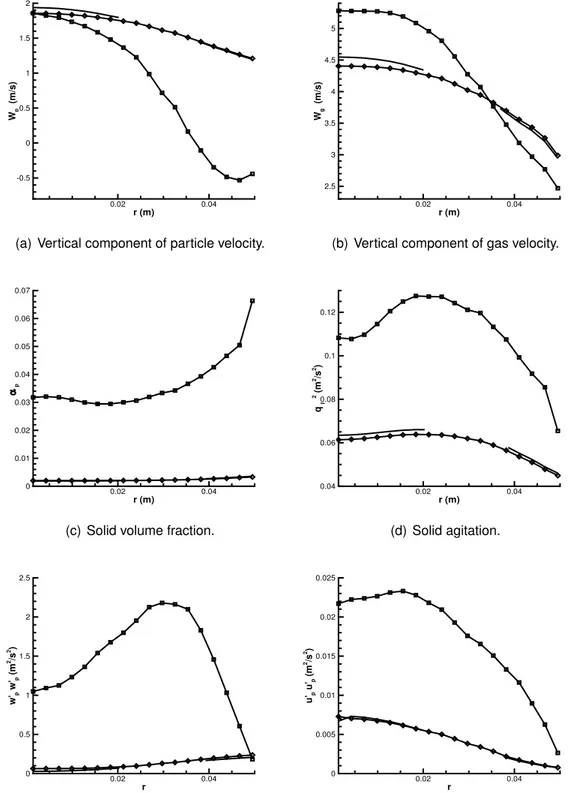
r (m) W p (m /s ) 0.02 0.04 -0.5 0 0.5 1 1.5 2
(a) Vertical component of particle velocity.
r (m) W g (m /s ) 0.02 0.04 2.5 3 3.5 4 4.5 5
(b) Vertical component of gas velocity.
r (m) p 0.02 0.04 0 0.01 0.02 0.03 0.04 0.05 0.06 0.07
(c) Solid volume fraction.
r (m) q p 2 ( m 2/s 2) 0.02 0.04 0.04 0.06 0.08 0.1 0.12 (d) Solid agitation. r w ’p w ’p ( m 2/s 2) 0.02 0.04 0 0.5 1 1.5 2 2.5
(e) Variance of vertical component of solid velocity.
r u ’p u ’p ( m 2/s 2) 0.02 0.04 0 0.005 0.01 0.015 0.02 0.025
(f) Variance of radial component of solid velocity.
Figure 6: Effect of different boundary conditions for the particle phase on the time-averaged flow variables radial profiles at z “ 4.9 m. (˝): no-slip; ( ): Johnson and Jackson φ “ 10´4, e
process, this description of inelastic bouncing looks not appropriated. In contrast, for the case assuming elastic bouncing (ew “ 1) and φ “ 10´4, which underestimates the
particle fluctuation wall dissipation effect, a much reasonable value of solid-hold-up is predicted.
Figures 5(b) and 5(c) present the predicted solid mass flux. Free slip wall condition provides profile close to experimental measurements despite a convex form. Indeed, the maximum of solid flux is observed near the wall. On the contrary, no-slip condition gives the good trend of the flux but largely overestimates its intensity. Moreover, we note a downward flow that is not observed in the experiments. For partial slip with, the solid mass flux presents a minimum at the center and a maximum at the wall without downward flow. Figure 6(a) presents the vertical component of solid velocity. The maximum, reached at the center, is almost the same for all the boundary conditions. An increase of particle-wall friction results in a reduction of solid velocity at the wall until negative value. This solid velocity reduction at the wall induces a gas velocity reduction, Figure 6(b). Thus, the gas velocity increases at the center with the increase of wall-particle friction. The time-averaged solid volume fraction (Figure 6(c)) presents the core-annulus structure with a high concentration near the wall. Both, the solid volume fraction and the concentration gradient near the wall increase with the wall-particle friction boundary condition. Figures 6(d), 6(e) and 6(f) show the predicted granular agitation and solid velocity fluctuations. We can note that an increase of particle-wall friction results in an increase of granular agitation.
CONCLUSION
In this paper, three dimensional numerical simulations of circulating fluidized bed with an Eulerian approach were realized and the effects of particle wall boundary condition were evaluated. The comparison between numerical results and experimental mea-surements of gas pressure and solid mass flux have shown the strong influence of the boundary conditions. Indeed, a particle free slip condition produces a relative good solid hold-up and solid mass flux slightly underestimated but without a parabolic trend. On the other side a no-slip condition predicts a parabolic trend of solid mass flux but with an intensity strongly overestimated and a downward flow close to the wall, that is not observed experimentally. A relative compromise seems to be a partial slip con-dition such as Johnson and Jackson wall boundary concon-dition. This concon-dition needs two entree parameters which have to be chosen properly. On the contrary to dense fluidized, where the value of this parameter has to be close to the unit, for a circulating fluidized bed the specularity coefficient must be very low (φ « 10´4) and the effective
restitution coefficient ew very close to 1. The development of wall particle boundary
conditions in dilute flow with high transport velocity is presently under way: bouncing of irregular particle on smooth wall (extension of Sakiz and Simonin’s work (14)) and bouncing on rough wall (15).
ACKNOWLEDGMENTS
This work was granted access to the HPC resources of CALMIP under the allocation 2013-P11032 and CINES under the allocation 2013-gct6938 made by GENCI.
REFERENCES
materials, with applications to plane shearing”, Jour. of Fluid Mech., 1987, 176, 67-93. 2. Benyahia, S.; Syamlal, M. and O’Brien, T. J. ”Evaluation of boundary conditions used to model dilute, turbulent gas/solids flows in a pipe”, Powder Technology, 2005, 156, 62 - 72.
3. Fede, P.; Moula, G.; Ingram, T. and Simonin, O. “3D numerical simulation and pept experimental investigation of pressurized gas-solid fluidized bed hydrodynamic”, Pro-ceedings of ASME 2009 Fluids Engineering Division Summer Meeting, 2009.
4. Gobin, A.; Neau, H.; Simonin, O.; Llinas, J.R.; Reiling, V. and S ´elo, J.L. “Fluid Dy-namic Numerical Simulation of a Gas Phase Polymerization Reactor”, Int. J. for Num. Methods in Fluids, 2003, 43, 1199-1220.
5. Bo ¨elle, A.; Balzer, G. and Simonin, O. ”Second-order prediction of the prediction of the particle-phase stress tensor of inelastic spheres in simple shear dense suspen-sions In Gas-Particle flows”, ASME FED, 1995, 9-18.
6. Vermorel, O., Bedat, B., Simonin, O., Poinsot, T. ”Numerical Study and Modelling of Turbulence Modulation in a Particle Laden Slab Flow”, Journal of Turbulence, 2003, Vol. 4, 025.
7. Srivastava, A. and Sundaresan, S. ”Analysis of a frictional-kinetic model for gas-particle flow”, Powder Technology, 2003, 129, 72-85
8. Li, T.; Grace, J. and Bi, X. ”Study of the wall boundary condition in numerical simu-lations of bubbling fluidized beds”, Powder Technology, 2010, 203, 447-457.
9. Benyahia, S.; Syamlal, M. and O’Brien, T. ”Study of the ability of multiphase contin-uum models to predict core-annulus flow”, AIChE, 2007, 53, N10, 2549-2568.
10. Li, T. and Benyahia, S. ”Revisiting Johnson and Jackson Boundary conditions for granular flows”, AIChE, 2012, 58, No. 7, 2058-2068.
11. Hofbauer, H.; Rauch, R.; Loeffler, G.; Kaiser, S.; Fercher, E. and Tremmel, H. ”Six years experience with the FICFB-Gasification Process”, 12th European conference and Technology exhibition on biomass for energy, Industry and Climate Protection, 2002.
12. Rhodes, M. and Laussman, A. ”A simple non-isokinetic sampling probe for dense suspension”, Powder Technology, 1992, 79, 141-151.
13. Slavaterra, A.; Geldart, D. and Ocone, R. ”Solid flux in a circulanting fluidized bed riser”, Chemical Engineering Research Design, 2005, 83, 24-29.
14. He, J., Simonin, O., ”Non-Equilibrium Prediction of the Particle-Phase Stress Ten-sor in Vertical Pneumatic Conveying”, in Gas-Solid Flows-1993, ASME FED, Vol. 166, pp 253-263.
15. Sakiz, M., Simonin, O. ”Development and Validation of Continuum Particle Wall Boundary Conditions Using Lagrangian Simulation of a Vertical Gas-Solid Channel Flow”, Proc. 8th Int. Symp. on Gas-Particle Flows, ASME Fluids Engineering Division Summer Meeting, FEDSM99-7898, 1999.
16. Konan, A., Kannengieser, O., Simonin, O., 2009, ”Stochastic Modeling of the Mul-tiple Rebound Effects for Particle - Rough Wall Collisions”, Int. J. of Multiphase Flow, Vol. 35, pp. 933-945.