WAITING TIMES, AGING,
CHRO
NIC
CONDITIONS AND
HEALTH
CARE COSTS:
TEACHINGS FROM
THE
LIFE-CYCLE MO
DEL
THESIS
PRESENTED AS A
PARTIAL
REQUIREMENT FOR THE
PH.D. IN
ECONOMICS
BY
ÉTIENNE GAUDETTE
UNIVERSITÉ DU QUÉBEC
À MONTRÉAL
Service des bibliothèquesAvertissement
La diffusion de cette thèse se fait dans le respect des droits de son auteur, qui a signé le formulaire Autorisation de reproduire et de diffuser un travail de recherche de cycles supérieurs (SDU-522 - Rév.01-2006). Cette autorisation stipule que «conformément
à
l'article 11 du Règlement no 8 des études de cycles supérieurs, [l'auteur] concèdeà
l'Université du Québecà
Montréal une licence non exclusive d'utilisation et de publication de la totalité ou d'une partie importante de (son] travail de recherche pour des fins pédagogiques et non commerciales. Plus précisément, [rauteur] autorise l'Université du Québec à Montréal à reproduire, diffuser, prêter, distribuer ou vendre des copies de [son] travail de rechercheà
des fins non commerciales sur quelque support que ce soit,y compris l'Internet. Cette licence et cette autorisation n'entraînent pas une
renonciation de [la] part [de l'auteur]à
[ses] droits moraux nià
[ses] droits de propriété intellectuelle. Sauf entente contraire, [l'auteur] conserve la liberté de diffuser et de commercialiser ou non ce travail dont [il] possède un exemplaire."-TEMPS D'ATTENTE, VIEILLISSEMENT, MALADIES CHRONIQUES ET
COÛTS DES SOINS
DE SANTÉ : ENSEI
GNEMENTS DU MODÈLE DE
CYCLE DE VIE
THÈSE
PRÉSE TÉE COMME
EXIGENCE PARTIELLE DU
DOCTORAT EN ÉCONOMIQUE
PAR
ÉTIENNE GAUDETTE
J'aimerais exprimer un grand merci à mes directeurs Stéphane Pallage et Alain Delacroix pour leur aide et leur support dans la rédaction de cette thèse. Stéphane, merci de m'avoir fait découvrir les méthodes utilisées dans mes recherches. Merci également pour ton ouverture d'esprit, ta curiosité et le plaisir de discuter avec toi au fil des ans. Alain, merci pour ta disponibilité, ton attention aux détails et les heures passées à réviser avec moi concepts et méthodologie. Nos rencontres ont beaucoup enrichi le résultat présenté aujourd'hui. Merci également à mes mentors officieux, Pierre-Carl Michaud et Raquel Fonseca, pour leur soutien et leurs précieux commentaires. Finalement, merci à Kimberly McCuaig et Sean Horan pour leurs révisions linguistiques.
REMERCIEMENTS LIST OF FIGURES LIST OF TABLES RÉSUMÉ . . ABSTRACT INTRODUCTION CHAPTER I
HEALTH CARE DEMAND AND IMPACT OF POLICIES IN A CONGESTED PUBLIC SYSTEM . . . ..
1.1 Introduction.
1.2 Québec's Health Care System 1.3 Demand Mode!
1.4 Equilibrium and Calibration
1.4.1 Health Care Supply and Equilibrium . 1.4.2 Functional Fonns
1.4.3 Data . . .
1.4.4 Parametric Choices and Calibration 1.5 Numerical Results . . . .. . . . .
1.5.1 Determinants of Health Care Demand
1.5.2 Elasticity of Demand With Respect to Congestion 1.5.3 Predicted Impact of Policies .
1.6 Conclusion CHAPTER II v xi xiii xv xvii 1 5 6 10 11 16 17 18 20 21 22 22 26 27 39
viii
WAITING TIMES FOR MEDICAL CARE IN AN AGING POPULATION CONTEXT:
THE CASE OF QUÉBEC 41
2.1 Introduction. 42
2.2 Methodology 45
2.2.1 Overview 45
2.2.2 Population Module 46
2.2.3 Policy Module . . . 48
2.2.4 Health Care Module 50
2.2.5 Policy Outcome Module 52
2.3 Parametric Choices and Calibration 53
2.3.1 Health Care Module Parameters 53
2.3.2 Labor Productivity Growth 53
2.3.3 Technological Progress 55
2.4 Numerical Results 56
2.5 Discussion 64
CHAPTERIII
FORECASTING POPULATION HEALTH, HEALTH SPENDING AND MORTALITY 67
3.1 Introduction . 68 3.2 Mode!
..
71 3.2.1 Timing 72 3.2.2 Preferences 72 3.2.3 Budget Constraint 73 3.2.4 Health Insurance . 743.2.5 Health Law of Motion 74
3.2.6 U ncertainty . 76 3.2.7 Bellman Equation 76 3.2.8 Aggregation of Results . 77 3.3 Data Sources 77 3.3.1 Distribution of Agents . 77 3.3.2 Moments 78
3.4 Calibration
.... . .
. . . . . 803.4.1 Health Insurance Parameters 80
3.4.2 Health Depreciation and Probability Parameters 82
3.4.3 Medical Technology Parameters . . . . 83
3.4.4 Utility Parameters and Discount Factor 83
3.4.5 Trend Parameters 85 3.5 Forecasting Results . . . . 85 3.5.1 Baseline Projections 87 3.5.2 Alternative Scenarios 91 3.5.3 Sensitivity of Results . 96 3.6 Conclusion • • 0 • • • • • • • 96 APPENDIX A
HEALTH CARE DEMA ID AND IMPACT OF POLICIES IN A CONGESTED PUBLIC
SYSTEM . . . . . . 99
A.1 Analytic Developments . 99
A.2 Data Manipulations . . 104
A.3 Mortality, Life Expectancy and Savings Calculation 105
A.4 Calibration Algorithm . . . . . . . . . 107
A.5 Bellman Equation Solving Algorithm . 110
A.6 Relative Risk Aversion Sensitivity Analysis 111
APPENDIX B
WAITING TIMES FOR MEDICAL CARE IN AN AGING POPULATION CONTEXT: THE CASE OF QUÉBEC . . . . . . . . . . . . . . . . . . . . . . . . . . . . . . . 113 B .1 Evolution of Self-Perceived Health in the Canadian Community Health Survey ( CCHS) 113
B.2 Population Smoothing Procedure . 114
B.3 Dynamic Demand Model 0 • • • • 116
B.4 Bellman Equation Solving Algorithm . 120
B.5 Sensitivity Analyses 0 • • • • • • 0 0 0 121
APPENDIX C
FORECASTING POPULATION HEALTH, HEALTH SPENDING AND MORTALITY 125 C.1 Results Calculations . . . 125
x
Figure
1.1 Minimum Age for Which Agents Use Health Care (for all savings values)
1.2 Age vs. Expected Savings . . . . . . . . . . . . . . . . . .
1.3 Simulated Impact of Congestion on Health Care Demand
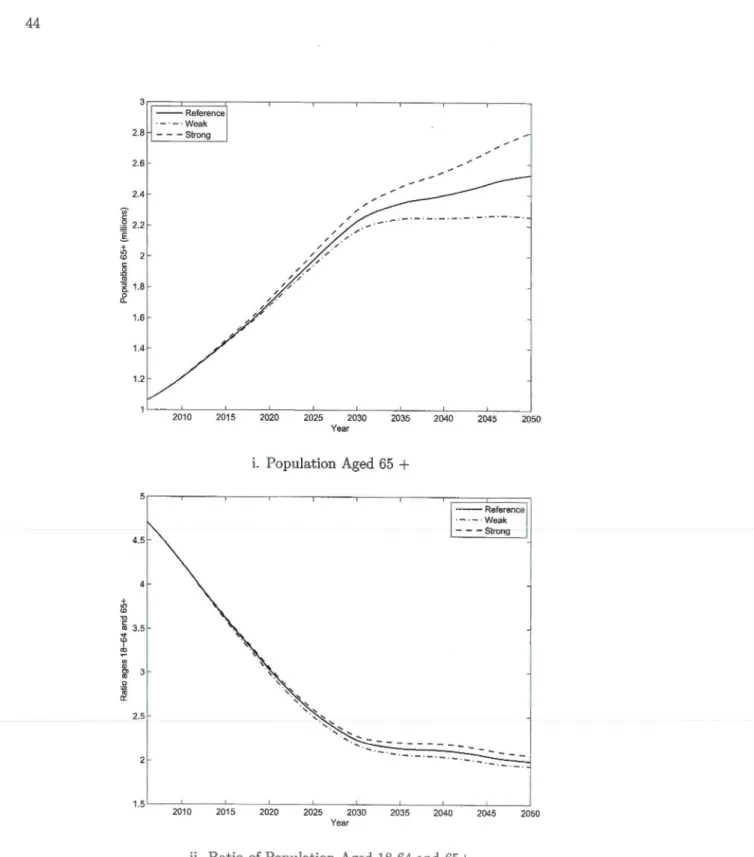
2.1 Overview of Population Aging in Québec, ISQ Demographie Scenarios
Page
25
25
28
44
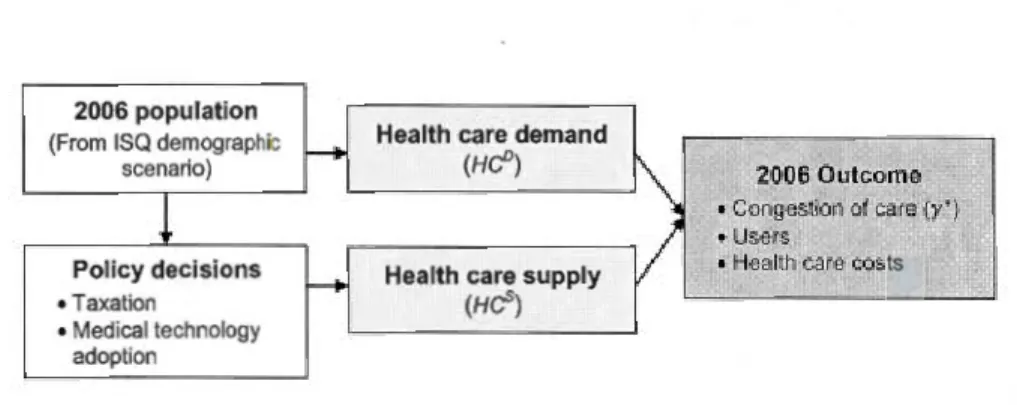
2.2 Model Overview for Year 2006 . . . . . . . . . . . . . . . . . . . . 46
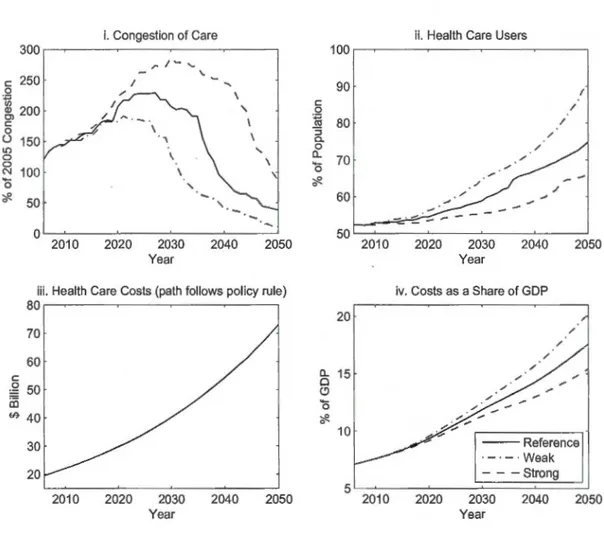
2.3 Predicted Outcome of Increasing Health Care Costs at a Steady Pace 57
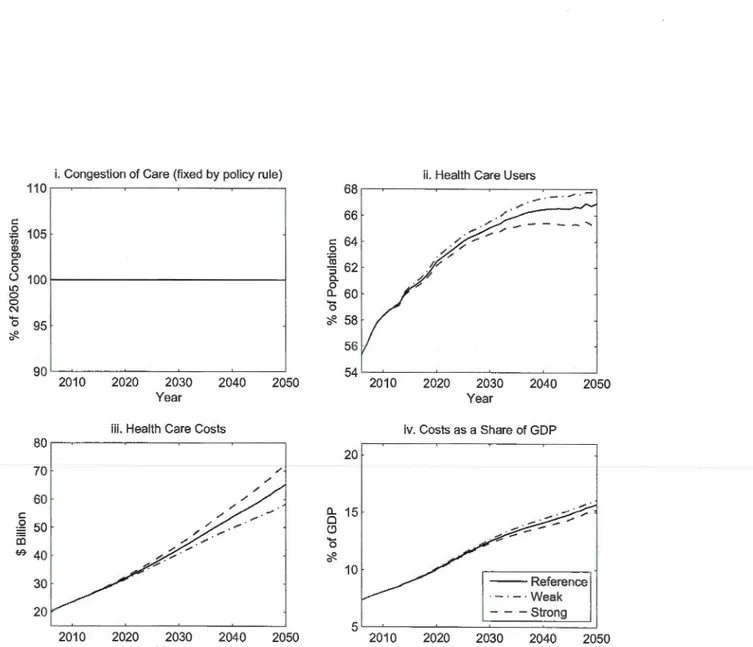
2.4 Predicted Outcome of Maintaining a Steady Congestion Level . . . . . 60
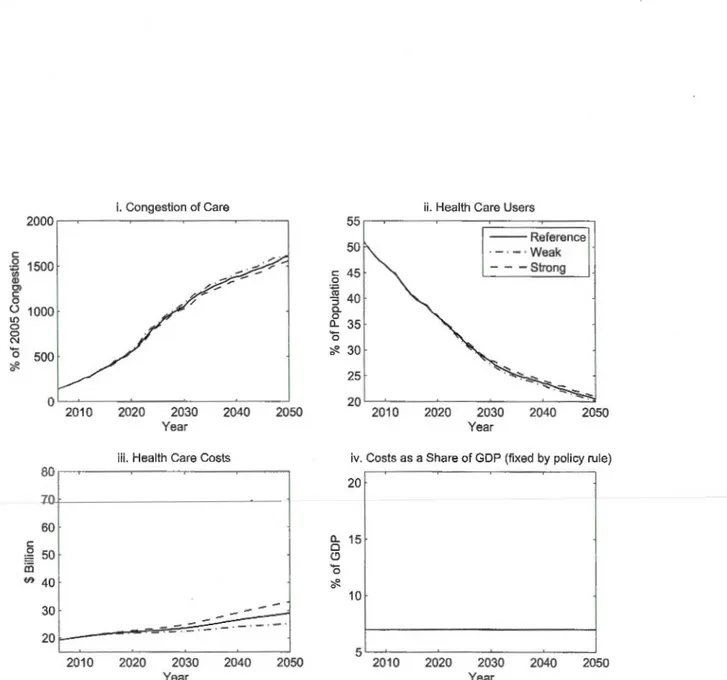
2.5 Predicted Outcome of Maintaining Health Spending Constant as a Share of GDP 62
2.6 Predicted Outcome of Rationing the Adoption of Technological Developments . 64
3.1 Total Medical Expenditures Vs. Age . . . .
3.2 Baseline Simulation Results over the Period 1985 to 2050
3.3 Simulated Prevalence of Chronic Conditions per Age
3.4 Simulated Share of 65+ Population . . .
3.5 Simulations of Alternative Scenarios over the Period 2010 to 2050 .
3.6 Out-of-Pocket Medical Expenditures Per Capita ..
A.1 Life and Death According to Stochastic Realizations
80 86 90 90 92 94 100
xii
A.2 Dynamic Gain Examples . 102
A.3 Comparison of Model and Data Mortality Rates 109
B.1 Average Health per Age and CCHS Cycle 115
B.2 2005 Initial Distribution vs. 2006 ISQ Projection 115
B.3 Income Growth Trend Sensitivity Analysis . . . . 122
B.4 Medicallnnovation Cost Trend Sensitivity Analysis . 124
C.1 Sensitivity of Spending Projections to Relative Risk Aversion Parameter over the Period 2010 to 2050 . . . . . . . . . . . . . . . . . . . . . . . . . . . . . . . . 128
C.2 Sensitivity of Alternative Scenarios to Relative Risk Aversion Parameter over the Period 2010 to 2050 . . . . . . . . . . . . . . . . . . . . . . . . . 130
C.3 Sensitivity of Projections to Technology Parameters over the Period 2010 to 2050 131
C.4 Sensitivity of Alternative Scenarios to Technology Parameters over the Period 2010 to 2050 • • • • • • • • • • • 0 • • • 0 0 • • • • 0 • • • • • • • • • • • • • • • • 133
Tableau
1.1 Portrait of CCHS 2005 Québec Respondents .
1.2 Calibration . . . . . . . . . .
1.3 Results of Simulated Policies
2.1 Portrait of 2005 Distribution
2.2
2.3
3.1
Main ISQ Demographie Projections Parameters .
Calibration . . . . . . . . .
1985 Distribution Summary
3.2 Calibration . . .
3.3 Simulated Impact of Isolated Trends on Medical Spending
A.1 Sensitivity of Results to Relative Risk Aversion Values (p)
Page 20 23 34 47 47 54 79 81 89 112
Cette thèse étudie plusieurs défis auxquels sont confrontés les systèmes de santé modernes avec des modèles calibrés inspirés des théories du capital-santé et du cycle de vie.
Dans le premier chapitre, nous développons le premier modèle dynamique de demande de soins de santé dans un cadre public. Dans ce modèle, les agents choisissent d'utiliser les soins si la désutilité encourue en file d'attente est dominée par les gains dynamiques permis par l'impact des soins sur la santé. Nous intégrons ensuite cette modélisation de la demande dans un modèle macroéconomique, que nous calibrons à l'aide de données québécoises de 2005. À l'aide de simulations, nous questionnons la pertinence, du point de vue du bien-être social, de permettre à de longs temps d'attente d'émerger afin de réduire les coûts de santé. Nous trouvons que les temps d'attente constituent un mécanisme faible de rationnement de la demande et mènent à d'importants coûts sociaux. En contrepartie, toutes les politiques simulées menant à des réductions de temps d'attente génèrent des gains substantiels de bien-être.
Dans le second chapitre, nous étendons notre méthodologie afin d'étudier les impacts du vieillissement de la génération du "baby-boom" sur les systèmes publics de santé. Nous faisons évoluer la distribution d'agents selon les prévisions des démographes de l'Institut de la statistique du Québec (ISQ) et anticipons l'évolution de l'utilisation des soins et des temps d'attente de 2005 à 2050. Nous trouvons que la politique actuelle d'augmentation de 5% par an du budget de la santé mènera à un allongement important des temps d'attente d'ici 2030, et ce malgré une augmentation marquée de la part des coûts de santé dans l'économie. D'ici à 2050, nous estimons qu'il sera nécessaire de doubler la part de l'économie allouée au système de santé afin de maintenir les temps d'attente à leurs niveaux de 2005.
Dans le dernier chapitre, nous nous questionnons sur l'évolution à venir de la santé, de la longévité et des coûts des soins des États-Unis d'Amérique (É-U). Nous développons un mod-èle de demande de soins dont le point focal est l'incertitude pour les agents de contracter une
xvi
maladie chronique. Nous calibrons ce modèle sur l'évolution des données américaines de 1985 à 2005. Selon nos simulations, les dépenses de santé atteindront 22% du PIB des É-U d'ici 2050 si les tendances récentes continuent au même rythme. Nous trouvons que la prévalence de maladies chronique continuera de croître durant cette période, mais n'entraînera pas d'augmentations im-portante de coûts des soins. Ce sont plutôt les progrès technologiques en santé et l'augmentation des revenus qui entraîneront la hausse des dépenses.
Mots-clé: Systèmes publics de santé, demande de soins de santé, coûts des soins de santé, temps d'attente, vieillissement, maladies chroniques.
This thesis aims to shed light on challenges faced by modern health care systems by focusing on the study of the demand for care.
In the first chapter, we build the first theoretic health-capital demand model in a public health care setting. In doing so, we close an important gap in the existing literature: public health care systems are the norm rather than the exception in Western countries. To replicate key features of public health care systems, our model showcases the importance of waiting times, rather than monetary priees, on the health care demand problem of individuals. We then embed this demand model in the definition of a macroeconomie equilibrium, calibrated with 2005 Québec data. Our simulations reveal that waiting times for care constitute a weak rationing deviee and lead to important welfare losses if used to contain costs. Furthermore, all policies that lead to waiting times reductions result in major welfare gains.
In the second chapter, we extend the framework developed in the first chapter to anticipate the impact of the aging baby-boom generation on costs, waiting times and health care use in public systems. Our methodology updates the distribution of agents according to the Institut de la statistique du Québec (ISQ) demographie scenarios, and projects policy responses and outcomes for Québec's health care system over the period 2005-2050. Our results indicate that Québec's current budgeting approach of increasing health spending by 5% each year will result in much longer waiting times by 2030. If the government aimed to maintain waiting times at current levels, the share of health spending in the economy would need to double by 2050.
In the last chapter, we aim to forecast the evolution of health care costs, longevity and chronic conditions prevalence in the US. We develop a dynamic demand model which focuses on the uncertainty of developing a chronic condition. Looking ahead, we find that spending will continue to increase steadily if current trends continue at the same pace. By 2050, they would reach 22% of GDP. While chronic conditions prevalence is most likely to continue escalating in
xviii
the years to come, our simulations suggest that it will not generate important additional costs. According to our results, income growth and technological innovations will be the main drivers of the increase in medical costs.
Keywords: Public health care systems, Demand for care, Health care costs, Waiting times, Aging, Chronic conditions.
Recent improvements in our capacity to treat illness and extend life have been nothing short of phenomenal. Over the period 1960-2010, life expectancy at birth in Organisation for Economie Co-operation and Development (OECD) countries has leaped by over 10 years, to 79.7 years. If such gains are extremely valuable, they are also quite costly. Over the same period, resources allocated to health care grew from under 5% to 9.5% of Western countries' gross domestic product (GDP). On average, over 70% of their health expenditures are public, and represent an important and growing share of public spending (OECD, 2012; OECD, 2013). Simultaneously, the demand for care is increasing at an even faster pace. As a result, in many industrialized countries, long waiting times for care have emerged and are now an important facet of health care delivery.
Major trends suggest that further pressure will be added to health care systems in the decades ahead. Since the onset of the 2010s, the first-borns of the baby-boom generation have been reaching 65 years old. As this large generation grows older, it is reasonable to expect a massive increase in the utilization· of medical resources. Simultaneously, recent important trends, such as the rise in obesity and chronic conditions prevalence, could add to the demand for treatments and weigh on many countries' fiscal outlook. In this context, it will be difficult to both supply a high quality of care and contain the expansion of costs.
This thesis aims to shed light on these challenges by focusing on the study of the demand for health care. We use a calibrated !ife-cycle modeling approach, drawing notably from the theoretical health-capital literature (Grossman, 1972; Wolfe, 1985; Ehrlich and Chuma, 1990) and its recent computational branch (Picone, Uribe and Wilson, 1998; Hall and Jones, 2007; Fonseca et al., 2009).
In the first chapter, we look at the demand for care in a public setting and ask whether it is desirable to allow waiting times to increase in order to contain ever growing costs of care.
2
If both the cost and the congestion of care are high, we aim to identify which policy stance is most beneficiai to social welfare and economie activity. To that effect, we build the first theoretic health-capital demand mode! in a public health care setting. In doing so, we close an important gap in the existing literature: public health care systems are the norm rather than the exception in Western countries.1 To replicate key features of public health care systems, our mode! showcases the importance of waiting times, rather than monetary priees, on the health care demand problem of individuals.
We then embed this demand mode! in the definition of an equilibrium, which arises when congestion of the health care system is such that the global demand equals the supply for care. The former is modeled as the sum of all agents among a distribution who choose to consume health care, weighted by the unit cost of their health leve!. The latter is modeled as the sum of public funds obtained from taxes collected from the distribution.
Calibrating our macroeconomie mode! with 2005 Québec data, we find that waiting times for care constitute a weak rationing deviee and lead to important welfare !osses if used to contain costs. Our policy simulations reveal that a 50% permanent reduction in Québec waiting times can be achieved through a variety of fiscal measures that only moderately increase spending. While the choice of reform has important repercussions, all such policies result in major welfare gains, with agents willing to sacrifice over 5% of their post-policy consumption to leave the existing status quo.
In the second chapter, we use the framework developed in the first chapter to anticipate the impact of the aging baby-boom generation on costs, waiting times and health care use in public systems. Our methodology updates the distribution of agents according to the Institut de la statistique du Québec (ISQ) demographie scenarios, and projects policy responses and outcomes for Québec's health care system over the period 2005-2050. We include three main policy stances in our analysis: increasing the system's budget at a steady pace (Québec's current budgeting approach); adapting health care spending to maintain a steady congestion leve!, which holds access to care steady; and maintaining the share of health care costs to GDP constant.
Our results reveal a clear three-way arbitrage between providing a timely access to care, containing the rise of health care costs and adopting the newest available medical technology.
1 Among the 34 OECD member co un tries, the share of health spending assumed by the public sector was greater than that of the private sector for 32 countries in 2010. The exceptions were the United States of America and Mexico (OECD, 2012).
Aging populations increase the demand for and average cost of treatments while reducing the quantity of working age person per elderly, which restrains ability to pay. As such, aging acts as an exacerbating factor on this arbitrage.
In the last chapter, we turn our attention to the demand for medical care in the United States, in which the share of health spending assumed by the public sector is the lowest among OECD countries. Current health care costs projections by the Congressional Budget Office ( CBO) use exogenous cost increases applied to an otherwise standard microsimulation model. A main drawback of such methods is that it often leads to unconstrained growth, which is doubtful in the very long run. With co-authors Pierre-Carl Michaud and Raquel Fonseca, we aim to forecast the evolution of American health care costs, longevity and chronic conditions prevalence in a setting which is consistent with economie theory.
We develop a dynamic demand model close to that of Picone et al. (1998), which intrin-sically allows agents to curb medical spending if it produces a lower marginal flow of expected utility than contemporary consumption. In contrast to the Québécois of our first two chapters, the agents of this model are constrained by monetary priees in their consumption of medi-cal treatments. In our framework, three underlying forces shape the future environment of the American population. First, health depreciation increases over time, due to an increase in seden-tary lifestyles, which results in a trend in the prevalence of chronic conditions in the population. Second, medical innovations improve the productivity of health care in transforming money into health. Finally, the real income of agents grows over time.
Looking ahead, we find that spending will continue to increase steadily if current trends continue at the same pace. By 2050, they would reach 22% of GDP. In our simulations, income growth is responsible for roughly three quarters of the increase of per capita spending, against one quarter for medical innovations. A main result of our simulations is that chronic conditions prevalence is most likely to continue increasing in the years to come, but will not constitute an important generator of medical spending. While curbing obesity and sedentary lifestyles would certainly lead to better quality of life, less chronic conditions and higher life expectancy for Americans, we do not find that it would reduce aggregate health care costs.
SYSTEM
Increasing health care costs and long waiting times for public care are growing sources of concern for governments in industrialized countries. In this paper, we investigate the impact of waiting times on the demand for care, ask whether allowing congestion to increase in order to contain ever growing health care costs is socially desirable, and predict the expected outcome of policies aiming at the reduction of congestion and costs of care. We develop a macroeconomie model in which agents who differ in terms of age, health capital and wealth choose whether or not to use a public health care system funded through income taxes. Calibrating our model with Québec data, we find that the aggregate demand for care is quite inelastic with respect to health care congestion. Waiting times for care thus constitute a weak rationing deviee and should not be used by welfare-maximizing governments to contain costs. On the brighter side, policy simulations reveal that a 50% permanent reduction in Québec waiting times can be achieved through a variety of fiscal measures that only moderately increase health care costs. While the choice of reform has important repercussions on the equilibrium, all such policies result in major welfare gains, with agents willing to sacrifice over 5% of their post-policy consumption to leave the existing status quo.
6
1.1 Introduction
Western countries have seen a constant growth of health care spending over the last half century, doubling as a proportion of GDP for over half of OECD members and reaching an average of 8.6% in 2007 (OECD, 2010). While the causes underlying this trend may vary from country to country, it has become a growing source of concern for governments. The public provision of care is a common feature in industrialized nations, with the government of all countries except the United States of America and Mexico assuming over half of the health-related costs.
Simultaneously, waiting times have been increasingly used to contain the demand for health care (Cullis, Jones and Propper, 2000; Gravelle and Siciliani, 2007), and are now con-sidered an important problem in their own right in many industrialized countries. This led to the OECD Project on Waiting Times in the early 2000's, involving 12 countries reporting a high congestion1
, and a number of other studies. Despite these efforts, our understanding of the relationship between congestion, demand for care and costs in public health care systems remains limited and many fundamental questions remain unanswered: Is it desirable to allow waiting times to increase in order to contain ever growing costs of care? Which patients are more likely to be discouraged from using health care as the congestion of the health care system increases? If both the cost and the congestion of care are high, what type of policy is most beneficia! to social welfare and economie activity? To answer these questions, we first develop a theoretical model of health care demand in a public setting characterized by waiting times and zero monetary priees. We then add an equilibrium concept calibrated with Québec data in order to quantitavely study the impact of waiting times on consumer demand and predict the expected outcome and desirability of policies aiming at the reduction of congestion and costs of care.
Our paper departs from and adds to the existing literature in three major ways. First, we introduce a health-capital demand model in a dynamic stochastic context that captures key features of public systems. This closes an important gap in the literature. While dynamic health-capital models originated in the 1970's (Grossman, 1972) and have addressed a variety of important questions, the literature has exclusively assumed that health markets were competitive
1These were Australia, Canada, Denmark, Finland, Ireland, Italy, Netherlands, New Zealand, Norway, Spain, Sweden and United Kingdom.
and cleared with monetary priees. This is also the case with the more recent and growing literature which applies numerical methods to estimate the demand for care (Picone, Uribe and Wilson, 1998) and macroeconomie health outcomes (Hall and Jones, 2007; Fonseca et al., 2009). As noted above, a competitive health care market is at odds with the reality of the vast majority of OECD countries. Even the United States of America's portion of government spending, the lowest among OECD countries, was of 46.5% in 2007 and may rise significantly in the next decade as reforms to increase the generosity of Medicare are being pursued by the Obama administration.
Second, our methodology ad dresses limitations of the empiricalliterature on waiting times, which has so far been constrained to the study of waiting lists for specifie procedures, such as cataract surgery, hip replacement, and hysterectomy, or groups of similar treatments (Coyte et al., 1994; Anderson, 1997; Martin and Smith, 1999; Martin and Smith, 2003; Siciliani and Hurst, 2004). The interest in these particular procedures is understandable: sin ce they are elective in nature, they generate the longest waiting lists and are thus a natural source of public concern.
However, two mains issues can be raised with su ch studies. A first issue is that elective surgeries are a limited subset of the quantity of services provided by health care systems, and agents eligible for them are usually similar in terms of age and health. Consequently, these studies are not informative about the general congestion of the system. A second issue concerns the distinction, raised by Lindsay and Feigenbaum (1984), between waiting queues, where agents must wait in persan at a given location, and waiting lists, where agents can use their time freely until receiving the desired good or service in the future. As rationing deviees, the latter clear markets through a decrease in the present value of the desired good or service, while the former impose a direct opportunity cost on agents, who are unable to use this time for other purposes.
Anecdotal evidence and intuition suggest that waiting time spent in crowded rooms before obtaining care (or being added to a list) is an important component of public care congestion and, plausibly, its most direct rationing mechanism. Sorne evidence from the medical literature also supports this notion. For instance, a 1990 survey revealed that the number of patients who left Los Angeles County emergency departments without being seen was correlated both with reported waiting times (in queues) and the public nature of facilities (Stock et al., 1994). 7.3% of public hospital patients left without being seen, versus only 2.4% of private hospital patients. Despite this, queues have largely been ignored by the empiricalliterature. Again, this is understandable, since data on the duration of waiting lists abound, while data on the amount of time between the arrivai at a care facility and entry into the waiting list are quite scarce.
8
Both of these issues are addressed with our approach. We mode! congestion as reducing the time available for agents to allocate between leisure and consumption, and assess the demand of agents of ali age and health profiles in face of the global congestion of care.
Third, because of our macroeconomie equilibrium, we take into account general e quilib-rium effects such as the reaction of workers to differing taxation mechanisms or congestion levels, and are able to predict the welfare impact of policies.
In our theoretical demand mode!, we study agents who differ in terms of age, health and financial assets. The depreciation of health capital and the impact of care on health are modeled as stochastic variables that depend on the age and health of agents. Death is modeled as a terminal value that arises when a critically low value of health capital is reached. At any date, agents ma.ximize their discounted lifetime utility by choosing their consumption, working time and whether or not to use the health care system. During a given period, the amount of time available for production and leisure is limited by the health of agents and, if they use health care, the congestion of the public system. In this mode!, we find that agents choose to consume health care when the uncertain expected gain of doing so exceeds the certain utility cost endured in the current period, which is directly determined by the congestion of care. The global demand for public care is modeled as the sum of ali agents who choose to consume health care, weighted by the unit cost of their health leve!. Equilibrium arises when congestion is such that the global demand equals the public funds available for health care, obtained from taxes collected from the population of agents.
We devise a calibration strategy that assigns the congestion leve!, tax rate, and the health law of motion in order to replicate observed health care use, GDP, health care costs, mortality rates and !ife expectancy. We calibrate our mode! using Québec data from the 2005 Canadian Community Health Survey (CCHS). Québec's case is particularly interesting for two reasons. First, health care expenses represented 11.3% (CIHI, 2008) of its GDP in 2007, which would have placed second behind the United States of America among OECD ratios (had it been a country). Second, indicators and anecdotal evidence suggest that Québec's health care system has a high congestion. Of the 12% of Québécois who claimed not to receive the appropriate amount of care in 2005 in the CCHS sm'Vey, 47% asserted that waiting times were to biarne. As such, Québec is a natural candidate for public reforms to its health care system bath to reduce costs and combat the congestion of care.
Using our calibration as a starting point, we simulate the impact on demand of exogenous congestion levels to study elasticity with respect to waiting times, then simulate a quantity of policies by modifying the parameters under the government's control, such as the incarne tax rate and the generosity of the pension system. Our main findings are that demand (as measured by the number of patients) is inelastic with respect to waiting times, with a simulated elasticity of -0.19 in the neighborhood of the present congestion level. In other words, a 1% increase in waiting times should be expected to reduce the number of users of health care by only 0.2%. When congestion emerges, young, healthy agents are the ones chased away from the system, while agents who stand to benefit the most from health care remain. Since agents with lower health are most expensive to treat, the cost of public care is only marginally reduced by the exit of healthy agents. Thus, congestion is a weak deviee for containing health-related expenses.
Policy simulations indicate that reducing health care funding, which increases congestion, creates large welfare lasses as measured by a variety of welfare measures, including the average value of our distribution of agents. The results indicate that a 1% reduction in the tax-to-GDP ratio of Québec at the expense of health care would create a 260% permanent increase in waiting times, decreasing the welfare of all age and health groups. In contrast, introducing user fees, increasing incarne tax or decreasing the generosity of other government programs achieve a similar permanent reduction of congestion (via the increased funding of health care) and lead to important welfare gains. However, the outcome differs depending on the choice of policy. For instance, raising incarne taxes induces the largest increase in the number of users as it incorporates no replacement to waiting times as a disencentive to using health care. As a result, health care spending need to grow more as a percentage of GDP to reduce waiting times than is the case with the introduction of user fees. That said, applying high fees is found to decrease the welfare of the poorest and sickest agents, who prefer the status quo. Alternatively, increasing the retirement age by five years produces a large GDP increase and a reduction in the cost of pensions but may be difficult to implement in practice, since Québécois have planned their life-cycle savings according to the existing scheme. We find that a milder combination of these policies also yields a permanent decrease in congestion and moderates the undesirable aspects of individual policies; it may thus be the most attractive and politically feasible policy scenario.
The remainder of the paper is organized as follows. Section 1.3 describes the theoretical demand model. Section 1.4 develops the equilibrium concept and calibration strategy needed
10
to solve our mode! numerically. Section 1.5 presents the calibrated demand function and our simulations of exogenous congestion levels and policies. Finally, Section 1.6 puts our results in a practical policy perspective and suggests future avenues of research.
1.2 Québec's Health Care System
Under Canada's constitution, provinces are responsible for health care management. Therefore, there is not one national health care system, but ten independant provincial sys -tems reporting to their provincial governments and a relatively small federal program covering First Nations and the military. In practice, however, the federal government exerts a strong
influence on provincial health care delivery through the Canada Health Act (CHA) of 1984. This law states requirements that must be met by the provincial health care systems in order to qualify for the Canada Health Transfer (CHT), Canada's largest federal transfer program. In 2005-2006, the base year of our calibration, $5.0B were transferred to Québec through the CHT, or 23% of the province's public health care spending (Department of Finance Canada, 2012). Among the law's requirements are universality, comprehensiveness, accessibility and public a d-ministration of care. In effect, the law ensures access to medically necessary health services without charges at the point of services for Canadians. The provinces can however define the basket of goods deemed necessary, which allows for differences in the range of services covered between provinces and over time (Madore, 2005).
Québec's health care supply is managed by the Ministère de la santé et des services sociaux (MSSS) at the provinciallevel and by 95 Centres de santé et de services sociaux (most of which include a hospital center) at the locallevel (MSSS, 2008). The public health insurance plan is administered by the Régie de l'assurance maladie du Québec (RAMQ). This insurance covers medical care free-of-charge, as well as dental services for children under 10 years of age and optometric services for persons under age 18 and age 65 and over (RAMQ, 2013a). The medical services covered include both those rendered by general practitioners and medical specialists. They include examinations, consultations, diagnostic procedures, therapeutic procedures, psy-chiatrie treatments, surgery, radiology, anesthesia and basic hospital services (RAMQ, 2013b ). Since 1997, a prescription drug insurance coverage is also required for all Québec residents, either through a private employer plan or through a mandatory basic public plan administered by the RAMQ (RAMQ, 2013c).
1.3 Demand Mode!
To describe the consumer problem in a public health care setting, we use a discrete dynamic programming approach. The fundamental basis of our demand mode! is that health care usage is represented as the binary choice a, i.e. whether to use
(a= 1) or not use
(a= 0)
the health care system at a given date. While this discrete-choice approach differs from the literature, the rationale is that the quantity of health care received by a patient is not restricted by the costs of treatment in a public system. Therefore, an individual that has chosen to seek care will usually rely on his physician's diagnosis and accept the treatment chosen for him. As such, the level of health care treatment received is irrelevant as a control variable in a public system. Also, the user faces a non-monetary cost associated to the waiting times for health care services. The time spent waiting in queues at diverse stages of health care production cannat be used for leisure or production by agents, and is thus a direct opportunity cost on his utility. To our knowledge, this cost has not yet been modeled in a dynamic health-capital mode! and constitutes the second major addition of this article to existing literature.Our model's main concepts and notation draw from Grossman (1972) and Ehrlich and Chuma (1990). At the beginning of a given period, the agent chooses his working time, savings and health care use in order to maximize his expected infinite-horizon discounted utility:
00
max
2::
,etE [u (Ct, Lt)], (1.1)t=O
where
,B
is the discounting factor and Ct and Lt are the consumption and leisure in good health during the period t. Health does not directly enter the utility function and therefore does not contribute to the quality of consumption and leisure. As will be made clear shortly, our conception of time is such that health determines the quantity of time available to the agent, which in practice realizes the same effect. We restrict the utility arguments to consumption and leisure to avoid redundancy.During a given period, the agent faces a certain amount LT (H, œy) of lost time, in which H is his health and Î the congestion leve! of the health care system. Lost time can either be
understood as the literai loss of time due to waiting for health care in a congested facility, or as a reflection of lower quality of time due to the agent being ill, and thus unable to work as productively or enjoy leisure as fully as in full health. In either case, lost time is unavailable for
12
production or leisure during a given period.2 Accordingly, LT is decreasing in its first argument, the agent's health leve! H, meaning that an agent in perfect health faces no lost time, while an agent nearing death !oses a much greater portion of the period. If the agent chooses a = 1, the second argument is equal to /,the congestion of the health care system. LT is strictly increasing in this argument, which means that seeking care bears a cost in time for the agent, and that this cost is increasing in the congestion of the public system. What is left of the period, the agent's available time can be freely divided between working time WT and leisure L. Thus, a P-length period is divided as follows:
P = LT(H,a1)
+
WT+
L (1.2)In effect, the agent's decision regarding time at a given date is limited to his use of health care a and his working time, which jointly determine the remaining leisure time.
The agent's productivity w is considered exogenous to his choices and state variables, and work income is taxed at rate T in order to fund the public expenses. In addition to his work income, the agent can choose to consume sorne of his savings A in any period. The amount of savings will not be permitted to be below 0 at any time. For agents in the workforce, it follows that the constraint on consumption c is:
c ::::: A
+
w . WT (1 - T) (1.3)Since, in this paper, we mode! agents as self-employed, we reduce private pension plans to the choice of savings made by agents during their lifetime: what is left of their savings at the time of their retirement can then be used for consumption, in addition to a fixed exogenous public pension. Accordingly, we model retirement as the following consumption constraint when agents reach the exogenous retirement age ao:
c
::;
A+e
if a~ ao, (1.4)where
e
is the annual public transfer received by retired agents.3 Applying this constraint, we 2French (2005) uses a similar interpretation of intra-period time distribution.know that agents will optimally choose WT = 0 when they reach age ae if we considera utility
function strictly increasing in both consumption and leisure.
Like Grossman, we consider that death occurs when health level H falls below a critical H leve!, after which the agent receives a certain value of death V. To enforce life to be desirable over death as a basic rule for the remainder of this paper, we assign
V
= u(O,O)jl
-{3 (1.5)For utility functions that are strictly increasing and continuous in both consumption and leisure, this formulation reaches that effect, the value of death being then equal to an infinite sequence of periods in which the agent neither consumes nor enjoys leisure.4
With respect to equations (1.1) to (1.5), the agent's maximization problem can be written
as the following Bellman equation: { maxa,WT,c u (c,L)
+
f3E {V (a',H', A')} V(a,H,A)=v
a E {0, 1} s.t. WT E [O,P - LT(H,œy)]{
[O
,
A +
w · WT(1-r)
]
CE[ü,A+
B
]
ifa <ae if a 2: ae if H>
H (1.6) otherwiseIt is noteworthy that 'Y or the tax rate T are fixed in equation (1.6). While they play an
active role in the optimization problem, the former is determined by the collective choices of
the distribution of agents and the latter is set by the government. By assumption, individual
retirement in our mode! is useful for two reasons. First, using Grossman dynamic health care demand models, a vast literature found important dynamic interactions between retirement and health care consumption of agents (Wolf, 1985; French, 2005; Fonseca et al., 2009). Not involving any form of retirement may thus result in misguided results. Second, it will later enable us to test how modifying pension generosity parameters affects the health care system.
4It is wotth noting that a variety of common utility functions, among which the Cobb-Douglas, imply u (0, 0) = 0, and th us yield .t: = 0, a seemingly intuitive leve! for the value of death. However, if the utility function allows for negative values, choosing ~ = 0 by default may result in sorne agents optimally avoiding health care to precipitate death.
14
agents cannot affect these parameters or predict their future variations. In section 1.4, we will see how these parameters are determined in the numerical version of the model.
The laws of motion for the agent's three state variables are as follows. First, the agent's stock of health-capital decreases at an uncertain depreciation rate 8 each year, and may also be affected by the health care impact of treatment 'lj;if he chooses to seek care. We formulate that the mean of the depreciation rate 8 (a, E0) is age-dependent and affected by a stochastic shock, Eo. Therefore, the agent cannot predict or choose his age of dea th. This formulation allows for appreciations of health without using health care, which happen when 8 is negative. If the agent chooses to use health care, he will add 'tf;
(H,
E'!f;) to his health. The expected impact of treatment is dependent on the health level of the patient, though the sign of this relationship is debatable.5 As with 8, the success of health care in improving the agent's health is an uncertain phenomenon and depends on the realization of shock E'!f;· Finally, an agent whose health has fallen below the death threshold remains deceased in the next period. The movement of the agent's health-capital stock is given by:H'
~
{; · (1-0
(a,<o)+
o,P
(H,ew)) ifH > H(1.7) otherwise
Second, the amount of savings in the next period is the total amount of money available to the agent during the period that is not spent on consumption, increased by the real interest rater:
A'=
{
(l+r)(A+w·WT(l-r)-c)
(l+r)(A+B
-c
)
if a < ao
if a
2::
aoFinally, at the end of each period, the agent's age a increases by one:
(1.8)
5 As discussed by Chang (1995), on the one band, it could be easier to treat a patient with a single illness rather than one with multiple illnesses. In this case, the impact of care should be increasing in the leve! of health. On the other band, a patient that is suffering from a severe disease, and thus is in very bad health, could receive a greater appreciation of his health capital by having access to care than a patient with a mild disease. In this scenario, the impact of care should be greater with the leve! of sickness. To our knowledge, no stylized fact currently exists to determine which of these equally plausible interpretations should be retained.
a'= a+
1 (1.9)This constitutes the basic health care demand model used in this paper. Before describing the numerical mode! and results, we believe it important to briefly analyze the determinants of the choice of a in the theoretical version of the mode!. Since health care usage is a binat-y choice, the agent's core problem can be expressed as a comparison of the expected values when using health care or not. Denoting those values V1 and Vo, where the indices refer to the choice
of a, the agent will choose to use health care if V1
>
V0 . This implies, with respect to (1.6),(3 · (E
[V{]-
E [V~])
>
u(co,
Lo)
-
u(c1, LI)
(1.10)This inequality can be interpreted as follows: in a public health care system characterized by waiting times, an agent will choose to use care if the expected dynamic gain of doing so, on the left-hand side, is larger than the utility loss in the current period, on the right-hand side. In this formulation, the gain of using health care is uncertain and set in the future, while the cost is immediate and certain. In Appendix A.1, we further the analytic development of the demand mode!: we explore both sides of (1.10) in further detail, clarify the impact of the stochastic terms on death, and find that waiting times are the most plausible and direct lever available to the government to restrict over-consumption of health care. Most interestingly, our analytical development enables us to decompose the expected dynamic gain of health care in two components. Denoting Pa the probability of being alive in the next period conditional on the choice of a, we find:
E [V{] - E [V~] (l.ll)
Life-saving gain
+
P1 · (E [V{ 1 H~>
li
] -
E [V~ 1Hb
>
li])
Quality of !ife gainThe first component of (l.ll) is the expected gain caused by the difference in probability of being alive in the next period due to the use of health care. When a patient faces a life-threatening illness that can be addressed with a medical treatment, this component will have
16
a high value. We thus name this component the life-saving gain.6 The second component is the difference in the expected value of life in
t
+
1 conditional to the agent being alive. This component will be high in cases where the use of health care increases both the agent's quantity of available time in subsequent periods and his expected longevity excluding the very next period. As mentioned above, an increase in available time can be interpreted as both an increase in the quality of the agent's time or its literai quantity. We name to this component as the quality of life gain. More discussion on these components is presented in Appendix A.l.1.4 Equilibrium and Calibration
In the remainder of the paper, we aim at numerically answering our research questions, which requires calibrating the modelas closely as possible to available data and aggregating the choice of agents to predict the macroeconomie outcome of policies.
Calibrating our model presents two main challenges. First, although there is considerable evidence of congestion in Québec's health care system, there is to our knowledge no single indicator that can be used to effectively calibrate the congestion of the whole system, η Waiting times for specifie procedures or at the emergency room level, though somewhat informative, are not satisfying measures of congestion, since Î should reflect the congestion of all services offered by the public health care system. Second, the health law of motion (1.7) is unobservable. The parameters chosen for this function should replicate sorne observable data, but a strategy is needed to achieve this goal.
Both to obtain a satisfying calibration and the macroeconomie outcome of policies, we add a simple macroeconomie equilibrium to our demand model. To that effect, we develop a health care supply and a pension system, both funded by income taxes. 7 We th en specify the model's functional forms, basing ourselves on the literature when possible and on a minimal set of intuitions otherwise. Subsequently, we obtain the equilibrium for a distribution of agents consistent with Québec data found in the Canadian Community Health Survey (CCHS) of 2005.
6We refrain from naming this component the life-expectancy gain because the impact of the use of health
care in t on the probability of being alive in t
+ n, n
> 1, periods, which also affects the difference in !ife expectancy, is found in the second component.7Thus, we impose a coherence between the funds collected by taxing the distribution's output and the government's expenses. Of course, agents may simultaneously use their savings to supplement the basic public pensions.
In effect, obtaining the equilibrium reveals the priee of health care according to the data, which in our case corresponds to the unknown parameter f. This approach also provides the taxation and wage parameters consistent with Québec's GDP and total health care cost for that year. Lastly, since the CCHS data is consistent with Québec's population, we are able to choose the health law of motion's parameters in order to replicate three observed mortality measures as closely as possible. The CUITent section covers these methodological steps and describes our final calibration.
1.4.1 Health Care Supply and Equilibrium
Obtaining a market equilibrium requires two additional conceptual steps. First, the ag-gregate demand for health care is a function of the choices to use the system made by ali the population's N individuals, and their leve! of health, as follows:
(1.12) The public supply of health care is defined as:
N N
HC8 =
L
T. w. WTi -L
1ai2':ao .e
(1.13)i=l i=l
Pensions, like health care, are financed through income taxes. The health care supply described above is determined only by the government's health care spending, which is equal to the taxes collected minus the cost of public pensions. The rationale behind this formulation is that higher taxes collected for health care should yield a higher quantity of care supplied at an aggregate level. This formulation implies that health care is produced linearly by the public system and presents no fixed cost. This specification deliberately excludes parameters that play an important role in the capacity of a system to supply care, such as the number of hospitals, beds or physicians. While we are conscious that the supply of health care at an aggregate leve! is a complex phenomenon,8 we believe (1.13) is sufficient for the study of health care demand, the
8For instance, in the case of Québec, the different professionals involved in the deliverance of care are ali represented by separate unions with long term contracts, restricting the impact of policymakers on the final supply of care. The specifie care given to a patient is determined by an independent institution, the Collège des médecins du Québec, which also fixes the criteria that determines who can work as a physician in the province. Also, the aggregate cost of health care is often greater than the resources that were budgeted for a given year, yielding deficits.
18
purpose of our paper.
In this setting, the aggregate equilibrium is obtained when, for a given tax rate T and distribution of agents, the congestion level 1 is such that HCD = HC5. We denote 1* the
congestion level such that the aggregate demand equals the supply of care. As seen in section 1.3, the congestion parameter directly restrains health care use through the utility cost in the current period and thus lowers HCD. On the other hand, congestion affects HC5 through two
diverging channels. First, congestion discourages health care use. Agents who decide not to use health care have more available time during the period to work, which generates more tax revenue. Second, congestion can also lower H C5, sin ce patients who are not discouraged spend more time waiting in line and have less time available to work, which yields less tax revenue. For plausible functional forms and parameters, the marginal impact of congestion is stronger on the demand than on the supply, which enables us to obtain a unique numerical equilibrium.
1.4.2 Functional Forms
In total, four functional forms need to be specified to solve our problem numerically: three at the consumer demand level and one at the aggregate level. First, we specify the utility function as:
( cl-w
L
w
)
1-p - 1u(c,L)
=
~-1
~--p (1.14)
This utility function is standard in modern macroeconomie models because of two useful proper-ties. It has a constant Arrow-Pratt relative risk aversion coefficient of panda constant elasticity of substitution between consumption and leisure.
Second, the time lost at a given period is specified in order to respect the criteria discussed in section 1.3:
LT(H,cxi)=P·
(
1
-
H
+cxr
(
~=
~))
(1.15)This function is decreasing in health, which means that the sicker the agent, the less time is available to be spent for leisure or work. When using the health care system, the agent sacrifices an amount of time, increasing in /, in waiting lines, and thus always obtains a higher lost time when
ex
= 1. Finally
, as observed in the Québec system, patients with severe health problemsare prioritized, which means that the waiting time portion of LT increases with health. The congestion leve! is allowed to assume values between zero and one and can be interpreted in this formulation as the proportion of the period spent in waiting !ines by an agent with full health. Third, the health law of motion, which is a function of current health and age of the agent, as weil as both shocks, is chosen as follows: (1.16) { H.
(1
-
(a-=_g,-<6
)bt
+a
((!!_-H)
.
(l+<,p)
)b
3
)
1 ( ) _ a-g,_ (H-!f_) b2 H a,H,Eë,E..p -H if H>
H otherwisewhere g and a are the minimum and maximum ages considered in the calibration and H is the health capital corresponding to full health. While not intuitive at first glanee, this functional form presents many attractive features. The health capital depreciation rate is increasing in the age of the agent for neutra! values of stochastic term Eë. For ages nearing a, even neutra! values of the stochastic term yield an important depreciation of health capital. Also, for values of the stochastic term above a - g, an agent can see an improvement in his health without the use of health care.
The second term, the production of health care, has similar features. We assume that agents in bad health - for whom ( H - H) is high -can expect a higher gain from using health care. However, for neutra! values of the stochastic term E..p, the agent may not expect to regain full health for values of parameter b2 above unity. Also, parameters b1 and b3 enable non-linearity
in the depreciation and production of health. In effect, these parameters and the distribution of the stochastic terms are tools that make this law of motion flexible, which we will later use to replicate essential aspects of our data regarding health.
The only function that remains to be specified is the aggregate demand (1.12), which is needed to obtain equilibrium and isolate the congestion parameter "'(. We formulate it as a simple linear transformation of the sum of users, weighted by the severity of their sickness:
N
HCD
=
d.2::::
ai. (H- Hi) ' (1.17)i=l
20
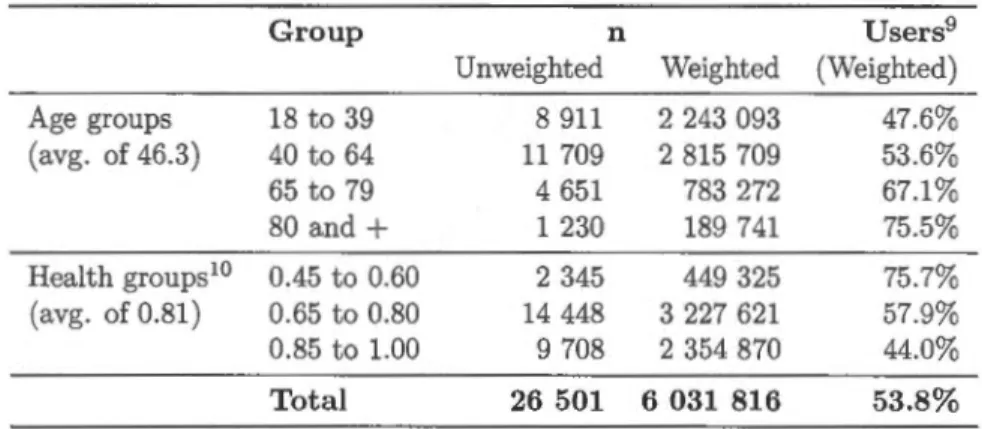
Table 1.1 Portrait of CCHS 2005 Québec Respondents
Group n Users9 Unweighted Weighted (Weighted) Age groups 18 to 39 8 911 2 243 093 47.6% (avg. of 46.3) 40 to 64 11 709 2 815 709 53.6% 65 to 79 4 651 783 272 67.1% 80 and + 1 230 189 741 75.5% Health groups10 0.45 to 0.60 2 345 449 325 75.7% (avg. of 0.81) 0.65 to 0.80 14 448 3 227 621 57.9% 0.85 to 1.00 9 708 2 354 870 44.0% Total 26 501 6 031 816 53.8%
is noteworthy that this form implies that the cost of treating a given patient is linearly increasing in his sickness level ( H - Hi). The only parameter of this function, d, is the marginal cost, in dollars, of treating illness. It enables us to express the aggregate demand for care in dollar terms, and thus equate the demand to the supply, already specified by (1.13).
1.4.3 Data
The bulk of the data used for our calibration is extracted from cycle 3.1 of the Canadian Community Health Survey (CCHS), conducted in 2005. This survey is conducted annually by Canada's national statistics agency, Statistics Canada, with the objective of gathering healt h-related data at precise geographie levels across the country and contains hundreds of variables. Included in the CCHS data are a subset of variables that enable us to establish the age, health level and health care choices of the respondents in 2005. To obtain these, we make a number of data manipulations, described in Appendix A.2.
In total, 26,501 respondents from the province of Québec and over the majority age of eighteen are included in our database. Taking into account the weighting variable of the survey,
these respondents correspond to 5.98 million Québécois, or 96.7% of the total adult population of
the province for that year, according to ISQ data. The weighting variable was thus re-weighted in order to represent the full adult population. Table 1.1 presents a summary of the resulting distribution. Health values of 0.45 to 0.60 correspond to the "Poor" (lowest) health label in the the CCHS self-reported health level questions, .65 to .80 to "Fair" and "Good" labels, and 0.85 to 1.00 to "Very good" and "Excellent" (highest) labels.
1.4.4 Parametric Choices and Calibration
In order to calibrate our mode!, we fix a minimal number of parameters according to the existing literature, data and intuition. First, we fix w
=
.67, a value effective to replicate aggregate choices ofworking time (Kydland and Prescott, 1982; Hansen and Imrohoroglu, 1992). Second, in opposition to most macroeconomie applications using this function, we limit ourselves to values of p<
1, in order for the value of death described by equation (1.5) to be realistic. Withp
?:
1, this function yields u (0, 0) = - oo, resulting in minus-infinite values of death for the agent, rendering their choices at any period irrelevant. By fixing p E (0, 1), we find V= -lj(l-p)(l-,8). We conducted a sensitivity analysis of the risk aversion parameter, presented in Appendix A.6, which led us to reject values close to unity, which would lead to waiting times of over half the period for healthy agents. For ali other values within the tested range, we found very similar quantitative results. Ultimately, we set p to the middle of the possible range, 0.5, which results in an equilibrium value of congestion of 0.067. With regards to (1.15), this value means that agents in perfect health, who wait the longest for care, !ose 6.7% of the period in queues before receiving care. At the opposite of the spectrum, agents with the lowest health leve! only Jose 0.6% of the period in !ines, as their treatment is prioritized.The minimum age we consider is the majority age, after which agents are assumed to be in charge of their health related decisions. In practice, we do not impose a maximal age. When agents reach any age over the parameter
a
= 99, they simply have the same health expectations for a+
1 as agents of that age, which does not impose an automatic death. According to the final calibration of our mode!, 18 year-olds in perfect health have a O. 70% chance of reaching ages above 99. The health capital vector is set according to the intuition that full health is represented by unity, and the health of death is set above zero to enable our health depreciation function to reach H for reasonable combinations of age and E0• We also choose a value of H such that LT is strictly positive and below P. This prevents undesirable outcomes as, for instance, agents using health care because the induced waiting time of doing so is nil, their !ost time being already equal to the period. Finally, we allow for 15 shocks of both stochastic vectors, in order for agents to obtain varied health outcomes.11For public pensions, we base ourselves on two basic components of Canada's Old Age
Se-11The specifie values of these parameters are of little importance. Other reasonable sets of parameters were found to lead to qualitatively identical results after the execution of our calibration algorithm.
22
curity Program, the Old Age Security Pension (OASP) and-the Guaranteed Income Supplement (GIS). They are both publicly funded and constitute the minimum pension funds available to al! retired Canadians of 65 years of age and over. The age of retirement and generosity of pensions, computed as the sum of the OASP and GIS available to agents with no other pension funds in 2005, are obtained from Services Canada.
The remaining parameters are obtained through our calibration algorithm in order to replicate the percentage of users found in the database, severa! demographie facets, the total cost of health care and the GDP of Québec. The retirement and macroeconomie parameters are drawn from multiple sources, as follows. We obtain the total cost of health care for 2005, of 19.0 billion Canadian dollars, by withdrawing the cost of public medication insurance of $ 2.4B, as reported by the Régie de l'assurance maladie du Québec, from the total cost of health assumed by the public sector of $ 21.4B, as reported by the Canadian Institute for Health Information. The GDP of 2005 is $ 272.0B and corresponds to the income-based, market priees annual GDP, as published by Statistics Canada. The taxation parameter is set to the ratio between the cost of the public expenses and the GDP, in order to enforce a balanced budget:
HC5
+
~
[:._
1
1a,>ao · BT = GDF (1.18)
This calibration procedure is explained in Appendix A.4. The full calibration is presented in Table 1.2.
1.5 Numerical Results
1.5.1 Determinants of Health Care Demand
The demand for health care resulting from our procedure is an optimal choice of a for every combination of health, age and savings. For a given health level, we find that older agents always display a positive net gain of using care, resulting a smooth age threshold determining health care use. Figure 1.1 presents this optimal threshold for al! health capital values . Al! agents below the line, which are both young and in good health, optimally choose a = O. Al! agents on the line or above it choose a= 1. This demand fits the trends observed in Table 1.1, in which we saw that health care use was stronger in older and unhealthy individuals in Québec
Table 1.2 Calibration
Fixed Parameters
w: Leisure preference
p: Arrow-Pratt relative aversion coefficient H: Minimum health capital (death threshold) H: Maximum health capital
A:
Maximum savings g,: Minimum agea:
Maximum age ae: Age of retirementB: Annual public transfer to retirees
T: Income tax rate Dimension of vector H Dimension of vector A
Dimension of vectors E8 and E,p
Algorithm-Determined Parameters
Î*: Equilibrium congestion rate w: Hourly productivity
b1 : Health depreciation curve coefficient
b2: Expected impact of treatment coefficient
b3: Treatment impact curve coefficient d: Maximum cost of treatment
f.l8= Expected health depreciation shock
0"8: Std. dev. of health depreciation shock
f.l,p: Expected treatment shock Œ,p: Std. dev. of treatment shock Standard deviations covered
0.67 0.5 0.4 1.0 $500,000.00 18 99 65 $10,319.50 0.10674 13 51 15 0.0671201 $33.33 1 15 1 $25,562.8 58.5 24.1 -0.55 0.109 3