Procedia Engineering 33 (2012) 78 – 91 1877-7058 © 2012 Published by Elsevier Ltd. doi:10.1016/j.proeng.2012.01.1179
Procedia
Engineering
Procedia Engineering 00 (2012) 000–000 www.elsevier.com/locate/procediaISWEE’11
Technical and Economical Performance of Parabolic Trough
Collector Power Plant under Algerian Climate
Abdelkader Zaaraoui
a*, Mohamed Lamine Yousfi
b, Noureddine Said
c,
a Laboratory FIMA University of Khemis Miliana, Route de Theniet El-Had 44225 Khemis Miliana, Algeria b Unit for Development of Solar Equipment (UDES) 42415 Bouismail, Algeria
c Development Center for Renewable Energies (CDER), B.P. 62, Route de l’observatoire, Bouzareah 16340 Algiers, Algeria
Abstract
Parabolic trough solar technology has been proven at nine commercial Solar Electric Generating System (SEGS) power plants that are operating in the California Mojave desert. Simulation using different models when planning this kind of projects and choose the best site for this technology minimizes the risks of these projects. For this purpose, a detailed performance model of the 30 MW SEGS VI parabolic trough power plant was created in the TRNSYS simulation environment using the Solar Thermal Electric Component model library. Both solar and power cycle performance were modeled, but natural gas-fired hybrid operation was not. Good agreement between model predictions and plant measurements was found, with errors usually less than 10%. Also, an economical study has been established to determine the best site, based on the cost of electricity generation. The result shows that Bechar's site is the best site for this technology because of its lowest levelzed electricity cost and its high irradiance level. While the model could be improved, it demonstrates the capability to perform detailed analysis for this technology.
© 2012 Published by Elsevier Ltd. Selection and peer-review under responsibility of ISWEE’11
Key words: Solar thermal power plant, TRNSYS simulation, parabolic trough collector, Renewable energy, SEGS VI
* Corresponding author. Tel.: +213-6-98393955; fax: +213-27-66-48-63. E-mail address: a.zaaraoui@gmail.com.
Open access under CC BY-NC-ND license.
Nomenclature
m
q
demanded mass flow ratenet
Q
of heat absorbed by HTFp
C
specific heat of HTFout
T
outlet temperature of the solar fieldinlet
T
inlet temperature of the solar fieldDNI
Direct Normal Irradiancetot
A
total mirror areaBM
broken mirror fractionavl
F
Available Fraction of Fieldtrk
F
Tracking Fraction of fieldc
η
collector efficiencyK
incident angle modifierM
end lossesSh
shading of parallel rowsD
C
B
A
,
,
,
empirical factors describing the performance of the collector.out
T
∆
difference between collector outlet and ambient temperaturein
T
∆
difference between collector inlet and ambient temperature.eff
A
effective mirror area
CC
Capital Cost [$]1. Introduction
In the last decade, increasing concern regarding environmental problems has created considerable awareness about reducing the CO2 emission during energy generation. Therefore, the new energy policy in electricity sector encourages the maximum use of renewable or the so-called ‘‘green energy’’ sources such as water, wind and solar [1]. Today, renewable energies provide 19% of the world’s electricity [2].
The assessment of the emissions of solar power systems shows that they are particularly well suited for the reduction of greenhouse gases and other pollutants, without creating other environmental risks or contamination. Each square meter of collector surface can avoid as much as 250–400 kg CO2 emissions per year [3]. During September 2003 a START (Solar Thermal
Analysis, Review and Training) team composed of IEA/Solar PACES representatives and observers from Germany and the United State, visited Algeria. The Mission host was the New Energy Algeria (NEAL) located in Algiers. The purpose of the START mission was to brief NEAL and the invited experts from the Ministry for Energy and Mines (MEM), the Algerian power sector and the interested industrials, on the current techno-economic status of solar thermal technologies and discusses the next steps in building Algeria’s first large solar thermal power plant.
With 2,381,741km² of land area, Algeria is by far the largest country of the Mediterranean over 70% of its area is south situated at 20° latitude. According to a study of the German Aerospace Agency, Algeria has with 1,787,000 km² the largest long term land potential for concentrating solar thermal power plants. According to the irradiation maps presented by CDER (Development Center of Renewable Energies), total annual direct normal irradiation (DNI) ranges from 2100 kWh/m²/yr to over 2700 kWh/m²/yr and is considered among the best insolated areas in the world. Within its policy of climate and environment protection, the Algerian Ministry for Energy and Mines fully supports the objective of the CSP (concentrating solar power) Global Market Initiative (GMI) to facilitate and expedite the building of 5,000 MW of CSP worldwide over the next ten years. The Government of Algeria has committed itself to develop solar energy as its main renewable energy source for covering 5% of the national electricity demand by 2010 [4]. Incentive premiums for CSP projects are granted within the framework of Algeria’s new decree 04-92 of March 25th, 2004 relating to the costs of diversification of the electricity production.
According to the current power expansion planning of the MEM, the capacity targets for CSP power implementation in Algeria are 500 MW of new ISCCS (integrated solar combined cycle system) plants until 2010 [4]. As a first step 150 MW integrated solar combined cycle system (30 MW is devoted to solar), is under construction.
In order to study and follow up this kind of system, it is helpful to have a simulation tool. As it appears in the literature, many models have been elaborated [8],[12] for SEGS system but these models were either unavailable or intended only for design calculations or control studies. For this reason, we developed a model of SEGS VI plant under TRNSYS environment, which allows us to simulate and evaluate the performances of this system under Algerian climate.
This system can be installed to supply electricity to people who are lacking electricity in the Algerian rural and deserted areas.
2. Basics principle and site selection
The basic principle of a solar thermal plant is to convert primary solar energy into electricity by means of a collector field, steam turbine and electric generator. The solar field consists of parallel loops of parabolic trough collectors also called Solar Collector Assembly (SCA) (generally Luz System (LS-2, LS-3) collectors are used). Typical properties of the LS-2 and LS-3 are shown in table 1.
Table1. - Selected properties of the LS-2 and LS-3 parabolic trough collectors [5]
Properties LS-2 LS-3
Aperture 5,00 m 5,76 m
Length SCA 48 m 99 m
Distance between Rows 12-15 m 16-17 m Reflecting surface per SCA 235 m² 545 m² Convection loss factor 2 W/m²K 2 W/m²K Diameter of absorber tube 0,07 m 0,07 m
Concentration ratio 72 82
Reflectivity of mirror 0,93 0,93
Coefficient of absorption of absorber tube 0,94 0,96 Coefficient of emission of absorber tube 0,24 0,17 Coefficient of transmission of mirror 0,98 0,98 Coefficient of transmission of glass tube 0,95 0,96
Collector peak efficiency 66% 68%
These solar collectors have concentrators made of glass mirrors. Tracking the sun from East to West, the collectors reflect and concentrate the direct solar radiation about seventy to eighty times on absorbing tubes (also called HCE from heat collection element) mounted on the focal line of the reflecting surface.
An absorber tube consists of a stainless steel tube with a selective coating which is covered by a glass envelope tube to reduce thermal losses. The annular space between absorber tube and glass tube is evacuated. Through the absorber tubes, circulates a heat transfer fluid (HTF), normally synthetic oil, which is heated by the concentrated solar radiation up to a temperature of 400°C.
The feasibility of selecting solar electric generating systems facilities in Algeria is contingent upon the identification of sites well suited to the technology. Desirable physical characteristics of a favorable SEGS site include [3]:
• high direct radiation level • flat topography
• suitable water supply
• access to electric transmission facilities • Availability of auxiliary fuel supplies.
Additionally, socio-political issues such as existing land use and cost, potential environmental and cultural impacts, and local public acceptance can strongly influence the feasibility of a SEGS project [3]. Many of these characteristics are similar to the conventional power plants, except for solar radiation levels, extensive land area needs, the much reduced importance of air emissions, fuel delivery, and fuel and waste handling. Hence, the evaluation of the site criteria is important and sensitive step in the assessment of SEGS potential in Algeria.
To design and operate any SEGS it is necessary to have reliable meteorological or satellite data. In the present paper, four sites were chosen (see table II) for the simulation due to the availability of their meteorological data in METEONORM software, their relatively high direct normal irradiance (DNI) (all sites are ≥ 2000 kWh/m²yr) and their accessibility to road and electrical network. The selected sites for simulation are shown in the table 2:
Table2.Selected sites for the simulation.
Site Lat. Long. Alt. (m) DNI (kWh/m2yr)
Bechar 31,37 N 2,14 O 772 2426,14 El-Menia 30,34 N 2,52 E 397 2105,06 Ghardaïa 32,24 N 3,48 O 468 2097,80 Timimoune 29,15 N 0,17 E 312 2255,54
3. Solar field model
The layout of the SEGS VI (Mojave Desert in California) solar field is shown in Figure 1.
Fig.1. Layout of the SEGS VI plant [6].
The parabolic trough collector based on the model of Lippke, uses an integrated efficiency equation to account for the different fluid temperature at the field inlet and outlet of the collector field [7]. It calculates the demanded mass flow rate of the heat transfer fluid to achieve a user- defined outlet temperature Tout by:
)
(
out inlet p net mT
T
C
Q
q
−
=
(1) Using: heatloss abs netQ
Q
Q
=
−
(2) Where: absQ
: Solar radiation absorbed by the receiver tubesheatloss
Q
: Heat losses by the solar field And the absorbed power is given by:c trk avl tot abs
A
DNI
F
F
BM
Q
=
.
.
.
.(
1
−
).
η
(3)The thermal efficiency of the LS-2 collector can be calculated by [7]:
∆
∆
+
∆
−
∆
+
∆
+
∆
+
+
∆
+
∆
=
DNI
T
T
T
D
DNI
T
T
C
T
T
B
A
Sh
M
K
out in out in out in out inc 2
)
(
3
1
.
.
2
.
2
.
.
.
.
η
(4)When the selective coating of the LS-2 absorber collector is Cermet (Ceramic/Metal) and the annular space is evacuated, the empirical factors are given as follow [8]:
0691
.
0
;
496
.
0
;
007276
.
0
;
3
.
73
=
−
=
−
=
−
=
B
C
D
A
The incidence angle modifier
K
can be calculated with the angle of incidenceθ
in degrees as follow [8]:( )
0
.
0003512
( )
0
.
00003137
( )
2cos
θ
−
θ
−
θ
=
K
(5)An analytical description of the heat losses in the trough field is not easy to find, since all losses such as heat transfer through the pipes isolations, losses in connections, fixings and other circuit components have to be considered [9].
In the operation of a distributed solar power plant, the heat losses in all the piping are Important and have to be included in the model. Additionally, the heat loss in the expansion vessel, which has a large surface area, should be included in the calculation. The heat loss can be calculated by [8]:
−
+
+
=
550
.
686
.
.
out in essel ExpansionV in out eff piping heatlossT
T
Q
T
T
A
Q
Q
(6) Where:,
57
.
2
/
20
W
m
2and
MWth
are
Q
and
Q
piping ExpansionVessel respectively [8]. Finally, the efficiency of the solar field ηfield can be calculated by:trk eff net field
F
A
DNI
Q
.
.
=
η
(7)4. Power plant model
The power plant, as shown in Figure 2, is a Rankine cycle with reheat and feed water heating. For simplicity, each heat exchanger network, consisting of preheater (economizer), steam generator (boiler) and superheater is treated as a single heat exchanger [10].
Fig.2. Flow diagram for power cycle. The numbered vertical cylinders (#1 – 3, 5 – 6) represent closed feed water heaters, while heater #4 represents the deaerator [10].
The power cycle is modeled assuming all components are adiabatic and operating at steady states. Changes in potential and kinetic energy of fluid streams are assumed to be negligible. It is assumed that all the steam generated provides useful work through the turbine, i.e., gland steam production as well as steam losses through line leaks are neglected. Also, negligible changes in the fluid state between the outlet of one component and the inlet of the next are assumed. All power cycle equations are based on mass and energy balances over each fluid stream through each component. Heat exchangers are modeled using an effectiveness-NTU approach. Turbine stages and pumps are modeled in terms of their isentropic efficiencies. The heat exchanger sizes and isentropic efficiencies are determined from full-load design data and adjusted for part-load operation as a function of steam mass flow rate.
The gross system efficiency ηsystem is defined as the ratio of the gross power output to the net heat absorbed by the heat transfer fluid:
net system
Q
W
.=
η
(8) 5. SimulationThe use of simulation tools when planning renewable independent power projects minimizes the risks of these projects. Simulation tools can also help to find the best project site for a given technology or the best technology for a given site [9].
The simulation of both solar field and power plant is done by using STEC (Solar Thermal Electric Component v2.2) library under TRNSYS 15 software for a typical year in hourly time steps.
For this study, the necessary properties applied in the model can be drawn from the technical description [11]. Whereas, water-steam conditions throughout the Rankine cycle are given for solar only operation mode, and are considered as reference conditions. Figure 3 shows the reference conditions applied in the model for the simulation of a parabolic trough system.
Figure 4 shows the TRNSYS user interface of the SEGS VI model. Multiple components can be assigned a single icon called a “macro” to simplify the graphical display, as in case of solar field, steam generator (pre heater boiler and super heater), high- and low-pressure turbines, condenser and feed water heaters as shown by Figure 5. The lines connecting the components represent the flow of information.
Fig. 4. SEGS VI TRNSYS model
6. Results and discussions
6.1. Validation
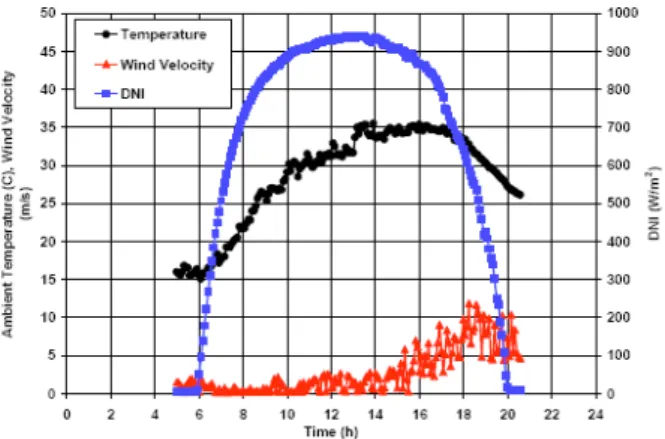
The validation of our model was done for a sunny day, which corresponds to July 18th, 1991, only with a solar operation mode, on an hourly basis for Mojave Desert site in California. The figure 5 shows the meteorological data of the validation day.
Fig. 5. Weather conditions on 18/07/1991 (Mojave Desert in California) [12].
The profile of the generated power (figure 6) gives a good correspondence with the measured data. The average relative error is about that quoted in the literature [12], given about 9, 86%.
0 5 10 15 20 25 30 35 1 2 3 4 5 6 7 8 9 10 11 12 13 14 15 16 17 18 19 20 21 22 23 24 Time (hours) Ge ne ra te d po w er (M W )
Predicted power Measured power
Fig. 6. Measured and predicted gross power output on 18/07/1991.
A comparison between our results and those of Greenius model [13] (developed by Volker Quaschining, DLR, Germany), for the 16th of April, which corresponds to the best day of the year for the Bechar's site, shows a good correspondence (figure 7). 0 5 10 15 20 25 30 35 40 1 2 3 4 5 6 7 8 9 10 11 12 13 14 15 16 17 18 19 20 21 22 23 24 Time (hours) Ge ne ra te d po w er (M W )
Greenius model Our model
Fig. 7. Comparison between our model and Greenius model for April 16th.
6.2. Results
The daily (equinox and solstices) and the annual (typical year) results of the simulation for Bechar's site, are represented bellow.
6.2.1. Daily results - For the equinox:
0 10 20 30 40 50 60 1 2 3 4 5 6 7 8 9 10 11 12 13 14 15 16 17 18 19 20 21 22 23 24 Time (hours) 0 100 200 300 400 500 600 700 800 900 1000 System efficiency (%) Solar field efficiency (%) Gross power output (MW) Direct normal irradiance (W/m²)
Fig. 8. March 21st 0 5 10 15 20 25 30 35 40 45 50 1 2 3 4 5 6 7 8 9 10 11 12 13 14 15 16 17 18 19 20 21 22 23 24 Time (hours) 0 100 200 300 400 500 600 700 800 900 System efficiency (%) Solar field efficiency (%) Gross power output (MW) Direct normal irradiance (W/m²)l
Fig. 9. September 21st
- For the solstices:
0 10 20 30 40 50 60 1 2 3 4 5 6 7 8 9 10 11 12 13 14 15 16 17 18 19 20 21 22 23 24 Time (hours) 0 100 200 300 400 500 600 700 System efficiency (%) Solar field efficiency (%) Gross power output (MW) Direct normal irradiance (W/m²)
0 5 10 15 20 25 30 35 1 2 3 4 5 6 7 8 9 10 11 12 13 14 15 16 17 18 19 20 21 22 23 24 Time (hours) 0 100 200 300 400 500 600 700 800 900 1000 System efficiency (%) Solar field efficiency (%) Gross power output (MW) Direct normal irradiance (W/m²)
Fig. 11. December 21st
6.2.2 Annual results
Figure 12 illustrates the annual efficiency of the solar field which is about 40.91%.
0 10 20 30 40 50 60 1 8760 Time (hours) S o lar fi el d ef fici en cy ( % )
Fig. 12. Annual efficiency of the solar field
Figure 13 shows the time evolution of the annual generated power. The annual electricity generation is approximately proportional to the DNI. The maximum power reached is 32 MW.
0 5 10 15 20 25 30 35 1 8760 Time (hours) G ros s pow er out p ut ( M W )
Figure 14 shows the variation of the efficiency of the system during the year. The average annual efficiency is about 12%. 0 2 4 6 8 10 12 14 16 18 1 8760 Time (hours) S ystem e ffi ci en cy (% )
Fig.14. Annual efficiency of the system
7. Economical study
The economical considerations of utilising the solar energy for electric generation are the most important aspect in selecting the proper technology to be used in any project and location [3].
If appropriate location is chosen, solar thermal power plants will be economically viable options for the production of electricity.
7.1. Levelized electricity cost calculation
A major consideration in the assessment of the SEGS viability is the analysis of the cost of the electrical energy produced by the system. The lowest cost of energy produced determines the best choice; however, the lowest cost does not mean the best efficiency.
Power plants are compared upon the basis of their Levelized Electricity Cost (LEC), which depends mainly on the capital cost of the plant, annuity factor, annual operation and maintenance costs, the annual production amount of electricity and the plant life. The following equations are used for calculating the LEC:
el
P
F
M
O
CC
a
LEC
=
.
+
&
+
(9) Where:(
)
(
1
)
1
7
.
76
%
1
:
+
=
−
+
+
=
n insurance d n d dK
K
K
K
tor
annuityfac
a
dK
: interest rate = 6% insuranceK
: annual insurance rate = 0.5%n
: depreciation period in years (30 years)M
O
&
: operating and maintenance cost elF
: fuel consumption (solar only mode F=0)The capital cost for solar mode only is about 3,008 $/kWe [14] (inflation rate was included), and the operation and maintenance cost is assumed to be 3% of the capital cost. Thus, the LEC of the selected sites is shown in the table 3:
Table3. LEC of selected sites. Site DNI (kWh/m²yr) Annual electricity production (MWh) LEC ($/kWh) Bechar 2426,14 49139.8 0.19 Timimoune 2255,54 46343.4 0.20 El-Menia 2105,06 42659.1 0.22 Ghardaïa 2097,80 41053.1 0.23
7.2. Cost reduction opportunities:
Here under, we quantify the cost reduction potential of the LEC for some specific opportunities based on Henry Price study [14]:
- Plant scale-up: for solar only mode, increasing the capacity from 30 to 50 MW can reduce the cost by 35% (0.17 to 0.11 $/kWh).
In the case of 50 MW SEGS plant without storage and solar mode only:
- Integrated Solar Combined-Cycle System (ISCCS): replacing Rankine cycle with ISCCS can reduce the cost by 33% (0.11 to 0.073 $/kWh).
- Receiver technology development: replacing the Luz Cermet receiver by the Solel UVAC receiver should reduce the cost of the electricity by 17% (0.133 to 0.11 $/kWh).
- Concentrator size: increasing the size of the concentrator from 100 to 150 m will reduce the cost of the electricity by 9% (0.11 to 0.10 $/kWh).
- Thermal energy storage: adding a thermal storage of 12 hours will reduce the cost of the energy by 4% (0.11 to 0.105 $/kWh).
- Site solar resource: The direct normal solar resource has a significant impact on project economics. Solar ressource from 2333 to 2940 kWh/m²yr will reduce the cost of the energy by 25% (0.147 to 0.11 $/kWh).
8. Conclusion
The SEGS VI plant model provides detailed state-property predictions for both solar field and conventional power Rankine cycle during solar-only operation. This model is used for evaluating the daily and annual performance of such plant under Algerian climate.
Four sites were investigated: Bechar, Timimoune, El-Menia and Ghardaïa. Bechar's site is recommended based on LEC value.
Also, cost reduction along with significant opportunities for reducing the LEC of parabolic trough power plants were mentioned in this paper. Under various realistic scenarios, SEGS plants appear to have the potential to directly compete with fossil power.
Unfortunately, the reality is much more complex, thus the determination of an economically optimised project for a given site does not only depend on the solar irradiation but also on many others influencing parameters.
Solar Electricity Generating Systems are needed to meet the growing electricity demand and are also well suited for replacing the fossil resources to reduce global emissions.
References
[1] El-Sayed M.A.H. "Solar supported steam production for power generation in Egypt", Energy Policy 33(2005)1251–1259. [2] World Energy Outlook, IEA, 2nd edition, Paris, France 2002.
[3] Badran O., M. Eck, "The application of parabolic trough technology under Jordanian climate", Renewable Energy, 31(2006)791–802. [4] Geyer M., Report on the Solar PACES START Mission to Algeria, September 14-18, 2003.
[5] Broesamle H., H. Mannstein, C. Schillings and F. Trieb, "Assessment of solar electricity potential in north Africa based on satellite data and geographic information system", Solar Energy Vol. 70, No. 1, pp. 1–12, 2001.
[6] Stuetzle T., N. Blair, J. W. Mitchell and W. A. Beckman, "Automatic control of a 30 MWe SEGS VI parabolic trough plant", Solar energy, 76 (2004) 187–193.
[7] Pitz-Paal R., S.A. Jones, “A TRNSYS Model Library for Solar Thermal Electric Components (STEC),” A Reference Manual, Release 2.2, 2000.
[8] Lippke F., "Simulation of the Part-Load Behavior of a 30 MWe SEGS Plant", SAND95-1293, Sandia National Laboratories, Albuquerque, 1995.
[9] Quaschning V., R. Kistner and W. Ortmanns, "Simulation of Parabolic Trough Power Plants", 5th Cologne Solar Symposium, Cologne, 21 June 2001, pp. 46-50.
[10] PATNODE A.M., "Simulation and Performance Evaluation of Parabolic Trough Solar Power Plants", Master of Science thesis, University of WISCONSIN, MADISON, 2006.
[11] David W. Kearney, Charles E. Miller, "SEGS VI: Technical Evaluation of Project Feasibility", Submitted to Luz Solar Partners VI, January 1988.
[12] Blair N., R. Cable, S. A. Jones, R. Pitz-Paal, and P. Schwarzboezl, “TRNSYS Modeling of the SEGS VI Parabolic Trough Solar Electric Generating System.”, Proceedings of Solar Forum 2001, April 21-25, 2001, Washington, DC.
[13] Quaschning V., "Green energy system analysis Greenius v3.0", 2001, www.f1.fhtw-berlin.de.
[14] Price H., D. Kearney, "Reducing the cost of energy from Parabolic Trough Solar Power Plants", National Renewable Energy Laboratory, NREL/CP-550-33208, January 2003.
[15] Vernon E. Dudley, Gregory J. Kolb, Michael Sloan and David Kearney, "Test Results SEGS LS-2 Solar Collector", SAND94-1884, Sandia National Laboratories, Albuquerque, 1994.
[16] Quaschning V., W. Ortmanns, R. Kistner and M. Geyer, "Greenius – A new simulation environment for technical and economical analysis for renewable independent power projects", Proceedings of Solar Forum 2001, Solar Energy: The Power to Choose April 21-25, 2001, Washington, DC.
[17] TRNSYS version 15, "A transient system simulation program", Solar Energy Laboratory, University of Wisconsin, USA, 2000. [18] METEONORM Version 5.1x by METEOTEST, www.meteonorm.com.