This is an author-deposited version published in:
http://oatao.univ-toulouse.fr/
Eprints ID: 8673
To link to this article: DOI:
10.1016/j.electacta.2010.03.012
URL:
http://dx.doi.org/10.1016/j.electacta.2010.03.012
To cite this version:
Lei, Yannick and Daffos, Barbara and Taberna,
Pierre-Louis and Simon, Patrice and Favier, Frédéric MnO2-coated Ni
nanorods:
Enhanced
high
rate
behavior
in
pseudo-capacitive
supercapacitor. (2010) Electrochimica Acta, vol. 55 (n° 25). pp.
7454-7459. ISSN 0013-4686
!
Open Archive Toulouse Archive Ouverte (OATAO)
OATAO is an open access repository that collects the work of Toulouse researchers and
makes it freely available over the web where possible.
Any correspondence concerning this service should be sent to the repository
administrator:
[email protected]
!
MnO
2
-coated Ni nanorods: Enhanced high rate behavior in pseudo-capacitive
supercapacitor
Y. Lei
a, B. Daffos
b, P.L. Taberna
b, P. Simon
b,1, F. Favier
a,∗,1aInstitut Charles Gerhardt Montpellier – AIME, UMR 5253, Université Montpellier 2, Place Eugène Bataillon, 34095 Montpellier Cedex 5, France bCIRIMAT UMR CNRS 5085, Université Paul Sabatier Toulouse 3, 31062 Toulouse Cedex 4, France
Keywords: Supercapacitor Manganese dioxide Coating
Nanorods
High rate capacitance
a b s t r a c t
Ni nanorods prepared by electrochemical growth through an anodized aluminium oxide membrane were used as substrate for the electrodeposition of MnO2either in potentiostatic mode or by a pulsed method.
Electrochemical deposition parameters were chosen for an homogeneous deposit onto Ni nanorods. Resulting Ni supported MnO2electrodes were tested for electrochemical performances as nanostructured
negative electrodes for supercapacitors. They exhibited initial capacitances up to 190 F/g and remarkable performances at high charge/discharge rates.
1. Introduction
MnO2 was first proven as performing electrode material for
supercapacitors by Goodenough and co-workers[1,2]. The eluci-dation of the charge storage mechanism involving the Mn4+/Mn3+
redox couple led to the calculation of a maximum theoretical capac-itance of 1100 F/g for a 1 V electroactive potential range [3,4]. However, highest reported capacitances for bulk electrodes have never reached such a high value, but merely 300 F/g[5,6]. Among the main causes pointed out for these limited performances, the limited charge percolation behavior through the material thanks to the poor electrical conductivity of MnO2. Therefore, the use
of MnO2thin films appears an attractive potential route to
over-come this limit: electrochemical reactions at the electrolyte and active material interface take place only few nanometers apart from the current collector (CC) where generated charges are collected. Performances are improved in terms of gravimetric capacitance rel-ative to MnO2content but the total energy stored by the device is
however limited by the small quantity of deposited active material at the planar CC surface. The use of nanostructured CC develop-ing larger surface areas makes then obvious sense. This strategy
∗ Corresponding author at: Institut Charles Gerhardt Montpellier – AIME, UMR 5253, Université Montpellier 2, Place Eugène Bataillon, cc 1502, 34095 Montpellier Cedex 5, France. Tel.: +33 4 67 14 33 32; fax: +33 4 67 14 33 04.
E-mail address:[email protected](F. Favier).
1 ISE member.
has been previously developed and electrochemical performances of MnO2-coated carbon with small mesopores[7]or carbon
nan-otubes[8]composite electrodes have been reported to capacitances at 220 F/g and 141 F/g respectively. The limited accessibility of liq-uid electrolyte to the whole mesoporous volume as well as the limited charge percolation have been pointed out to explain these somehow disappointing performances. Depositing very thin MnO2
films on flat Ni current collectors has led to impressive capacitance values up to 400 F/g[4]. On the other hand, 200 F/g capacitances have been obtained from MnO2deposited onto Ni substrates
nanos-tructured by etching[9].
We have recently reported the preparation of mesoporous carbon/MnO2composite electrode material and showed that the
capacitance extracted from MnO2deposited at the surface of large
mesopores (up to 150 nm in diameter) could reach high value up to 900 F/g (relative to MnO2weight content), close to the maximum
theoretical one [10]. However, the capacitance of the compos-ite electrode itself did not exceed 180 F/g because of the low MnO2content (9 wt% for the most performing electrode) and the
corresponding dead-weight from the mesoporous carbon current collector. It is also anticipated that electrochemical performances could be improved by a more homogeneous dispersion of the active material into the porous volume. In that matter, anodic deposition is an easy and efficient method to perform on monolithic sub-strates as suggested by recent works from Chang et al.[4]. They prepared a nanostructured Ni electrode after a selective electro-chemical stripping of Cu contained in their pristine Cu–Ni alloy co-deposited on an indium-doped tin oxide substrate (ITO). Their
prepared MnO2/Ni composite electrode exhibited attractive
val-ues of capacitance relative to MnO2content up to 500 F/g. On the
other hand, as CC supporting Li-ion battery anode materials, such nanorod architectures have shown they can remarkably accom-modate high charge/discharge rates up to a complete charge or discharge in few minutes using Fe3O4[11], SnO2[12]or other active
materials[13,14]. As a critical step for electrochemical performance in supercapacitors, the charge/discharge behavior of MnO2
sup-ported on ordered Ni nanorods remains unexplored.
In this paper, we are presenting an original electrochemical route for the controlled deposition of an MnO2coating at the surface
of well defined Ni nanorods as well as an exploration of the elec-trochemical behavior of the prepared nanostructured electrodes especially towards charge/discharge rate.
2. Experimental 2.1. Ni nanorods
Ni nanorods supported onto Ni foil (250-mm thick, 10 mm diam-eter, 99% Ni, Goodfellow) were prepared following a procedure as described in a previous work[11]. A two-electrode electrochem-ical cell was used. It included a polished Ni surface as cathode and a Ni anode separated by a Whatman paper and an AAO mem-brane. Whatman paper was used as separator and AAO membrane (Whatman, Anodisc 47, reference #6809 5022) as template for the electrochemical growth of Ni. The plating solution was composed of NiSO4·6H2O (240 g/L), NiCl2·6H2O (20 g/L) and H3BO3 (20 g/L)
(Acros Chemicals). Using an Arbin BT2000 potentiostat, a two-step cathodic current pulse method was used for the preparation: (a) −15 mA/cm2for 50 ms (germination step) then (b) −1 mA/cm2for
250 ms (growth step).
2.2. MnO2coating
Prior to the anodic deposition of MnO2, AAO membrane was
dis-solved in NaOH 1 M (VWR International) etching solution at 80◦C
for 3 min. MnO2 plating solution was composed of MnSO4 2 mM
and K2SO4 25 mM (99%, Aldrich)[15]. Ni nanorods were soaked
with this solution by a vacuum-assisted impregnation method. MnO2coating was first performed by a single-step potentiostatic
method, at Eworkpotentials at 0.85 V and 1.0 V versus Ag-AgCl for
900 s, 1800 s and 3600 s. For comparison purpose, the same electro-chemical parameters were used for the single-step potentiostatic deposition of a layer of MnO2onto a flat Ni foil (Goodfellow). Ni foil
was degreased using acetone before use. Alternatively a two-step potentiostatic pulse method was also used: first step at 0.85 V for 10 s then second step at open circuit voltage (OCV) for 2 s. In that case, the deposition duration corresponded to the time at 0.85 V. For example, the two-step method was repeated 360 times in order to achieve a deposition of 3600 s. The weight of deposited MnO2
was determined by integration of the total coulombic charges used for deposition over electrolysis durations. Weights were evaluated at mMnO2=0.254 mg and 0.339 mg for the two-step depositions
onto Ni nanorods at 0.85 V for 3600 s and 7200 s respectively. 0.250 mg of MnO2was deposited by two-step electrolysis at 0.85 V
for 3600 s onto the flat Ni foil. The total charge Q was calcu-lated by integration of the measured current with respect to the time of deposition. This led to the weight of deposited material mMnO2= Q × MMnO2/2F, with F the Faraday constant. This weight
is however over-estimated since at working potentials of 0.85 or 1.0 V/Ag–AgCl, a part of the charge is used for water oxidation and oxygen evolution.
2.3. Characterizations
The resulting electrodes were analyzed by Scanning Electron Microscopy (SEM, JEOL JSM6300F), Cyclic Voltammetry (CV) and Electrochemical Impedance Spectrosocopy (EIS).
The electrochemical cell was a conventional three electrode cell composed of an Ag–AgCl as reference electrode, a Pt foil as counter-electrode and the composite electrode as working electrode. Electrochemical characterizations were performed in a K2SO40.5 M electrolytic solution at room temperature using a
Bio-logic VMP3 potentiostat running under EC-Lab software.
3. Results
3.1. Raw Ni nanorods
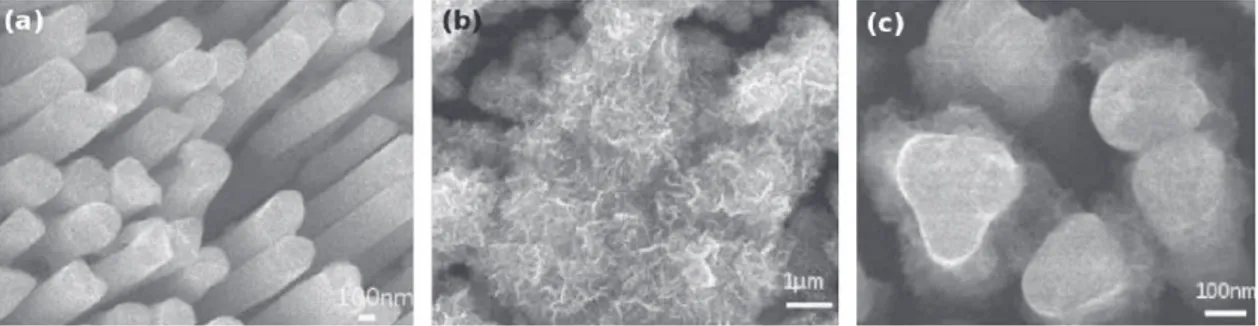
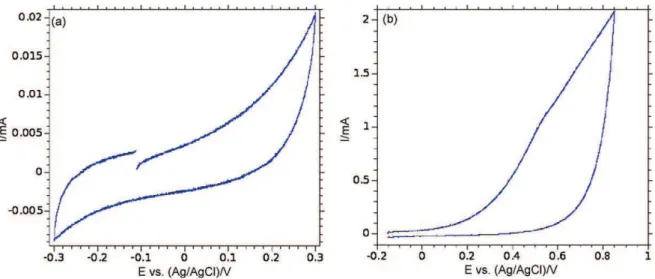
The SEM picture showed inFig. 1a depicts a quite perfect and dense array of Ni nanorods after dissolution of the AAO mem-brane. They are about 200 nm in diameter and 5 mm long. As electrochemically grown onto the Ni electrode, they are strongly mechanically and electrically bonded to the metal substrate build-ing a self-supported nanostructured electrode suitable for further active material electrodepositions and tests. As shown inFig. 2a from a CV in K2SO4 0.5 M at s = 10 mV/s, this electrode made
of raw Ni nanorods exhibits a very limited capacitive behavior (3.5 mF/cm2relative to the footprint area of the Ni substrate) in
a narrow electrochemical window (from −0.3 to 0.3 V/Ag–AgCl).
Fig. 2b shows a CV of the same electrode in the same potential window as usually used for the electrochemical investigations on MnO2-based electrode material (from −0.05 V to 0.85 V/Ag–AgCl).
Actually, it mostly shows the oxygen evolution reaction occur-ring at Ni surface at potentials higher than 0.6 V/Ag–AgCl. MnO2
deposition potential was extracted from CVs performed in MnSO4
2 mM and K2SO4 25 mM plating solution (Fig. 3). An oxidation
peak (EOx) corresponding to the oxidation on Mn2+to Mn4+and
MnO2 surface deposition was observed at about 1.0 V. A
poten-tial window from 0.85 V to 1.0 V was found as suitable for MnO2
deposition.
Fig. 1. SEM micrograph of raw Ni nanorods (a) used as substrate for the electrodeposition of MnO2and MnO2electrodeposited at 1.0 V/Ag–AgCl for 3600 s (b) and at
Fig. 2. CV measured of raw Ni nanorods in K2SO40.5 M to evaluate its capacitance (a) and its stability in a larger potential range (b).
3.2. MnO2coating, single-step potentiostatic method
Ni nanorods were first used for MnO2electrodeposition at
con-stant potentials, respectively 1 V and 0.85 V/Ag-AgCl. SEM picture inFig. 1b shows that, at 1.0 V/Ag-AgCl potential, most of MnO2was
deposited at the top of the nanorods. The same deposit morphol-ogy was obtained whatever the electrolysis duration. In contrast, at Eworksets to 0.85 V/Ag-AgCl, Ni nanoplot surface could be more
homogeneously coated by MnO2(Fig. 1c) for both 1800 s and 3600 s
electrolysis durations. At both working potentials, MnO2deposits
are composed of dense layers or aggregates of highly disordered nanosheets. The evaluation of electrochemical performances by CV measurements (Fig. 4) exhibits capacitances about C1= 130 F/g
at first charge/discharge cycle. This initial capacitance value from MnO2deposit obtained at 0.85 V/Ag-AgCl strongly decreases during
the first 100 cycles before to stabilize at 80 F/g after 500 cycles. In contrast, the low capacitance value at 80 F/g obtained at first cycles for MnO2deposit prepared at 1.0 V/Ag-AgCl, slowly increases upon
cycling up to 100 F/g after 500 cycles (Fig. 4b).
3.3. MnO2coating, two-step potentiostatic method
To improve the deposit morphology onto the nanorods, an alter-native two-step potentiostatic method has been used. It included a rest period at open circuit after a short potentiostatic pulse for
Fig. 3. CVs performed in the platting solution using a Ni nanorods substrate.
material growth. This rest step aims to limit the Mn2+ions
deple-tion close to the Ni surface, avoiding thus a diffusion-controlled deposition reaction. MnO2depositions were carried out for 3600 s
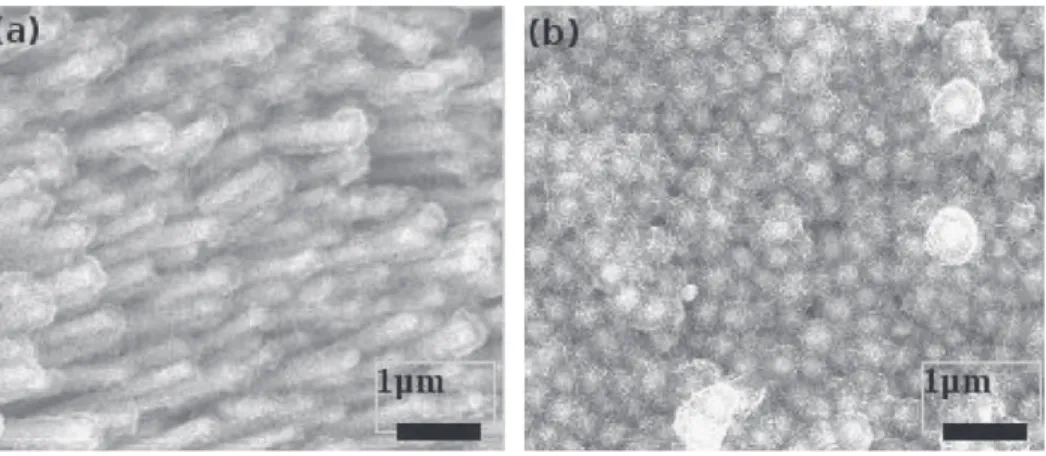
(360 cycles of the two-step method) and 7200 s (720 cycles). SEM pictures inFig. 5show the electrode surface after 3600 s (a) and 7200 s (b) deposition times. Micrographs show that the voids in between the nanorods are filled more homogeneously using these electrodeposition experimental parameters. The whole surface of the nanorods, top and sides, is covered by an MnO2 layer whose
thickness obviously depends on the electrolysis duration or num-ber of electrolysis cycles. However, some voids are still present between the rods to allow electrolyte impregnation. The layered nanostructure is clearly evidenced by electronic contrast showing the bright Ni core of the nanorods and the gray MnO2deposit.
The capacitance of the 3600 s-electrode was evaluated by CV ran at various scan rates. The evolution depicted inFig. 6a shows that capacitances are hardly affected by the scan rates even at high scan rates while remaining close to 100 F/g. The electrochemical capacitance of the 7200 s-electrode was measured at C1= 190 F/g
for the first cycle. This quite high value progressively fade down upon cycling and, after 500 cycles, a 20% loss was observed with C500= 150 F/g.
3.4. Electrochemical impedance spectroscopy (EIS)
EIS analyses were performed at open circuit voltage (OCV) in K2SO4, 0.5 M after 1–5–10–50–100–500 cycles of charge/discharge
at 10 mV/s scan rate. The MnO2/Ni nanorods composite electrodes
were stabilized at OCV for 1 hour prior to the experiments per-formed with U = ±10 mV around OCV in the 10−2 to 50.103 Hz
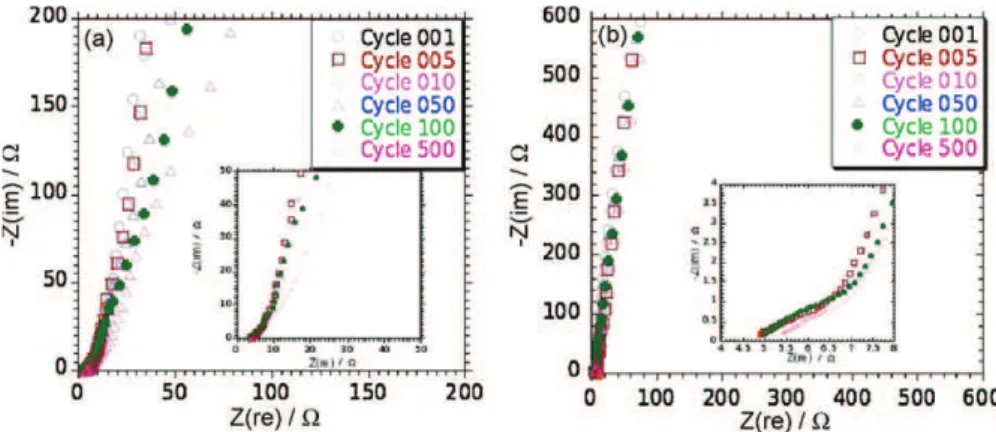
frequency range. The corresponding Nyquist plots depicted inFig. 7
were fitted by the Zfit routine from EC-Lab software, used to mon-itor the experiments.
For the electrode prepared by the single pulse method, EIS analyses did not show any loop at high frequencies characteristic to parallel RC circuit for composite highly porous electrode. Nei-ther could be observed any Warburg-like element, characteristic to semi-infinite diffusion or migration in the porous structure of the electrode[16]. Nyquist plots are characteristic of the non-ideal capacitance behavior of the thick MnO2 layer deposited onto Ni
nanorods since the increase of the imaginary part of the impedance at low frequency deviated from the theoretical vertical line. This non-ideality may originate from slow MnO2 dissolution as
sol-vated Mn3+or redox leaking currents from impurities present in the
Fig. 4. CV of MnO2-coated Ni nanorods (single-step method, 1 V for 900 s) in K2SO40.1 M (a). Evolution of capacitance upon cycling of an MnO2-coated Ni nanorods electrode
(b). Deposition performed by single-step potentiostatic method at 1.0 V for 900 s (triangles, mMnO2=0.0177 mg) and at 0.85 V for 1800 s (squares, mMnO2=0.0545 mg).
Fig. 5. MnO2deposited by two-step potentiostatic pulse method at 0.85 V for 3600 s (a) and 7200 s (b) on Ni nanorods.
the two-step pulsed method, Nyquist plots exhibit a semi-infinite diffusion (Warburg element) as well as a non-ideal capacitance behavior. A small loop might also be observed at high frequencies. Above 50 cycles, the general shape of the plots changes and the low frequency capacitive behavior shifts along the X-axis to higher resistance.
4. Discussion
4.1. Single-step potentiostatic method
Use of a high anodic working potential (anodic over-potential) leads to an uncontrolled growth of MnO2onto Ni nanorods. At 1.0 V,
Fig. 6. Evolution of capacitance versus scan rates (a) for MnO2-coated Ni nanorods (squares, two-step potentiostatic pulse method, 0.85 V for 3600 s) and MnO2-coated Ni
flat substrate ( , two-step potentiostatic pulse method, 0.85 V for 3600 s). Capacitances are relative to the weight of deposited MnO2and geometric surface of the electrode.
Fig. 7. EIS analyses upon cycling were performed on Ni nanorods coated by MnO2by single-step method (at 0.85 V for 900 s (a) and by two-step potentiostatic pulse method
for 7200 s (b)).
the growth kinetics are so high as compared to the diffusion of Mn2+through the nanoplot network that quickly, species suitable
for oxidation are made available only at the top surface of the elec-trode, which is easily accessible for mass transfer. At such a high potential, the growth mechanism is similar to that on a flat elec-trode: deposit is quite thick and covers only the top of the nanorods (Fig. 1b). Another effect can account for this behavior since the high current density induced by tip effect favors MnO2deposition
pref-erentially on the nanoplot tops. Decreasing the potential applied to 0.85 V obviously allows a better control for a more uniform growth of MnO2in between the nanorods as well as on their tops (Fig. 1c).
The decrease of the anodic over-potential allows a more kinetically controlled oxidation process more compatible with the diffusion of Mn2+species to the electrolyte/electrode interface. At such a
poten-tial, the corresponding current density is however rather limited as is the quantity of deposited MnO2.
A comparison of the capacitances measured from the CVs for raw nickel nanorods (Fig. 2b) and those for the same nanostruc-tured substrate covered with a MnO2layer (Fig. 4a) demonstrates
that, the electrochemical contribution of Ni substrate to the overall electrode capacitance is fairly limited (less than 5%) whatever the electrolysis parameters selected for the deposition of MnO2. This
limited contribution originates from the oxidation of Ni metal to form an Ni(OH)2protective passivation layer[18]. It also depends
on the coverage of the nickel substrate by MnO2layer. As shown in Fig. 2b, Ni passivation occurs mild pH range at potential greater than 0.3 V/Ag/AgCl. The electrode prepared by MnO2 deposition
at 1.0 V shows a behavior close to what is usually observed for a MnO2-based bulk electrode, i.e. capacitance increases during
the first tens of cycles before to stabilize to a threshold value (Fig. 4b)[19]. This behavior points out that MnO2 layer is, in this
case, quite thick. The same behavior has already been observed for thick MnO2films precipitated at the surface of porous carbons [10].
In contrast, the capacitance of Ni nanoplot supported MnO2
pre-pared at 0.85 V quickly fades down upon cycling as demonstrated by the 30% loss of the initial capacitance after 500 cycles (Fig. 4b). This trend is characteristic of a thin layer of active material. This later point is also supported by the initial capacitance at 135 F/g, higher than the initial capacitance measured for the electrode pre-pared by deposition at 1.0 V. Noteworthy is the relatively low value for this initial capacitance while MnO2 thin films have shown
capacitances up to 900 F/g[20]. Obviously, decreasing the work-ing potential from 1.0 V to 0.85 V has enhanced the homogeneity of the deposit and improved the electrochemical performances of the MnO2/Ni nanorods electrode. However in both cases, the
depo-sition remains controlled by diffusion of the Mn2+species through
the nanostructure towards the nanoplot surface where the oxida-tion to Mn4+and subsequent MnO
2deposition proceed. A pulse
method has been developed to allow an optimal supplying of Mn2+
species in the constrained volume built by the nanoplot network, making them available for oxidation at the platting solution/nickel nanoplot interface.
4.2. Two-step potentiostatic method
The working potential at 0.85 V was applied for 10 s and fol-lowed by a resting step at open circuit voltage (OCV) for 2 s. This scheme has been repeated over 360 and 720 cycles. By using this method, Ni nanorods appeared as coated individually by MnO2
(Fig. 5). To evaluate the weight of deposited MnO2 (mMnO2), the
total charge has been calculated by integration of the current of each 0.85 V step through 10 s electrolysis duration. From this more homogeneous MnO2layer, higher performances were expected and
hence initial capacitance was measured at C1= 190 F/g. The
capac-ity retention, far from perfect, was improved too since the capaccapac-ity loss was limited to 20% after 500 cycles (Fig. 6b).
For electrodes prepared by both deposition approaches capacity fadings are characteristic of a progressive dissolution of the elec-troactive material thanks to obviously too high upper potential limit used for these long term cycling tests. The potential win-dow used was first adjusted to extract the highest initial capacity and has obviously not been optimised for long term cycling. It also corresponds to the potential window used in previous studies on capacitive behavior of MnO2 electrodeposited on stainless-steel
substrates[15].
As demonstrated inFig. 6a, the most remarkable result lies in the maintain of high capacitance values of the 3600 s-electrode under high charge/discharge rate. For comparison purpose, MnO2 was
electrodeposited on a flat Ni substrate using the same electrolysis parameters as previously described for the 3600 s-electrode. Elec-trode surface composed of disordered MnO2 nanosheets is close
to what has been observed for MnO2deposits onto flat
stainless-steel surfaces[15].Fig. 6a depicts the capacitance of such a deposit as a function of the applied scan rate: the higher the scan rate, the lower the capacitance. The same behavior has been observed using thin films deposited onto flat Ni current collectors. It is characteristic of MnO2bulk electrode for which capacitances are
fading for higher scan rate because of the diffusion limitation of electrolytic species in the material structure[21]. In contrast, the maintain of the capacitance in the whole scan rate range explored in this study, can be explained by the facile diffusion of electrolyte ions through the open structure provided by Ni nanorods.
4.3. Electrochemical impedance spectroscopy (EIS)
EIS analyses confirm the idea of a diffusion of electrolyte through the MnO2-coated Ni nanorods facilitated by the electrode open
structure and leading to high capacitances at high scan rates. The EIS plot inFig. 7a is typically the one observed for a compact MnO2film
since there is no diffusion limitation. However, the absence of any diffusion like behavior at 45◦generally observed for highly porous
electrodes[16,17]and usually described using a Transmission Line Model of a combination of series—parallel RC circuits[16]evidences the absence of porosity inside the MnO2film structure. The change
in the plot slope above 50 cycles in the low frequency region where the capacitive behavior can be seen indicates an increase of the charge transfer resistance during cycling that can be assigned to the slow dissolution of MnO2.
The main differences with the plot presented inFig. 7b is the presence of a Warburg-like sloppy behavior in the middle fre-quency range [16]. This stands for the ion migration inside the porosity of the electrode: the lower the frequency, the deeper the penetration of ions from the electrolyte into the depth of the elec-trode[17]. The MnO2 coating obtained under pulsed galvanostatic conditions was found to be thin and conformal onto the Ni rods, leading to an open porous structure for the whole film as compared to what was obtained inFig. 7a. The EIS plots confirm this difference. Another difference between the two films is that the low frequency range of the Nyquist plot inFig. 7b is not so affected by the cycle number as compared toFig. 7a. The MnO2dissolution, responsible
for the change observed inFig. 7a for potentiostatic deposited films, is slowing down for MnO2 films with an open porous structure
thanks to the Ni nanorods. InFig. 7b, an increase in the impedance at high frequency is measured after 500 cycles. Since it is the dom-inant effect in this frequency range, it is usually associated to an increase in the electrolyte resistance upon cycling. This is usually true, as long as electrode remain unchanged, both chemically or geometrically. In the present case, it certainly comes from a resis-tance increase upon cycling because of the progressive passivation of the electrode at the solid–liquid interface. The generation of a complex nickel/manganese oxide such as NiMnO2at the interface
could originate for the observed impedance increase. 5. Conclusions
Ni nanorods prepared by electrochemical growth through a porous AAO membrane have been successfully used as substrate for the controlled electrochemical deposition of MnO2. Continuous
and pulse potentiostatic methods have been used resulting in the deposition of MnO2 of distinct morphologies. The latter method
led to more homogeneous deposits at the nanoplot surfaces for a maintain of the original open structure. The best electrochemical performances exhibited capacitances up to 190 F/g with a loss of about 20% after 500 cycles. The evaluation of the scan rate impact on capacitance pointed out an outstanding behavior: in contrast with what is usually observed for bulk MnO2-based electrodes, in the
present cases, capacitances remain high at high charge/discharge rates. This behavior was confirmed by EIS analyzes showing that MnO2-coatings seem thin enough and uniformly distributed to give
the prepared MnO2/Ni electrode a porous structure facilitating the
diffusion of electrolytic species through the whole electrode vol-ume. Such remarkable behavior highlights potential applications for these prepared MnO2/Ni nanorods electrodes in high-power
micro-devices. References
[1] H.Y. Lee, J.B. Goodenough, J. Solid State Chem. 144 (1999) 220.
[2] H.Y. Lee, V. Manivannan, J.B. Goodenough, Comp. Rendus l’Acad. Sci., Ser. IIC: Chem. 2 (1999) 565.
[3] M. Toupin, T. Brousse, D. Belanger, Chem. Mater. 16 (2004) 3184.
[4] J.-K. Chang, S.-H. Hsu, W.-T. Tsai, I.-W. Sun, J. Power Sources 177 (2008) 676. [5] M.-W. Xu, D.-D. Zhao, S.-J. Bao, H.-L. Li, J. Solid State Electrochem. 11 (6) (2007)
1101.
[6] C.C. Hu, T.W. Tsou, Electrochem. Commun. 4 (2002) 105.
[7] X.P. Dong, W.H. Shen, J.L. Gu, L.M. Xiong, Y.F. Zhu, Z. Li, J.L. Shi, J. Phys. Chem. B 110 (2006) 6015.
[8] E. Raymundo-Pinero, V. Khomenko, E. Frackowiak, F. Beguin, J. Electrochem. Soc. 152 (2005) A229.
[9] S.J. Pan, Y.J. Shih, J.R. Chen, J.K. Chang, W.T. Tsai, J. Power Sources 187 (2009) 261.
[10] Y. Lei, C. Fournier, J.L. Pascal, F. Favier, Micropor. Mesopor. Mater. 110 (2008) 167.
[11] L. Taberna, S. Mitra, P. Poizot, P. Simon, J.M. Tarascon, Nat. Mater. 5 (2006) 567.
[12] L. Bazin, S. Mitra, P.L. Taberna, P. Poizot, M. Gressier, M.J. Menu, A. Barnabe, P. Simon, J.M. Tarascon, J. Power Sources 188 (2009) 578.
[13] J. Hassoun, S. Panero, P. Simon, P.L. Taberna, B. Scrosati, Adv. Mater. 19 (12) (2007) 1632.
[14] C. Villevieille, F. Robert, P.L. Taberna, L. Bazin, P. Simon, L. Monconduit, J. Mater. Chem. 18 (48) (2008) 5956.
[15] Y.K. Zhou, M. Toupin, D. Bélanger, T. Brousse, F. Favier, J. Phys. Chem. Solids 67 (2006) 1351.
[16] R. de Levie, Electrochim. Acta 9 (1964) 1231.
[17] P.L. Taberna, P. Simon, J.F. Fauvarque, J. Electrochem. Soc. 150 (2003) A292. [18] R.J. Smith, R.E. Hummel, J.R. Ambrose, Corros. Sci. 27 (8) (1987) 815. [19] T. Brousse, P.L. Taberna, O. Crosnier, R. Dugas, P. Guillemet, Y. Scudeller, Y. Zhou,
F. Favier, D. Bélanger, P. Simon, J. Power Sources 173 (2007) 633.
[20] S.C. Pang, M.A. Anderson, T.W. Chapman, J. Electrochem. Soc. 147 (2000) 444. [21] M. Toupin, T. Brousse, D. Belanger, Chem. Mater. 14 (9) (2002) 3946.