an author's https://oatao.univ-toulouse.fr/26971
https://doi.org/10.1016/j.icarus.2020.114060
Chide, Baptiste and Murdoch, Naomi and Bury, Yannick,... [et al.] Experimental Wind Characterization with the SuperCam Microphone under a Simulated martian Atmosphere. (2021) Icarus, 354. 114060-114072. ISSN 00191035
Experimental Wind Characterization with the SuperCam
1
Microphone under a Simulated Martian Atmosphere
2
Baptiste Chidea,b, Naomi Murdocha, Yannick Burya, Sylvestre Mauriceb, Xavier Jacobc,
3
Jonathan P. Merrisond, Jens J. Iversend, Pierre-Yves Meslinb, Marti Bassas-Port´usa,
4
Alexandre Cadua, Anthony Sournaca, Bruno Duboise, Ralph D. Lorenzf, David Mimouna,
5
Roger C. Wiensg
6
aInstitut Sup´erieur de l’A´eronautique et de l’Espace (ISAE-SUPAERO), Universit´e de Toulouse, 31400
7
Toulouse, France
8
bIRAP-CNRS, Universit´e Toulouse III, 31400 Toulouse, France
9
cIMFT-CNRS, Universit´e Toulouse III, 31400 Toulouse, France
10
dDepartment of Physics and Astronomy, University of Aarhus, Aarhus, Denmark
11
eObservatoire Midi-Pyr´en´ees (OMP), Universit´e de Toulouse, Toulouse, France
12
fJohns Hopkins Applied Physics Laboratory, Laurel, MD 20723, USA
13
gLos Alamos National Laboratory, Los Alamos, NM 87545, USA
14
Abstract
15
Located on top of the mast of the Mars 2020 Perseverance rover, the SuperCam instrument
16
suite includes a microphone to record audible sounds from 100 Hz to 10 kHz on the surface
17
of Mars. It will support SuperCam’s Laser-Induced Breakdown Spectroscopy investigation
18
by recording laser-induced shock-waves but it will also record aeroacoustic noise generated
19
by wind flowing past the microphone. This experimental study was conducted in the Aarhus
20
planetary wind-tunnel under low CO2 pressure with wind generated at several velocities. It
21
focused on understanding the wind-induced acoustic signal measured by microphones
instru-22
mented in a real scale model of the rover mast as a function of the wind speed and wind
23
orientation. Acoustic spectra recorded under a wind flow show that the low-frequency range
24
of the microphone signal is mainly influenced by the wind velocity. In contrast, the higher
25
frequency range is seen to depend on the wind direction relative to the microphone. On the
26
one hand, for the wind conditions tested inside the tunnel, it is shown that the Root Mean
27
Square of the pressure, computed over the 100 Hz to 500 Hz frequency range, is proportional
28
to the dynamic pressure. Therefore, the SuperCam microphone will be able to estimate the
29
wind speed, considering an in situ cross-calibration with the Mars Environmental Dynamic
30
Analyzer. On the other hand, for a given wind speed, it is observed that the root mean square
of the pressure, computed over the 500 Hz to 2000 Hz frequency range, is at its minimum
32
when the microphone is facing the wind whereas it is at its maximum when the microphone
33
is pointing downwind. Hence, a full 360° rotation of the mast in azimuth in parallel with
34
sound recording can be used to retrieve the wind direction.
35
We demonstrate that the SuperCam Microphone has a priori the potential to determine both the wind speed and the direction on Mars, thus contributing to atmospheric science investigations.
Keywords: Mars 2020 Perseverance rover, SuperCam Instrument, Mars Microphone,
36
Atmosphere, Wind speed, Wind orientation
37
1. Introduction
38
The lower layers of the Mars atmosphere, the planetary boundary layer, that extends
39
from the surface to the free atmosphere, mediates exchanges of heat, volatiles and dust via
40
complex and highly variable wind fields interacting with the ground (seeRead et al.(2016)
41
for a detailed review). This highly dynamical layer follows an important diurnal cycle: during
42
the daytime, the low heat capacity of the Martian soil induces a rapid heating, yielding
43
thermal instabilities (Smith et al., 2004) and vertical convective winds (Spiga et al., 2010).
44
When solar insolation is at its maximum, stronger convective vortices, called dust-devils,
45
become active, lifting dust at high rotating wind speed, at several tens of meters per second
46
(Balme and Greeley, 2006). At night, the planetary boundary layer reduces to a stable and
47
stratified layer where surface wind velocity is at its minimum (Read et al.,2016). Additionally,
48
this lower part of the Martian atmosphere sustains a strong influence of local and regional
49
topography: in terrains with a topography gradient, the nocturnal near-surface air cools,
50
causing downslope katabatic winds whereas the opposite upslope wind takes place in the
51
afternoon (Spiga,2011).
52
The behavior of the Martian winds near the surface has been supported by several in
53
situ measurements from landed missions including Vikings 1 and 2 (Hess et al.,1977), Mars
54
Pathfinder (Schofield et al.,1997), Phoenix (Holstein-Rathlou et al.,2010), Curiosity (Vi´
udez-55
Moreiras et al.,2019); all landed in the northern hemisphere of the planet. A review of this
56
full data set (Mart´ınez et al., 2017) points out that wind measurement on Mars has been
57
challenging, due in part to challenges of calibration, and in some cases to hardware failures.
58
Measurements in flat plains exhibit a seasonal variability due to the global circulation with
59
a mean wind speed at its minimum during northern spring and summer (∼3 m s−1 measured
60
by the Viking 2 lander with a maximal peak value up to 8 m s−1) and at its maximum during
61
northern fall and winter (mean value around 5 m s−1 but with a maximum that reaches
62
24 m s−1 also for the Viking 2 lander). A full 360° progressive rotation of the wind direction
63
over a sol is experienced for flat terrains whereas a sudden diurnal transition from upslope to
64
downslope wind is seen in Curiosity data, due to the close proximity of Mount Sharp. Winds
are also seen to respond to weather events such as dust storms with an increase of the wind
66
magnitude during those events.
67
The InSight mission, which landed on November 2018, carries the Auxiliary Payload
Sen-68
sor Suite (APSS) which includes a pair of wind sensor booms that allow monitoring of Martian
69
winds with an unprecedented time coverage (Banfield et al., 2018). Continuous
measure-70
ments over 220 sols (Banfield et al.,2020) characterized the diurnal variability with a mean
71
wind speed up to (10 ± 4) m s−1 (1σ standard deviation) during the day that can reach a
72
maximal value up to 24 m s−1. At night, during the quieter regime after sunset, it decreases
73
to (2.0 ± 0.8) m s−1. Moreover, wind direction reverses from northeast during the day to
74
southeast at night, showing the topographic forcing of the wind. Furthermore, as part of
75
the InSight APSS weather station, a pressure sensor continuously samples the atmosphere
76
with a sampling frequency up to 20 Hz (Spiga et al., 2018), higher than any other previous
77
instruments. It allows the detection of various atmospheric phenomena (Banerdt et al.,2020;
78
Murdoch et al., submitted), such as lots of dust-devil-like convective vortices and their
as-79
sociated pressure drops, or infrasounds detected via the seismometer SEIS (Martire et al.,in
80
press). Daytime turbulence is also studied in this new frequency domain (power spectrum
81
from 50 mHz to 5 Hz), providing new insights into the behavior of mechanisms generating
82
high-frequency pressure fluctuations.
83
84
Scheduled for landing in Jezero crater in February 2021, the Mars2020 Perseverance
85
rover will include the Mars Environmental Dynamic Analyzer (MEDA, de la Torre Juarez
86
et al. (2020)), a weather station located 1.6 m above the ground, that has heritage from
87
REMS onboard Curiosity and the wind sensors of APSS onboard InSight. It is designed to
88
measure horizontal wind speeds up to 70 m s−1and vertical wind speeds up to 10 m s−1with
89
an accuracy of 1 m s−1 over the two axes. The horizontal wind direction is expected to be
90
retrieved with a precision of ± 15°. Integrated on top of the rover mast at a height of 2.1 m,
91
the SuperCam remote-sensing suite (Wiens et al., 2017) includes a microphone, co-aligned
92
with the telescope line of sight, which will record pressure fluctuations in the 100 Hz to 10 kHz
93
frequency bandwidth. It has been demonstrated that listening to laser-induced sparks from
94
rocks and soils can complement the Laser-Induced Breakdown Spectroscopy investigation
95
(Chide et al.,2019). Moreover the speed of sound can be deduced from sound wave arrival
96
time and used to evaluate the air temperature and thermal gradient (Chide et al.,2020). The
97
SuperCam microphone can also monitor sounds generated by the rover, and contribute to
98
basic atmospheric science, thanks to a dedicated standalone mode to record natural sounds
99
for up to 2 min 46 sec at a time, at different pointing directions in azimuth and elevation.
100
Sampling frequency can be set at 25 kHz or 100 kHz.
101
102
Wind-induced pressure fluctuations that pass over microphone membranes result in
random-103
like signal called acoustic noise. Often considered on Earth detrimental to outdoor
mea-104
surements, wind-generated noise has been frequently studied in order to design appropriate
105
windscreens to reduce it (Strasberg,1988). In the context of the SuperCam Microphone, the
106
atmospheric and wind-induced noise represents a data set of interest. Morgan and Raspet
107
(1992) conducted an experimental comparison between outdoor wind noise with sound
pres-108
sure fluctuations in the 1.6 Hz to 1250 Hz frequency range. Following this study, two sources
109
of wind noise can be distinguished: the pressure fluctuation caused by the intrinsic turbulence
110
of the incoming flow and the noise induced by interaction between the flow, the microphone
111
and its nearby spatial environment. First, the turbulence spectrum of the incoming flow can be
112
separated into frequency ranges that follow the turbulence regimes of the atmosphere (Walker
113
and Hedlin,2009;Murdoch et al.,2016): at very low frequencies, a source region where most
114
of the energy is contained in large scale eddies. Then, the mixing of the atmosphere breaks
115
its large scale eddies into smaller scale eddies without energy loss. This inertial regime at
116
intermediate frequencies can be represented by a power law with an expected spectral slope
117
of −5/3 according to the Kolmogorov theory (Kolmogorov, 1991). At higher frequencies
118
when eddies reach the Kolmogorov scale, friction forces are dominant and their kinetic
en-119
ergy is dissipated into heat. During this dissipation regime, the power spectrum drops very
120
sharply. The noise induced by interaction between the flow and the microphone has a lower
level and is expected to depend on the orientation of the microphone relative to the wind
122
flow (Morgan and Raspet,1992). Bass et al.(1995) made use of the travel time of turbulent
123
eddies transported into the wind flow to determine the wind speed and orientation using an
124
array of three microphones. In an experimental campaign conducted in the same facility as
125
this study, Lorenz et al. (2017) performed the first qualitative approach of the correlation
126
between the microphone noise spectrum and wind speed under controlled Martian conditions.
127
128
Vortices or turbulent structures generated in the wake and around the SuperCam
in-129
strument can impact acoustic measurements made by the Mars Microphone by imposing
130
fluctuations of the pressure field in the vicinity of the instrument. These fluctuations will
131
depend on the position of SuperCam relative to the wind. Previous computational fluid
dy-132
namics simulations in the vicinity of the Perseverance vehicle (Bardera-Mora et al., 2017)
133
have shown that the flow is attached upstream of the mast while the downstream velocity
134
field is strongly modified by the presence of the mast. A comprehensive understanding of the
135
interaction between the wind and the instrument could help to determine the wind’s speed
136
and direction, which are of great interest to Mars atmospheric science. This study presents
137
the results of an experimental campaign conducted in a wind tunnel under a simulated
Mar-138
tian atmosphere with a full-scale model of the Perseverance mast equipped with microphones
139
and pressure sensors. It aims to explore the potential of the SuperCam microphone to retrieve
140
wind properties such as its speed and direction.
141
2. Experimental configuration
142
The wind calibration tests were conducted in the Aarhus Wind Tunnel Simulator II
(AWT-143
SII) in Denmark (Holstein-Rathlou et al.,2014). This facility can uniquely reproduce
plane-144
tary atmospheres. Specifically, it can simulate typical Mars surface conditions including a low
145
pressure CO2 atmosphere with winds using a recirculating wind tunnel. It is also equipped
146
with a full set of internal sensors to monitor atmospheric parameters such as pressure,
tem-147
perature and humidity. The test campaign described in this paper was conducted at ambient
148
temperature (∼23◦C) and under a 10 mbar absolute pressure. This results in a 0.02 kg m−3
149
atmospheric density, similar to Mars, which has typical temperatures ranging from −135◦C
150
to 20◦C and a mean atmospheric pressure around 6 mbar. A double square-meshed metallic
151
grid, with a wire spacing of 1 mm was placed at the middle of the tunnel to introduce a
152
controlled level of turbulence down to 10%. Considering an ideal gas law, these atmospheric
153
parameters lead to a speed of sound of 276 m s−1 inside the chamber.
154
155
To simulate as close as possible the flow generated around the SuperCam instrument, a
156
full-scale 3D-printed mock-up of the upper part of the Perseverance rover mast was mounted
157
inside the tunnel (Fig. 1a). It was equipped with three microphones (Knowles Electret
con-158
denser microphones, model EK-23132) that came from the same batch as the SuperCam
159
microphone flight model. The first one (front microphone) was placed in the same position
160
as the SuperCam instrument microphone, at the bottom left of the window. The second one
161
(side microphone) was located on the side of the Remote Warm Electronic Box (RWEB) that
162
covers SuperCam, and the last one (interior microphone) inside the RWEB, protected from
163
the wind flow (see Fig. 1for the locations of the microphones). Two additional microphones
164
(upwind and downwind microphones) were placed in front of and behind the mock-up,
re-165
spectively, to study the upwind and downwind flow. Two barometers (Paroscientific absolute
166
pressure sensors, Model 215A-102) were also part of the mock-up payload: one at the
bot-167
tom right of the window (front barometer) and the other one on the side of the RWEB
168
(side barometer), below the microphone. A full schematic is shown in Fig. 1a and pictures
169
are provided in Figs1b,c. This instrumented mast was attached to a rotating plate so that
170
its orientation could be changed relative to the wind flow. The SuperCam angle relative
171
to the wind is defined in Fig. 1d, with azimuthal angles increasing counterclockwise from
172
the direction of the flow. This will be used as the reference for data interpretation. The
173
positions of the upwind and downwind microphones were left unchanged during the entire
174
set of measurements.
175
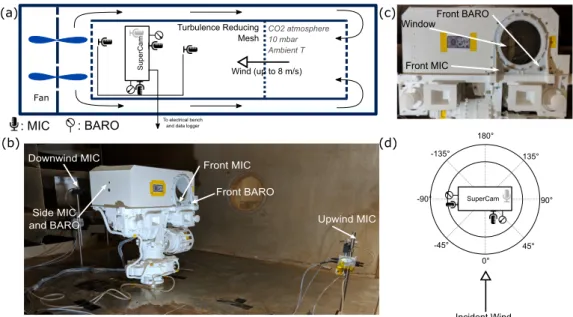
Front MIC Upwind MIC Front BARO Downwind MIC Side MIC and BARO CO2 atmosphere 10 mbar Ambient T Turbulence Reducing Mesh Wind (up to 8 m/s) Super Cam To electrical bench and data logger
Fan Front MIC Front BARO Window SuperCam 0° 45° 90° -45° -90° -135° 180° 135° Incident Wind : MIC : BARO (a) (c) (b) (d)
Figure 1: (a) Schematic of the SuperCam/Microphone wind calibration test set-up. (b) Photo of the Mars2020/SuperCam mast instrumented with microphones and barometers. (c) Close-up view of the Re-mote Warm Electronic Box (RWEB) equipped with a Mars Microphone and a barometer. (d) Definition of the SuperCam angle relative to the wind. MIC: Microphone, BARO: Barometer
Each microphone was connected to SuperCam-like front-end-electronics boards with two
177
stages of amplification, providing an amplification factor of 62. The resulting sensitivity was
178
1.4 V Pa−1. The front-end-electronics were specifically adjusted for these tests to optimize
179
the microphone bandwidth in the 10 Hz to 10 kHz frequency range. The microphone
sam-180
pling frequency was set at 200 kHz. The barometric measurement system included the two
181
absolute pressure transducers with their dedicated acquisition and processing boards. The
182
measurement ranges were from 0 to 1 MPa in pressure and 0 to 100 Hz in bandwidth. A
183
Beagle Bone Black board managed the configuration and the synchronous acquisition of
184
the pressure sensors at a sampling rate of 200 Hz. It also acquired a synchronization signal
185
generated by the microphone acquisition system to ensure the time consistency between the
186
different recordings.
187
188
The mast was rotated in azimuth over 360° by steps of 15°, and over −15° to 15° in steps
189
of 5°. This represents 30 different measurement angles. In chronological order, the mast was
190
rotated from 0° to 180° then from 0° to −180°. The elevation angle was 0°. For each angular
191
position of the mast and for 5 wind velocities of 0, 2, 4, 6 and 8 m s−1, a 60 s long recording
192
was simultaneously made for the five microphones and the two barometers. The maximum
193
wind speed was chosen to avoid saturation of the microphone electronics. Indeed, it will be
194
seen in the next section that the maximal amplitude of the raw signal that saturates the
195
microphones comes from a harmonic noise likely due to the rotor and that is three decade
196
higher in amplitude than the wind-induced signal (see Fig. 2). Therefore, the saturation will
197
not occur at this level with the flight model on Mars. Moreover, the amplification gain of the
198
flight-model microphone can be reduced down to a factor 30 leading to a saturation sound
199
pressure of about 4.5 Pa.
200
201
3. Data processing: dealing with rotor fan noise
202
Each microphone data point was converted into Pascals, considering the sensitivity of the
203
microphone and pressure sensors. The power spectrum for each acquisition was computed
204
and used for all of the following analyses.
205
Despite special precautions to reduce the wind generation system noise by mounting
ex-206
ternally the drive mechanism, some artificial noise propagates inside the tunnel. Moreover,
207
the steel and aluminum inner walls of the chamber resulted in significant sound reflections
208
(echoes). Therefore, a precise analysis of the noise components recorded inside the chamber
209
was needed in order to correctly interpret the results. For noise characterization, the results
210
of an additional static test (fixed microphones) with different microphone positions were also
211
used.
212
213
3.1. Microphone Noise Spectrum Components
214
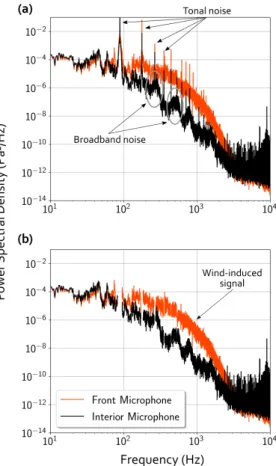
Fig. 2a shows the typical noise spectra recorded by the front microphone and the interior
215
microphone. Both microphones measure a tonal noise with a low fundamental frequency and
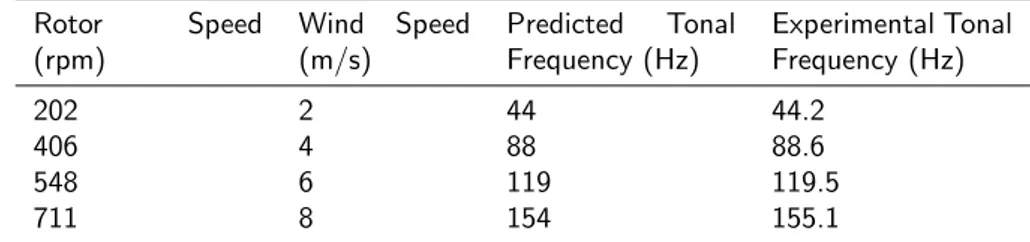
Rotor Speed (rpm) Wind Speed (m/s) Predicted Tonal Frequency (Hz) Experimental Tonal Frequency (Hz) 202 2 44 44.2 406 4 88 88.6 548 6 119 119.5 711 8 154 155.1
Table 1: Rotation speed of the fan and the associated wind speed compared to the predicted tonal noise considering 13 fan blades (fb= RP M ∗N60 with N the number of bladesNorton and Karczub(2003)) and the experimental frequency recorded in microphone spectra.
its associated harmonics. This tonal noise is considered to be induced by the rotor and is
217
the result of a non uniform flow interacting with blades, directly linked with blade passing
218
frequency (Neise and Michel, 1994). Table 1 shows the relationship between the rotation
219
speed of the fan and the fundamental frequency measured in the spectrum for the 4 tested
220
wind speeds. There is a linear correlation with a proportionality factor of 13.1 between the
221
rotor speed (in s−1) and the experimental tonal frequency. It is directly linked with the 13
222
blades composing the fan. This confirms the rotor origin of these peaks (Norton and Karczub,
223
2003). For each acquisition, the fundamental frequency and the 25 following harmonics have
224
been filtered using a 12 Hz wide notch filter around each frequency peaks and all further
225
analyses in this study have been performed on filtered spectra (see Fig. 2b).
226
227
A comparison between the spectrum recorded by the interior microphone and the front
228
microphone, displayed in Fig. 2, shows that the noise power recorded inside the SuperCam
229
cover has the same amplitude as the spectrum recorded by the exterior microphone up to
230
100 Hz. Then the interior noise is more than one decade lower in amplitude between 100 Hz
231
and 2000 Hz. After 3000 Hz both spectra reach the noise floor, which is dominated by
232
electromagnetic noise. The spectrum recorded by the interior microphone displays more
233
bumps around harmonics whereas the spectrum from the front microphone is smoother and
234
does not follow the same trend, mainly in the 100 Hz to 2000 Hz frequency band. In addition
235
to the blade-induced tonal noise, this additional broadband noise was generated due to random
236
disturbances around blades such as turbulent boundary layer separation or vortex-induced
237
Figure 2: Comparison between acoustic power spectra recorded by the front microphone (orange) and the interior microphone (black) before filtering (a) and after filtering the fundamental and the 25 following harmonics (b). The fundamental and first harmonics peaks are highlighted by arrows. Broadband noise recorded by the interior microphone is highlighted by the grey circles. Spectra were acquired under a wind speed of 4 m s−1 and at SuperCam angle of 0 degree.
noise (Neise and Michel, 1994). Like the tonal noise, this aeroacoustic noise was recorded
238
by both microphones. However, the front microphone which is unprotected outside the
239
SuperCam mock-up, also recorded signal from the wind flowing past the microphone; the
240
signal of interest for this study. Dynamic pressure affected the microphone membrane creating
241
the wind-induced noise whereas the interior microphone was protected from the wind flow.
242
Therefore, no wind-induced signal was recorded by the interior microphone. As a conclusion,
243
the difference in amplitude between the interior microphone spectrum and front microphone
244
spectrum is attributed to the dynamic pressure that creates the wind-induced signal on the
245
front microphone membrane.
3.2. Microphone Static Test
247
An additional ’static’ test was performed in order to complement the investigation of the
248
origin of the noise recorded by the microphones inside the chamber. Five microphones were
249
positioned facing the wind and at an increasing distance from a cubic obstacle (a speaker of
250
about 40 cm × 70 cm, installed for an other experiment not presented here). Therefore, the
251
microphones closest to the obstacle were partially shielded from the wind. The microphone
252
distances are referenced to the fan (downstream).
253
Synchronized acquisitions lasting 30 s were performed for two different wind speeds,
254
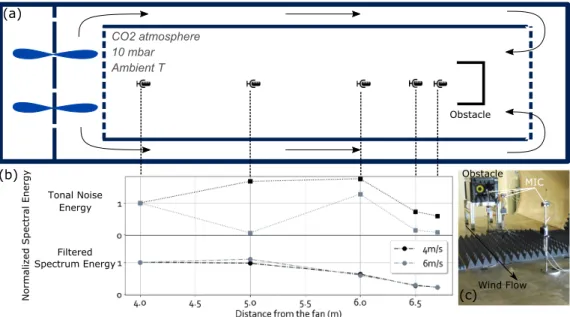
4 m s−1 and 6 m s−1. Fig. 3b shows the spectral energy of the tonal noise (spectral area
255
of the fundamental and 25 subsequent harmonics, top plot) as a function of the distance of
256
the microphone from the fan. Values are normalized by the spectral energy measured by the
257
microphone farthest from the obstacle (and therefore, closest to the fan). This comparison
258
shows that the tonal noise intensity is not correlated with the distance from the fan.
259
For the 4 m s−1 wind, energies at 5 m and 6 m from the fan are 1.8 times higher than the
260
one for the microphone closest to the fan. For the 6 m s−1 wind, energy at 5 m is 0.1 times
261
lower than the one for the microphone closest to the fan whereas the energy at 6 m is 1.3
262
times higher. The tonal noise is excepted to be composed of a direct part, possibly coming
263
from both side (fan and recirculating wind tunnel), and a diffuse part due to the high acoustic
264
reflectivity of the chambers wall. The microphones recording a higher energy (respectively
265
a lower energy), may be due to anti-nodes (respectively nodes) of the chamber. The two
266
microphones closest to the obstacle record a lower value, possibly the consequence of an
267
attenuation due to the obstacle that may act as a screen for the direct field contribution.
268
The bottom plot in Fig. 3b shows the energy of the acoustic spectrum after filtering the
269
tonal noise. It does not follow the same variation as the tonal noise confirming that the origin
270
is different. The two microphones which are the farthest from the obstacle record the same
271
spectral energy as they are under the same wind flow at a constant speed. The 3 remaining
272
microphones, the closest to the obstacle, record a signal with a lower spectral energy. Due to
273
the shielding of the wind by the obstacle, the force of the wind that vibrates the microphone
274
CO2 atmosphere 10 mbar Ambient T Normal ized Spectr al E nergy Filtered Spectrum Energy Tonal Noise Energy Obstacle MIC Wind Flow Obstacle (a) (b) (c)
Figure 3: Schematic diagram of the static test used to confirm the wind origin of the noise recorded by exterior microphones. (a) 5 microphones were arranged facing the wind, behind an obstacle shielding the first microphones from the wind. (b) Spectral energy of the tonal noise (top) and of the filtered spectrum (bottom) for wind speeds of 4 m s−1(black) and 6 m s−1 (grey) It is normalized by the energy measured by the microphone farthest from the obstacle. (c) View of the 4 first microphones and obstacle. Foam was installed for the purpose of an other investigation, not related to this study.
membranes is lower. Therefore, the spectral energy recorded by those wind-shielded
micro-275
phones is lower. This test confirms that the tonal noise originates from the fan and that the
276
filtered signal is representative of the flow.
277
278
As a conclusion, three noise components can be distinguished in the microphone spectra:
279
(1) a tonal noise that depends on the fan rotation speed, seen in all the spectra, that has a
280
high amplitude but is easily filtered; (2) a broadband noise, only seen in the interior
micro-281
phone spectra, which is lower in amplitude; (3) a wind-induced pressure fluctuation noise, as
282
we will have on Mars, that dominates the tunnel-induced noise between 100 Hz and 2000 Hz
283
(see annotations in Fig. 2 that show these three components). Moreover this static test,
284
shows that this wind-induced pressure fluctuation noise varies when the microphone is
par-285
tially protected from the wind. Therefore, we suggest that the filtered (tonal noise removed)
286
microphone data can be used to perform analyses with regard to the wind speed.
288
4. Results and interpretation
289
4.1. Total Spectrum
290
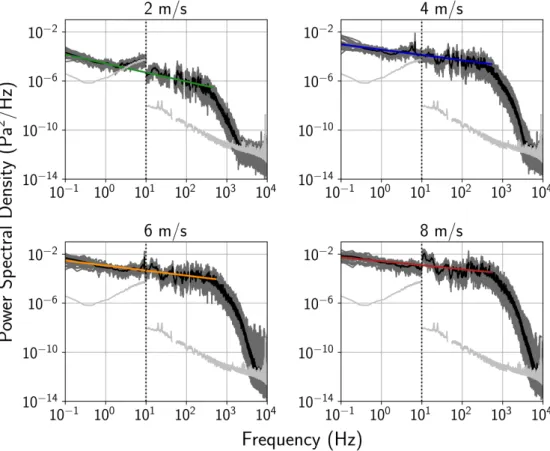
Fig. 4 shows the power spectral density recorded by the front barometer and the front
291
microphone for the four tested wind speeds. The spectrum for the barometer is displayed
292
in the 0.1 Hz to 10 Hz frequency range and the spectrum for the microphone from 10 Hz to
293
10 kHz. The spectra from the two instruments intersect at 10 Hz except in the case of a
294
wind speed of 2 m s−1where the barometer signal reaches the instrument noise floor between
295
2 Hz and 10 Hz. For the microphone spectra, the signal reaches the noise floor at frequencies
296
between 2000 Hz and 8000 Hz depending on the wind speed (see light grey lines in Fig. 4that
297
represent the no-wind noise floors of the two instruments, measured in the same conditions).
298
The spectral amplitudes increase with the wind speed, and all exhibit a slowly decreasing
299
amplitude from 0.1 Hz to ∼500 Hz. The increasing spectral amplitude with the wind speed
300
concurs with experimental spectra recorded in the infrasonic range presented inMcDonald
301
and Herrin (1975). Then, around 500 Hz, a slope change occurs and the spectra sharply
302
decrease for all wind speeds. Given the difficulties in precisely determining the transition
303
frequency, a median value of 500 Hz is assumed. Under a 2 m s−1wind, the spectrum reaches
304
the noise floor near 2000 Hz. For stronger wind speeds, the slope becomes even steeper above
305
1500 Hz until it reaches the noise floor around 5000 Hz. Similar trends are also observed for
306
the signals obtained from the barometer and microphone located on the side of the mock-up
307
(not displayed here for the sake of conciseness).
308
The first portion of each spectrum, below 500 Hz, can be fitted with a power law fb
309
with b being the exponent slope (see colored straight lines in Fig. 4). The exponent slope is
310
between −7.4 × 10⁻¹ for 2 m s−1 and −3.0 × 10⁻¹ for 8 m s−1. Considering the frequency
311
range of this decrease, it may be hypothesized empirically that this behavior is indicative
312
of the inertial regime where the energy cascades from large-scale structures to smaller and
313
smaller scale structures without dissipation. Above 500 Hz the spectrum falls off very steeply,
314
Figure 4: Power spectrum recorded by the front barometer (< 10 Hz) and microphone (> 10 Hz) for the 4 tested wind speeds. In each subplot, there are 30 dark grey spectra corresponding to the acquisitions at different SuperCam angles. The black curve is the median of these 30 spectra. The low frequency part of the spectra (below 500 Hz) is fitted by a power law (f (x) = axb- colored lines). The light grey lines correspond to the no-wind noise floor of the barometer (left of vertical dashed line) and of the microphone (right of vertical dashed line)
possibly indicative of the dissipation regime where the viscosity strongly damps out the eddies
315
and dissipates the energy.
316
317
In addition, the shaded area around the median spectra displayed in Fig. 4show that there
318
is a non-negligible dispersion of the frequency content with the microphone angle relative to
319
the wind flow. Fig. 5 shows the 30 power spectra at different angles for a 6 m s−1 wind
320
speed. Only the 100 Hz to 2000 Hz bandwidth is considered where the wind-noise magnitude
321
is significantly larger than the chamber fan-induced noises (see section3).
Figure 5: Power Spectral Density of the front microphone recorded for a wind speed of 6 m s−1when rotating the mast around its axis. The 100 Hz to 2000 Hz frequency band is considered, as defined in Section3. Other wind speeds follow the same behavior. Horizontal lines seen in the figure are areas where the tonal noise was removed. The slight discontinuity seen at 0° comes from two measurements performed at this angle.
This figure shows that the spectra for all instrument orientations have the same amplitude
323
up to ∼500 Hz, the end of the first (possibly inertial) regime. However, at the end of the first
324
regime, when the sharp decrease in amplitude starts, the instrument orientation influences
325
the spectral amplitude.
326
4.2. Link between the microphone signal and wind properties
327
Detailed analysis of microphone spectra shows that the lower-frequency part (typically
328
below 500 Hz) is less influenced by the orientation of the instrument relative to the wind than
329
higher frequencies. Moreover, the magnitude of the first regime is observed to increase with
330
wind speed. On the other hand, an influence of the angle between the instrument and the
331
wind is visible in the higher frequency (typically above 500 Hz) content of the spectra. For the
332
subsequent analyses, the power spectrum is therefore separated into two frequency domains
333
of interest considering the transition seen around 500 Hz: the ’low frequency’ regime ranging
334
from 100 Hz to 500 Hz and the ’high frequency’ regime, ranging from 500 Hz to 2000 Hz.
335
This allows the behaviors of the lower frequency domain and the higher frequency domain to
336
be studied with respect to both the wind speed and wind orientation.
337
As microphones only measure pressure fluctuations around the mean value, the root mean
338
square (RMS) of the pressure in a dedicated frequency band is used for the following analysis.
339
The RMS of the pressure is given as the square root of the power spectrum area in a chosen
340
frequency band between f1 and f2:
341 RMS Pressure = s Z f2 f1 PSD(f ) df (1)
where PSD(f ) is the power spectral density at the frequency f . The RMS of the pressure
342
is then computed over the two frequency bands highlighted in the analysis of Fig. 5, from
343
100 Hz to 500 Hz and from 500 Hz to 2000 Hz.
344
345
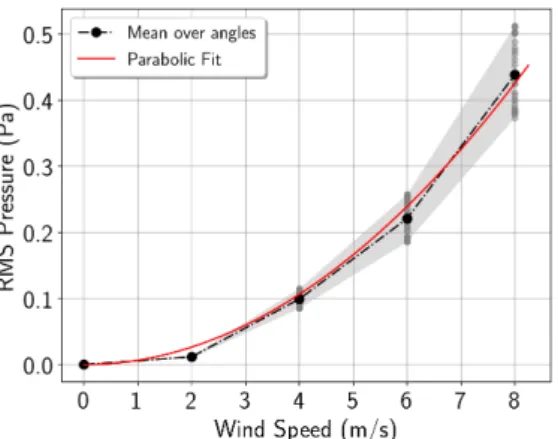
Fig. 6displays the front microphone RMS pressure integrated over the 100 Hz to 500 Hz
346
frequency band, as a function of the wind speed imposed in the tunnel. For each wind speed,
347
a dispersion with the angle of ± 10% (±1σ) around the mean value is noticed. As it was
348
inferred from the level of the first regime in Fig. 4, the microphone RMS pressure increases
349
with the wind speed and can be fitted using a parabolic model. For a wind speed of 2 m s−1
350
the model overestimates the RMS pressure whereas it matches the RMS pressure within its
351
dispersion interval for wind speeds higher than 3 m s−1. The discrepancy at low wind speed
352
may be due to uncontrolled upstream conditions of the tunnel. This plot shows that the RMS
353
pressure is proportional to the wind-induced dynamic pressure. As a consequence, monitoring
354
the microphone RMS pressure on Mars can be used to evaluate the wind speed.
355
The dispersion of the measurements with the angle of the microphone relative to the wind
356
means that there will be an uncertainty in the determination of the wind speed: ±0.4 m s−1
357
for a wind speed of 4 m s−1 and ±0.6 m s−1 for a wind speed of 8 m s−1. Previous Earth
358
atmosphere studies observed a quadratic correlation between sound pressure fluctuation and
359
average wind velocity (Strasberg,1988;Morgan and Raspet,1992). However, this quadratic
360
model is no longer valid (the exponent of the speed becomes higher than 2) when the
orien-361
tation of the microphone is changed or when the turbulence of the incident air flow increases.
362
The latter could also explain why the point at 2 m s−1 does not match the parabolic model.
Figure 6: Front Microphone RMS Pressure over the 100 Hz to 500 Hz frequency band as a function of the upstream wind speed in the tunnel. Grey points are values computed for the 30 SuperCam angles. The shaded zone is delimited as the area between the minimal and maximal value for each speed. The black dashed curve represents the mean value over those 30 points. The red solid curve is the best fit to the data with a parabolic model f (x) = ax2, with a = 6.6 × 10⁻³
364
The influence of the microphone angle relative to the wind is much more important in the
365
500 Hz to 2000 Hz frequency range. Fig. 7shows the evolution of the RMS pressure over this
366
frequency range as a function of the microphone angle relative to the axis of the tunnel. For
367
each microphone, the 0° angle corresponds to the position of the mast where the microphone
368
is pointing towards the upstream part of the tunnel, corresponding to a SuperCam angle
369
of 0° for the front microphone and a SuperCam angle of 90° for the side microphone (see
370
central schematics in the diagram in Fig. 7). Incident wind is theoretically coming from this
371
direction. For display purposes, the RMS pressure at each wind speed, is normalized by the 0°
372
value. It can be seen that for all upstream wind velocities, the RMS pressure varies by ± 27%
373
(±1σ) around the mean value over the 30 pointing angles of the mast. This dispersion with
374
angle is much larger than the ± 10% previously highlighted over the lower frequency band,
375
quantitatively confirming the previous inferences from Fig. 5. In addition, it is observed that
376
the RMS pressure reaches a minimum when the microphone is approximately facing the wind,
377
whereas it reaches a maximum when the microphone is facing downwind (see polar plots in
378
Fig. 7and linear representation at one wind velocity in Fig. 8).
379
First, it is noticed that the increase of the RMS pressure from its minimum value is steeper
380
for the front microphone than for the side microphone. The later shows a flat plateau around
381
the minimum (see Fig. 8b). RMS pressure has increased by 10% at ±30° from the minimum
382
angle for the front microphone whereas it has increased by 10% at ±60° from the minimum
383
angle for the side microphone. Indeed the front microphone is located on a larger surface
384
than the side microphone. When this larger surface is facing the wind it results in a blockage
385
effect of the flow inside the wind tunnel that modifies it in the close vicinity of the mock-up.
386
The larger the surface facing the wind is, the more important this effect. Moreover, the side
387
microphone is located on a flat and smooth surface whereas the front microphone is located
388
below the window close to many centimeter scale obstacles (see Figs. 1b and1c). A slight
389
rotation of the mast leads to these small obstacles interacting with the wind flow. This will
390
favor flow separation and vortex generation, in turn increasing the RMS pressure recorded by
391
the front microphone. For the side microphone, because of the lack of hurdles around the
392
microphone, the flow separates at higher angles.
393
394
The evolution of the RMS pressure as a function of the angle is fitted with a
subcar-395
dioid curve (f (θ) = a + bcos(θ − θ0)) for all the wind speeds and both microphones. It is
396
represented in Fig. 8a for the front microphone and in 8b for the side microphone. The
397
shaded area represents the 95% interval of confidence of the fit. For the side microphone,
398
the subcardiod model does not fit with points around the minimum value because of the
399
aforementioned plateau. However, the model works for points with values > 110% of the
400
minimum value. Hence, for both microphones and for all the wind speeds, the angle where
401
the RMS pressure is minimum is estimated as the θ0parameter returned from the subcardioid
402
fit. Results are presented in Table 2. It is assumed that the axis defined between the angle
403
where the microphone RMS pressure is minimal and the angle where the microphone RMS
404
pressure is maximal corresponds to the incident wind direction. Indeed, the situation can be
405
compared with Von Karman vortex streets created in the wake of a cylindrical object. When
406
the microphone is rotated away from the direction facing into the wind, the flow progressively
407
separates, generating vortices that enrich the spectral content of the acoustic pressure
Front Microphone Side Microphone 2 m/s −11.4° ± 4.0° −18.4° ± 4.0° 4 m/s −8.7° ± 2.4° −18.0° ± 4.0° 6 m/s −7.3° ± 3.1° −17.0° ± 2.5° 8 m/s −13.5° ± 3.3° −17.4° ± 2.9°
Table 2: Measured angular positions of the microphones relative to the wind where the RMS pressure is mimimum. This angle is returned from the fit of the RMS pressure with a subcardioid law (see Fig.8). Error is computed as the 95% confidence interval on the estimation of this parameter.
ations. When the microphone is rotated downwind (i.e. angles around 180°), it is immersed
409
in a massively separated flow region in the wake of the instrument where small vortices are
410
numerous.
411
Both microphone record wind orientation that has a negative offset from the 0° position.
412
For the front microphone, the minimum RMS pressure is reached at an angle between −13.5°
413
and −7.3° depending on the wind speed. For the side microphone the minimum RMS
pres-414
sure is reached at an angle between −18.4° and −17.4°, which is between 4° and 10° lower
415
than angles determined for the front microphone. The retrieved wind direction is represented
416
in Fig. 7 as the straight colored lines for each wind speed. This lower offset for the front
417
microphone compared to the side microphone can result from the asymmetry of the front
418
microphone position with respect to the center of the tunnel which is positioned a little closer
419
to the left edge of the SuperCam cover, but also asymmetries of the SuperCam cover itself
420
that lead to a small bias in the determination of the angle. Nevertheless, the negative offset
421
from the 0° position retrieved for both microphones is attributed to an upstream velocity
422
vector which is not perfectly aligned with the axis of the tunnel. Furthermore, for each wind
423
speed, considering the lower bound of the uncertainty interval for the front microphone and
424
the upper bound of the uncertainty interval for the side microphone, it results in a wind
425
direction that can be estimated with an uncertainty of ± 10°.
426
427
(a) (b)
Figure 7: Normalized RMS pressure over the 500 Hz to 2000 Hz frequency range for the front microphone (a) and for the side microphone (b) as a function of the microphone angle relative to the tunnel axis. For both plots, 0° position corresponds to the scheme in the inner part of the diagram. Straight colored lines represent the wind direction estimated from Table 2.
(a) (b)
Figure 8: Determination of the angles where the RMS pressure is minimum and maximum for the front microphone (a) and for the side microphone (b) and for a wind speed of 8 m s−1. Normalized measured RMS Pressure as a function of the wind incident angle relative to the microphone is represented by colored points (same data as Fig.7). The experimental points are fitted with a subcardioid f (θ) = a + bcos(θ − θ0) to determine the angular position of the minimum and the maximum. The shaded area represent the 95% interval of confidence of the fit. Other wind speeds are not represented but behaviors are the same.
5. Discussion
428
5.1. Comparison with previous studies
429
Audible noise has not yet been studied on Mars nor, to our knowledge, in a simulated
430
Martian environment with the exception of the proof-of-concept study presented inLorenz
431
et al.(2017). Surprisingly, direct comparisons of the influence of wind direction on the audible
432
noise level can be found in hearing-aid literature.Zakis(2011) presented the results of a
wind-433
tunnel experimental campaign focusing on the influence of wind speed and azimuth on noise
434
of hearing-aids positioned in a mock-up of a human head. An increase of the wideband
435
noise with wind speed is also observed, but its evolution with the wind incidence angle is
436
more difficult to interpret. In their study, clear minimum values are seen at all wind speeds
437
when microphones were facing the wind, similar to our Martian study. They find that the
438
wind noise is at its maximum when microphones are pointing rearward for a wind speed of
439
12 m s−1 (the strongest wind speed that they studied), however, this is not reproducible for
440
other conditions. The behavior with varying angle is more difficult to interpret because of the
441
specificity of microphone integration with regard to the head and ear. In a comparable study,
442
Chung et al. (2009) also includes a comparison with a less complex case of a microphone
443
mounted on the surface of a cylinder. This study confirms that the lowest wind noise is
444
observed when the microphone is facing the wind and the highest wind noise is observed
445
when the microphone is facing downstream. This transition from minimum wind noise is
446
to maximum wind noise when rotating the cylinder by 180° is explained by the turbulence
447
induced by the separation of the air flow in the wake of the cylinder. Therefore, it supports
448
the findings presented in this Martian study.
449
5.2. First comparison with Direct Numerical Simulations of the flow past SuperCam
450
In an attempt to unravel the flow structure past the SuperCam instrument as a function
451
of the direction and velocity of the wind on Mars, a series of direct numerical simulations
452
(DNS) has been performed. The three-dimensional time-dependent Navier-Stokes equations
453
around a simplified model of the full-scale SuperCam instrument were directly solved using
454
an Eulerian finite volume method. Assuming incompressible viscous flow, the equations read:
455 ~ ∇.~v = 0 (2a) ∂~v ∂t + (~v. ~∇)~v = − 1 ρ ~ ∇p + ν∇2~v (2b)
where ~v is the velocity, p the pressure, ρ and ν the fluid density and kinematic viscosity,
456
respectively. The fluid properties are set with respect to the Martian environmental properties.
457
The gas is pure CO2. Its density, pressure and kinematic viscosity are set to 0.02 kg m−3,
458
6 mbar and 6.9 × 10⁻⁴m2s−1, respectively (corresponding to an air temperature of 210 K).
459
The model of SuperCam, of width L, is enclosed in a cylindrical computational domain of
460
diameter 40L and of height 12L. It is centered on the vertical axis of the cylinder and
461
its altitude, relative to the ground, is fixed similar to its actual height on the rover. The
462
coordinates origin is located at the geometrical center of the instrument.
463
The surface of SuperCam and the lower flat surface of the computational cylinder, which
464
represents the ground, are modeled as non-slip surfaces. A velocity Dirichlet condition is
im-465
posed on the tubular and on the upper flat surfaces of the computational domain, to represent
466
the freestream Martian wind. This permits the direction and velocity of the wind relative
467
to the instrument to be changed easily while ensuring a uniform boundary condition. Here
468
the freestream wind velocity U∞ has been set to 1 m s−1, 3 m s−1 and 5 m s−1, respectively.
469
The corresponding Reynolds numbers ReL, based on the width L of SuperCam and on U∞,
470
range from 725 to 3620. These low Reynolds numbers justify the DNS approach. For each
471
wind speed, its direction β was altered in 45° increments, from β = 0° (the microphone is
472
facing the wind, Fig. 9a) to β = ±180° (the microphone is facing away from the wind).
473
The computational domain is composed of 8 million polyhedral cells. It is highly refined
474
close to and in the wake of SuperCam (Fig. 9b). The mesh refinement zones are thus adapted
475
depending on the direction of the wind, to capture the wake (see Fig. 9c). This results in
(a) (b)
(c)
Figure 9: (a) Illustration of the freestream wind parameters U∞ and β and the resulting vortices in the wake. (b) Close view of the polyhedral mesh around the SuperCam, here for the flow configuration with the microphone facing the wind (β =0°). (c) View of the refined mesh in the wake of SuperCam. Here the wind is flowing from the right to the left, with β = −90°. For the sake of clarity, the surface mesh on the model of SuperCam is not depicted.
local, cell-based Reynolds numbers close to a few units in these refined zones.
477
The spatial and temporal discretizations are achieved using second-order upwind schemes
478
and second-order implicit time-stepping method respectively. The pressure velocity coupling
479
is obtained using the SIMPLE algorithm. The time step is fixed in order to satisfy the CFL
480
condition (Courant Number close to unity), regardless of the flow conditions.
481
Further simulations (not discussed here) were carried out to ensure that the results are
482
independent of the number of cells, the time step and the position of the external boundary
483
conditions.
484
485
The analysis of the flow is based on the spatio-temporal evolution of the near-wake
vor-486
tical structures, identified in terms of iso-surfaces of λ2-criterion (Jeong and Hussain,1995;
487
Bury and Jardin, 2012), and their impact on the unsteady pressure field exerted on the
mi-488
crophone. Here the analysis focuses on a freestream wind velocity of 5 m s−1. The numerical
489
results reveal the occurrence of complex instability modes in the close wake of SuperCam,
490
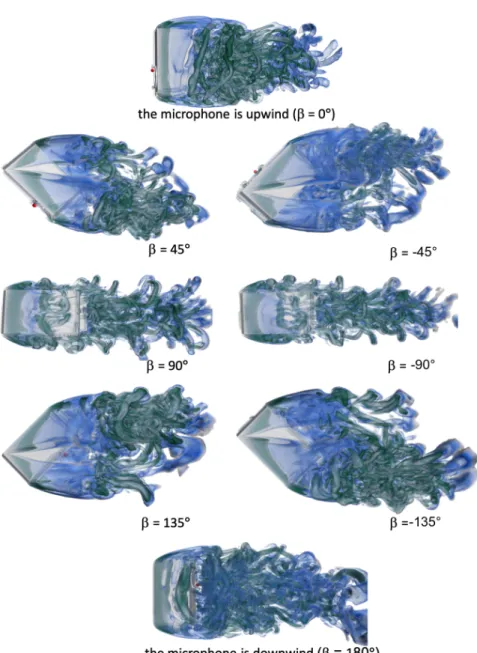
depending on the direction of the wind. Fig.10depicts the vortical structures in the wake of
491
SuperCam for a 5 m s−1 Martian wind when the wind direction is varied from 0° to ±180°.
492
The wake features very different shapes and different spreading of the size of the vortices as
493
the instrument is progressively rotated 360°.
494
495
An analysis of the time histories of the pressure signal measured at the location of the
496
SuperCam Microphone will be part of a subsequent study. It is expected that, as observed
497
experimentally, the direction of the wind impacts both the mean and fluctuating values of the
498
pressure signal at the location of the microphone with the RMS value providing more detailed
499
information on both the wind direction and velocity. It should also be possible to identify the
500
vortex shedding frequency peak as the SuperCam is rotated. This additional information can
501
likely be used to determine the Martian wind speed and direction in situ using the SuperCam
502
Microphone.
Figure 10: Iso-surfaces of λ2-criterion, revealing the vortical structures in the wake of the SuperCam instru-ment (upper view), for a 5 m s−1 wind flowing from left to right, as its direction relative to SuperCam is rotated 360°. SuperCam angles are indicated below each figure The different colors correspond to more or less (dark green to light blue) intense vortices. The red dot illustrates the SuperCam microphone flight-model location.
5.3. Weaknesses and perspectives
504
This test campaign was conducted in the best facility to simulate a Mars wind flow on a
505
real scale model of the SuperCam microphone integrated in a full-scale mock-up of the upper
506
part of the Perseverance rover mast. However this experimental flow cannot be approximated
507
as a free field due to the inability for tunnels to host eddy sizes and length scales that are
508
present in the Mars boundary layer. Therefore, low frequency turbulence that occurs on Mars
509
(time scale longer than 1 s,Smith et al.(2004)) is not represented in this wind tunnel but are
510
not likely to be measured by the microphone flight model that has a response time starting at
511
100 Hz. Moreover, this experimental flow is subject to artifacts associated to closed tunnels
512
that can lead to not perfectly controlled upstream conditions and a slightly flapping flow.
513
For instance, the negative offset found for the retrieved wind direction (Fig. 7) highlights
514
these experimental bias. However, although the noise associated with the engine has been
515
filtered out (see Section3), we can expect that the microphone spectrum integrates signal
516
induced by interactions between the wind and other components of the tunnel. Therefore,
517
a cross calibration on Mars with the MEDA instrument is strongly recommended to confirm
518
the trend observed for the RMS pressure as function of both the wind speed and direction
519
and also to compare between experimental, simulated and in situ conditions. In term of Mars
520
operations, if the subcardiod model used to represent the evolution of the RMS pressure
521
over a 360° rotation is confirmed by this suggested cross calibration, only one recording at
522
three azimuth pointing angles spaced by 120° will be necessary to constrain the parameters
523
of the subcardiod and therefore, determine the wind direction. Furthermore, as shown in
524
Bardera-Mora et al.(2017), the wind velocity measured at the microphone’s location may be
525
lower than the actual mean wind speed, because of flow stagnation immediately upwind of
526
the instrument. The cross-calibration with MEDA, which does not seem to be sensitive to
527
this effect, would allow the calibration of the microphone RMS pressure with respect to the
528
true wind speed.
6. Conclusion
530
The SuperCam Microphone, located at the top of the mast of the Mars 2020 Perseverance
531
rover will record for the first time audio signal from the surface of Mars in the audible range.
532
In preparation for surface operations, and scientific analyses of the data, this paper presents an
533
experimental study of the wind-induced noise on the SuperCam Microphone under controlled
534
Mars air-pressure conditions.
535
Acoustic spectra from 100 Hz to 10 kHz display a low frequency regime (< 500 Hz) whose
536
amplitude increases as a function of the average wind speed squared. At higher frequencies,
537
the spectral energy sharply dissipates and the RMS pressure at frequencies higher than 500 Hz
538
presents a minimum value when the microphone is facing the wind and a maximal value when
539
the microphone is pointing downwind. Therefore, recording the Martian acoustic pressure
540
fluctuations with the microphone when SuperCam is rotated in azimuth around its mast is
541
a way to determine in situ the Martian wind vector with an uncertainty of ± 1 m s−1 on
542
speed and ± 10° on the orientation. The identification of where the high-frequency RMS
543
pressure is minimum and maximum gives the wind direction while the RMS pressure at lower
544
frequencies can be used to determine the wind speed.
545
However, as inferred from previous Earth atmosphere studies (Strasberg, 1988; Morgan
546
and Raspet, 1992), the RMS pressure depends on the level of intrinsic turbulence of the
547
wind flow. The wind tunnel used for this experiment does not reproduce levels of turbulence
548
achieved on Mars. Therefore, a cross-calibration with MEDA, the Perseverance weather
sta-549
tion, is required after landing. Simultaneous measurement with MEDA and the SuperCam
550
microphone will help to draw the calibration curve of RMS pressure as a function of the Mars
551
wind speed. Measurements over a full 360° in azimuth are needed to determine the wind
552
orientation. A calibration run performed in parallel with MEDA is also suggested in order to
553
demonstrate in situ the results presented in this study, but also to explore the influence of the
554
elevation angle that has not been tested here. Furthermore, the measurement of the
acous-555
tic power spectrum will complement in higher frequencies the pressure fluctuation spectrum
556
recorded by APSS/Insight. The early development of a numerical model shows a different
557
behavior of the flow whether the microphone is facing the wind or pointing downwind. Future
558
ongoing studies will help to better understand the interaction of the flow with the body of
559
the rover.
560
561
Considering these experimental results, the SuperCam Microphone has a priori the
po-562
tential to determine both the wind speed (from the low-frequency component) and the wind
563
incident angle (from the high frequency component) on Mars. Therefore, in addition to
564
being valuable for Laser Induced Breakdown Spectroscopy investigation (Chide et al.,2019;
565
Murdoch et al.,2019), it will also contribute to Martian atmospheric science investigations.
566
7. Acknowledgements
567
This work was funded by CNES and R´egion Occitanie as part of a PhD thesis. We
568
gratefully acknowledge funding from Europlanet. Europlanet 2020 RI has received funding
569
from the European Union’s Horizon 2020 research and innovation programme under grant
570
agreement No 654208.
References
572
Balme M, Greeley R. Dust devils on earth and mars. Reviews of Geophysics 2006;44(3). doi:10.1029/
573
2005rg000188.
574
Banerdt WB, Smrekar SE, Banfield D, Giardini D, Golombek M, Johnson CL, Lognonn´e P, Spiga A, Spohn
575
T, Perrin C, St¨ahler SC, Antonangeli D, Asmar S, Beghein C, Bowles N, Bozdag E, Chi P, Christensen U,
576
Clinton J, Collins GS, Daubar I, Dehant V, Drilleau M, Fillingim M, Folkner W, Garcia RF, Garvin J, Grant J,
577
Grott M, Grygorczuk J, Hudson T, Irving JCE, Kargl G, Kawamura T, Kedar S, King S, Knapmeyer-Endrun
578
B, Knapmeyer M, Lemmon M, Lorenz R, Maki JN, Margerin L, McLennan SM, Michaut C, Mimoun D,
579
Mittelholz A, Mocquet A, Morgan P, Mueller NT, Murdoch N, Nagihara S, Newman C, Nimmo F, Panning
580
M, Pike WT, Plesa AC, Rodriguez S, Rodriguez-Manfredi JA, Russell CT, Schmerr N, Siegler M, Stanley
581
S, Stutzmann E, Teanby N, Tromp J, van Driel M, Warner N, Weber R, Wieczorek M. Initial results from
582
the InSight mission on mars. Nature Geoscience 2020;13(3):183–9. doi:10.1038/s41561-020-0544-y.
583
Banfield D, , Rodriguez-Manfredi JA, Russell CT, Rowe KM, Leneman D, Lai HR, Cruce PR, Means JD,
John-584
son CL, Mittelholz A, Joy SP, Chi PJ, Mikellides IG, Carpenter S, Navarro S, Sebastian E, Gomez-Elvira J,
585
Torres J, Mora L, Peinado V, Lepinette A, Hurst K, Lognonn´e P, Smrekar SE, Banerdt WB. InSight
auxil-586
iary payload sensor suite (APSS). Space Science Reviews 2018;215(1). doi:10.1007/s11214-018-0570-x.
587
Banfield D, Spiga A, Newman C, Forget F, Lemmon M, Lorenz R, Murdoch N, Viudez-Moreiras D, Pla-Garcia
588
J, Garcia RF, Lognonn´e P, ¨Ozg¨ur Karatekin , Perrin C, Martire L, Teanby N, Hove BV, Maki JN, Kenda B,
589
Mueller NT, Rodriguez S, Kawamura T, McClean JB, Stott AE, Charalambous C, Millour E, Johnson CL,
590
Mittelholz A, M¨a¨att¨anen A, Lewis SR, Clinton J, St¨ahler SC, Ceylan S, Giardini D, Warren T, Pike WT,
591
Daubar I, Golombek M, Rolland L, Widmer-Schnidrig R, Mimoun D, Beucler ´E, Jacob A, Lucas A, Baker
592
M, Ansan V, Hurst K, Mora-Sotomayor L, Navarro S, Torres J, Lepinette A, Molina A, Marin-Jimenez M,
593
Gomez-Elvira J, Peinado V, Rodriguez-Manfredi JA, Carcich BT, Sackett S, Russell CT, Spohn T, Smrekar
594
SE, Banerdt WB. The atmosphere of mars as observed by InSight. Nature Geoscience 2020;13(3):190–8.
595
doi:10.1038/s41561-020-0534-0.
596
Bardera-Mora R, Sor S, Garcia-Magari˜no A, Gomez-Elvira JJ, Marin M, Torres J, Navarro S, Carretero S.
597
Characterization of the flow around the mars 2020 rover. In: 35th AIAA Applied Aerodynamics Conference.
598
American Institute of Aeronautics and Astronautics; 2017. doi:10.2514/6.2017-4228.
599
Bass HE, Raspet R, Messer JO. Experimental determination of wind speed and direction using a three
600
microphone array. The Journal of the Acoustical Society of America 1995;97(1):695–6. doi:10.1121/1.
601
412293.
602
Bury Y, Jardin T. Transitions to chaos in the wake of an axisymmetric bluff body. Physics Letters A
603
2012;376(45):3219–22. doi:10.1016/j.physleta.2012.09.011.
604
Chide B, Maurice S, Mimoun D, Murdoch N, lorenz R, Wiens R. Speed of Sound Measurements on Mars and
605
its Implications. In: 51st Lunar and Planetary Science Conference. The Woodlands, TX, United States;
606
2020. p. 1366.
607
Chide B, Maurice S, Murdoch N, Lasue J, Bousquet B, Jacob X, Cousin A, Forni O, Gasnault O, Meslin PY,
608
Fronton JF, Bassas-Port´us M, Cadu A, Sournac A, Mimoun D, Wiens RC. Listening to laser sparks: a
609
link between laser-induced breakdown spectroscopy, acoustic measurements and crater morphology.
Spec-610
trochimica Acta Part B: Atomic Spectroscopy 2019;153:50–60. doi:10.1016/j.sab.2019.01.008.
611
Chung K, Mongeau L, McKibben N. Wind noise in hearing aids with directional and omnidirectional
mi-612
crophones: Polar characteristics of behind-the-ear hearing aids. The Journal of the Acoustical Society of
613
America 2009;125(4):2243–59. doi:10.1121/1.3086268.
614
de la Torre Juarez M, Rodrigez-Manfredi J, Apestigue V, Banfield D, Boland J, Conrad P, the MEDA Team
615
. Performance after the Integration of MEDA, the Environmental and Meteorological Package for Mars
616
2020. In: 51st Lunar and Planetary Science Conference. The Woodlands, TX, United States; 2020. p.
617
2971.
618
Hess SL, Henry RM, Leovy CB, Ryan JA, Tillman JE. Meteorological results from the surface of mars: Viking
619
1 and 2. Journal of Geophysical Research 1977;82(28):4559–74. doi:10.1029/js082i028p04559.
620
Holstein-Rathlou C, Gunnlaugsson HP, Merrison JP, Bean KM, Cantor BA, Davis JA, Davy R, Drake NB,
621
Ellehoj MD, Goetz W, Hviid SF, Lange CF, Larsen SE, Lemmon MT, Madsen MB, Malin M, Moores JE,
622
Nørnberg P, Smith P, Tamppari LK, Taylor PA. Winds at the phoenix landing site. Journal of Geophysical
623
Research 2010;115. doi:10.1029/2009je003411.
624
Holstein-Rathlou C, Merrison J, Iversen JJ, Jakobsen AB, Nicolajsen R, Nørnberg P, Rasmussen K, Merlone
625
A, Lopardo G, Hudson T, Banfield D, Portyankina G. An environmental wind tunnel facility for
test-626
ing meteorological sensor systems. Journal of Atmospheric and Oceanic Technology 2014;31(2):447–57.
627
doi:10.1175/jtech-d-13-00141.1.
628
Jeong J, Hussain F. On the identification of a vortex. Journal of Fluid Mechanics 1995;285:69. doi:10.1017/
629
s0022112095000462.
630
Kolmogorov AN. The local structure of turbulence in incompressible viscous fluid for very large reynolds
631
numbers. Proceedings: Mathematical and Physical Sciences 1991;434(1890):9–13.
632
Lorenz RD, Merrison J, Iversen JJ. Wind Noise and Sound Propagation Experiments in the Aarhus Mars
At-633
mosphere Simulation Chamber. In: The Sixth International Workshop on the Mars Atmosphere: Modelling
634
and Observation. Granada, Spain; 2017. .
635
Mart´ınez GM, Newman CN, Vicente-Retortillo AD, Fischer E, Renno NO, Richardson MI, Fair´en AG, Genzer
636
M, Guzewich SD, Haberle RM, Harri AM, Kemppinen O, Lemmon MT, Smith MD, de la Torre-Ju´arez
637
M, Vasavada AR. The modern near-surface martian climate: A review of in-situ meteorological data from
638
viking to curiosity. Space Science Reviews 2017;212(1-2):295–338. doi:10.1007/s11214-017-0360-x.
639
Martire L, Garcia RF, Rolland LM, Spiga A, Lognonn´e PH, Banfield DJ, Banerdt WB, Martin R. Martian
640
Infrasound: Numerical Modeling and Analysis of InSight’s Data. Journal of Geophysical Research: Planets
in press;doi:10.1029/2020JE006376.
642
McDonald JA, Herrin E. Properties of pressure fluctuations in an atmospheric boundary layer. Boundary-Layer
643
Meteorology 1975;8(3-4):419–36. doi:10.1007/bf02153561.
644
Morgan S, Raspet R. Investigation of the mechanisms of low-frequency wind noise generation outdoors. The
645
Journal of the Acoustical Society of America 1992;92(2):1180–3. doi:10.1121/1.404049.
646
Murdoch N, Chide B, Lasue J, Cadu A, Sournac A, Bassas-Port´us M, Jacob X, Merrison J, Iversen J, Moretto
647
C, Velasco C, Par`es L, Hynes A, Godiver V, Lorenz R, Cais P, Bernadi P, Maurice S, Wiens R, Mimoun
648
D. Laser-induced breakdown spectroscopy acoustic testing of the mars 2020 microphone. Planetary and
649
Space Science 2019;165:260–71. doi:10.1016/j.pss.2018.09.009.
650
Murdoch N, Mimoun D, Garcia RF, Rapin W, Kawamura T, Lognonn´e P, Banfield D, Banerdt WB. Evaluating
651
the wind-induced mechanical noise on the InSight seismometers. Space Science Reviews
2016;211(1-652
4):429–55. doi:10.1007/s11214-016-0311-y.
653
Murdoch N, Spiga A, Lorenz R, Garcia R, Perrin C, Widmer-Schnidrig R, Rodriguez S, Compaire N, Warner
654
NH, Mimoun D, Banfield D, Lognonn´e P, Banerdt W. Constraining Martian regolith parameters and vortex
655
trajectories from combined seismic and meteorological measurements. Journal of Geophysical Research:
656
Planets submitted;.
657
Neise W, Michel U. Aerodynamic noise of turbomachines. 1994. doi:10.13140/2.1.3408.9760.
658
Norton MP, Karczub DG. Fundamentals of Noise and Vibration Analysis for Engineers. Cambridge University
659
Press, 2003. doi:10.1017/cbo9781139163927.
660
Read PL, Galperin B, Larsen SE, Lewis SR, M¨a¨att¨anen A, Petrosyan A, Renn´o N, Savij¨arvi H, Siili T, Spiga
661
A, Toigo A, V´azquez L. The martian planetary boundary layer. In: Haberle RM, Clancy RT, Forget F,
662
Smith MD, Zurek RW, editors. The Atmosphere and Climate of Mars. Cambridge University Press; 2016.
663
p. 172–202. doi:10.1017/9781139060172.007.
664
Schofield JT, Barnes JR, Crisp D, Haberle RM, Larsen S, Magalh˜aes JA, Murphy JR, Seiff A, Wilson G.
665
The mars pathfinder atmospheric structure investigation/meteorology (ASI/MET) experiment. Science
666
1997;278(5344):1752–8. doi:10.1126/science.278.5344.1752.
667
Smith MD, Wolff MJ, Lemmon MT, Spanovich N, Banfield D, Budney CJ, Clancy RT, Ghosh A, Landis
668
GA, Smith P, Whitney B, Christensen PR, Squyres SW. First atmospheric science results from the mars
669
exploration rovers mini-TES. Science 2004;306(5702):1750–3. doi:10.1126/science.1104257.
670
Spiga A. Elements of comparison between martian and terrestrial mesoscale meteorological phenomena:
671
Katabatic winds and boundary layer convection. Planetary and Space Science 2011;59(10):915–22. doi:10.
672
1016/j.pss.2010.04.025.
673
Spiga A, Banfield D, Teanby NA, Forget F, Lucas A, Kenda B, Manfredi JAR, Widmer-Schnidrig R, Murdoch
674
N, Lemmon MT, Garcia RF, Martire L, ¨Ozg¨ur Karatekin , Maistre SL, Hove BV, Dehant V, Lognonn´e P,
675
Mueller N, Lorenz R, Mimoun D, Rodriguez S, Beucler ´E, Daubar I, Golombek MP, Bertrand T, Nishikawa
676