Département de génie civil
PHYSICAL AND CHEMICAL KINETICS OF
STRUCTURAL BUILD-UP OF CEMENT
SUSPENSIONS
La Cinétique Physico-Chimiques de la Structuration des Suspensions de Ciment
Thèse de doctorat Spécialité : génie civil
Ahmed Mohamed Mostafa ALY
A dissertation submitted in partial fulfillmentof the requirements for the degree of Doctor of Philosophy
(Civil Engineering)
Jury : Ammar Yahia, directeur de recherche Arezki Tagnit-Hamou, rapporteur
Mohammed Sonebi, évaluateur
Pierre-Claude Aïtcin, évaluateur Richard Morin, évaluateur
DEDICATION
To the researchers and engineers who appreciate the value of science and knowledge.
To my beloved parents, Mohamed and Soher, who have forward me over themselves and given me all what they could. “My Lord! Bestow on them your
Mercy as they did bring me up when I was young”.
To my brother and sister who always gave me their encouragement and extensive support at hard times of my life.
To my lovely wife, Rinad, who always supported me and understood my special circumstances as a researcher. To my daughters, Malk and Jana, who made a
i
ABSTRACT
The structural build-up of fresh cement-based materials has a great impact on their structural performance after casting. Accordingly, the mixture design should be tailored to adapt the kinetics of build-up given the application on hand. The rate of structural build-up of cement-based suspensions at rest is a complex phenomenon affected by both physical and chemical structuration processes. The structuration kinetics are strongly dependent on the mixture’s composition, testing parameters, as well as the shear history. Accurate measurements of build-up rely on the efficiency of the applied pre-shear regime to achieve an initial well-dispersed state as well as the applied stress during the liquid-solid transition. Studying the physical and chemical mechanisms of build-up of cement suspensions at rest can enhance the fundamental understanding of this phenomenon. This can, therefore, allow a better control of the rheological and time-dependent properties of cement-based materials.
The research focused on the use of dynamic rheology in investigating the kinetics of structural build-up of fresh cement pastes. The research program was conducted in three different phases. The first phase was devoted to evaluating the dispersing efficiency of various disruptive shear techniques. The investigated shearing profiles included rotational, oscillatory, and combination of both. The initial and final states of suspension’s structure, before and after disruption, were determined by applying a small-amplitude oscillatory shear (SAOS). The difference between the viscoelastic values before and after disruption was used to express the degree of dispersion. An efficient technique to disperse concentrated cement suspensions was developed.
The second phase aimed to establish a rheometric approach to dissociate and monitor the individual physical and chemical mechanisms of build-up of cement paste. In this regard, the non-destructive dynamic rheometry was used to investigate the evolutions of both storage modulus and phase angle of inert calcium carbonate and cement suspensions. Two independent build-up indices were proposed. The structural build-up of various cement suspensions made with different cement contents, silica fume replacement percentages, and high-range water reducer dosages was evaluated using the proposed indices. These indices were then compared to the well-known thixotropic index (Athix.). Furthermore, the proposed indices were correlated to the decay in lateral pressure determined for various cement pastes cast in a pressure column.
The obtained results showed that oscillatory shear may have a greater effect on dispersing concentrated cement suspension than the rotational shear. Furthermore, the increase in induced shear strain was found to enhance the breakdown of suspension’s structure until a critical point, after which thickening effects dominate. An effective dispersing method is then proposed. This consists of applying a rotational shear around the transitional value between the linear and non-linear variations of the apparent viscosity with shear rate, followed by an oscillatory shear at the crossover shear strain and high angular frequency of 100 rad/s. Investigating the evolutions of viscoelastic properties of inert calcite-based and cement suspensions and allowed establishing two independent build-up indices. The first one (the percolation time) can represent the rest time needed to form the elastic network. On the other hand, the second one (rigidification rate) can describe the increase in stress-bearing capacity of formed network due to cement hydration. In addition, results showed that combining the percolation time and the rigidification rate can provide deeper insight into the structuration process of cement suspensions. Furthermore, these indices were found to be well-correlated to the decay in the lateral pressure of cement suspensions. The variations of proposed build-up indices with mixture’s parameters showed that the percolation time is most likely controlled by the frequency of Brownian collisions, distance between dispersed particles, and intensity of cohesion between cement particles. On the other hand, a higher rigidification rate can be secured by increasing the number of contact points per unit volume of paste, nucleation rate of cement hydrates, and intensity of inter-particle cohesion. Keywords: Cement suspension, Dispersion, Dynamic rheology, Lateral pressure, Percolation time, Rigidification rate, Structural build-up, Viscoelasticity.
iii
RÉSUMÉ
La structuration des matériaux cimentaires a un grand impact sur leur performance mécanique après le coulage. Par conséquent, la formulation des mélanges devrait être conçue afin d’adapter la cinétique de structuration conformément à l’application considérée. La structuration des suspensions à base des matériaux cimentaires est un phénomène complexe affecté par les deux processus physiques et chimiques. La cinétique de structuration est fortement liée à la formulation des mélanges, des paramètres d’essai et de l’historique du cisaillement. Une meilleure évaluation de ce phénomène est fonction du pré-cisaillement appliqué, afin d’obtenir un état complètement dispersé ainsi que la contrainte appliquée lors de la transition de l’état solide-liquide de la suspension. L'étude des mécanismes physiques et chimiques de la structuration des suspensions à base de ciment peut améliorer la compréhension fondamentale de ce phénomène. Ceci permettra un meilleur contrôle des propriétés rhéologiques en fonction du temps des matériaux cimentaires.
Cette recherche porte sur l'utilisation de la rhéologie dynamique pour étudier la cinétique de structuration des pâtes de ciment à l’état frais. Le programme de recherche a été mené en trois phases différentes et complémentaires. La première phase a été consacrée à l'évaluation de l'efficacité de diverses techniques de cisaillement. Les profils de cisaillement étudiés inclus la rotation et l’oscillation et la combinaison des deux modes de cisaillement. Les états initiaux et finaux de la structure de suspension avant et après la dispersion ont été déterminées en appliquant un cisaillement oscillatoire de faible amplitude (SAOS). La différence entre les valeurs viscoélastiques avant et après la dispersion a été utilisé pour exprimer le degré de dispersion. Une technique efficace pour disperser les suspensions concentrées de ciment a été développée.
La deuxième phase visait à établir une approche rhéologique afin de dissocier les mécanismes physiques et chimiques individuels de la structuration de pâte de ciment. En effet, la rhéomètrie dynamique non destructif a été utilisé pour étudier à la fois l’évolution du module élastique et de l'angle de phase des suspensions inertes à base de carbonates de calcium et des suspensions de ciment. Deux indices de structurations indépendantes ont été proposés. La structuration de différentes suspensions à base de ciment réalisées avec différentes teneurs en ciment,
la teneur en sulfate alcalin, et la température de la suspension de ciment. Le potentiel zêta, les mesures calorimétriques et spectrométriques ont été également réalisées afin d’étudier les changements microstructuraux correspondants dans les suspensions de ciment, tels que la cohésion entre les particules, le taux de floculation Brownien, et le taux de nucléation. Un modèle reliant les indices de structuration et les caractéristiques microstructurales a été développé afin de prédire le comportement de structuration des suspensions des matériaux cimentaires.
Les résultats obtenus montrent que le cisaillement oscillatoire est plus efficace sur la dispersion de suspension de ciment concentré que le cisaillement rotationnel. Outre l'augmentation de la contrainte, le cisaillement induit permet d’améliorer la dispersion de la structure de suspension jusqu'à un point critique. Au-delà de cette valeur critique les effets épaississants dominent. Une méthode efficace de dispersion est ensuite proposée. Cette méthode consiste à appliquer un cisaillement rotationnel autour de la valeur de transition entre les variations linéaires et non linéaires de la viscosité apparente avec le taux de cisaillement, suivie d'un cisaillement oscillatoire à la contrainte de cisaillement croisée et la fréquence angulaire élevée de 100 rad/s. Analyser l’évolution des propriétés viscoélastiques des suspensions inertes de carbonates de calcium et de ciment ont permis de développer deux indices pour quantifier la structuration des suspensions de ciment. Le premier indice (le temps de percolation) représente le temps de repos nécessaire pour former le réseau élastique. Le deuxième indice (taux de rigidification) décrit la rigidification de la structure, i.e. sa capacité à supporter des contraintes. D’autre part, les résultats montrent que la combinaison du temps de percolation et du taux de rigidification permet de mieux comprendre le processus de structuration des suspensions de ciment. De ce
v
fait, ces indices se sont avérés être bien corrélés avec la pression latérale de coffrage des suspensions à base de ciment. Les variations des indices de structuration proposés avec les paramètres de mélange ont montré que le temps de percolation est très probablement contrôlé par la fréquence des collisions Browniennes, la distance entre les particules dispersées, et l'intensité de la cohésion entre les particules de ciment. D'autre part, un taux plus élevé de rigidification peut être assuré en augmentant le nombre de points de contact par unité de volume de la pâte, le taux de nucléation d’hydrates de ciment et l'intensité de la cohésion inter-particulaire.
Mots clés : Suspension en ciment, dispersion, Rhéologie dynamique, Pression latérale, Temps de percolation, Taux de rigidification, Structuration, Viscoélasticité.
vii
ACKNOWLEDGEMENTS
Thanks to Almighty ALLAH for the gracious kindness in all the endeavors I have taken up in my life.
The author would like to express his gratefulness to the valuable advices and patience of his supervisor, Prof. Ammar Yahia, and for giving him the opportunity to conduct such research at the Université de Sherbrooke. The author is proud to work with him. All the guidance, insight, helpful advice, and encouragement provided throughout the course of the thesis are greatly appreciated. The author has learned a lot through his knowledge and experience. The author can hardly find the right words to express the exact of his gratitude and thanks.
The author is greatly indebted to Paco Diederich for his cooperation, suggestions, and the advice during the first phase of the research program. Special thanks are to Jeff Sharman for helping me in performing the zeta potential measurements. The author also thanks all the professors of Civil Engineering Department and all the faculty staff he has interacted with. The kind co-operations of all the research assistants, technicians, and graduate students of the Cement and Concrete Research Group at the Université de Sherbrooke are also acknowledged. The author is thankful to the members of the dissertation committee for their valuable comments and advices.
To my parents, thank you for your commitment to my education and for making me the person that I am today. To my wife Rinad and my two daughters Malk and Jana, thank you for your unconditional love and encouragement, your patience and supporting made this possible.
Ahmed Mohamed Mostafa Aly June 2016
ix
TABLE OF CONTENTS
Abstract ... I Résumé ... III Acknowledgements ... VII Table of Contents ... IX List of Figures ... XIII List of Tables ... XIX Notations ... XXIChapter 1 : Introduction ... 1
1.1 Problem statement ... 1
1.2 Research objectives ... 3
1.3 Outline of the thesis ... 4
1.4 References ... 6
Chapter 2 : Literature Review ... 9
2.1 Introduction ... 9 2.2 Rheology of materials ... 9 2.2.1 Elastic materials ... 9 2.2.2 Viscous materials ... 10 2.2.3 Viscoelastic materials ... 12 2.2.4 Thixotropic materials ... 12
2.3 Viscoelasticity versus thixotropy ... 16
2.4 Dynamic oscillatory shear rheology ... 17
2.4.1 Strain sweep ... 19
2.4.2 Frequency sweep ... 21
2.4.3 Time sweep ... 22
2.5 Colloidal suspensions ... 23
2.5.1 Brownian force ... 26
2.5.2 Van der Waals attractive forces ... 26
2.5.3 Electrostatic repulsion ... 29
2.5.4 Steric repulsion ... 32
2.5.5 DLVO theory and state of flocculation ... 32
2.5.6 Cohesion ... 33
2.6 Origin of thixotropic build-up of cement suspensions ... 36
2.7 Experimental quantification of thixotropy ... 37
2.7.1 Hysteresis area ... 37
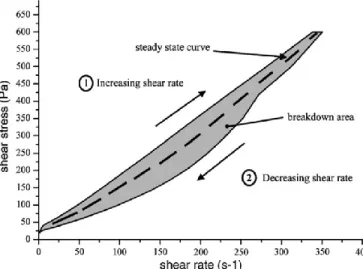
2.7.2 Structural breakdown curves ... 38
2.7.3 Specific rebuilding energy ... 40
2.7.4 Growth rate of static yield stress at rest ... 42
3.3.2.1 Rheological measurements ... 67
3.3.2.2 Shear procedure to quantify dispersion efficiency ... 69
3.4 Test results and discussions ... 70
3.4.1 Flow behaviour ... 70
3.4.2 LVED and the critical strain ... 71
3.4.3 Dispersion efficiency of various shear procedures ... 74
3.4.3.1 Rotational disruptive shear ... 74
3.4.3.2 Oscillatory disruptive shear ... 78
3.4.3.3 Combined rotational and oscillatory disruptive shear ... 81
3.4.4 Consequences on the efficiency of disruptive procedures ... 84
3.5 Conclusions ... 86
3.6 References ... 88
Chapter 4 : New Approach to Assess Build-Up of Cement-Based Suspensions ... 93
4.1 Abstract... 94
4.2 Introduction ... 95
4.3 Research significance ... 97
4.4 Experimental program ... 98
4.4.1 Materials and mixture proportions ... 98
4.4.2 Test methods ... 100
4.5 Results and discussion ... 102
4.5.1 Critical strain ... 102
4.5.2 Percolation time and rigidification rate ... 102
4.5.3 Build-up of cement suspensions ... 108
4.5.4 Build-up vs. lateral pressure ... 113
4.6 Conclusions ... 117
4.7 References ... 118
Chapter 5 : Physico-Chemical Kinetics of Structural Build-Up of Neat Cement-Based Suspensions ... 123
5.1 Abstract... 124
5.2 Introduction ... 125
5.4 Experimental program ... 128
5.4.1 Materials, mixture proportions, and mixing sequence... 128
5.4.2 Test methods ... 130
5.5 Results and discussions ... 132
5.5.1 Structural build-up measurements ... 132
5.5.1.1 LVED and critical strain ... 132
5.5.1.2 Physico-chemical structuration... 133
5.5.2 Physical consequences ... 137
5.5.2.1 Surface interactions ... 138
5.5.2.2 Brownian interactions ... 151
5.5.3 Cement hydration and nucleation intensity ... 161
5.5.3.1 Effect of mixture parameters on the heat flow ... 161
5.5.3.2 Nucleation and growth rate constants (BNG model)... 163
5.5.3.3 Effect of mixture parameters on the nucleation and growth rate constants... 165
5.6 Modelling the kinetics of structural build-up ... 168
5.6.1 Modelling of the percolation time (tperc.) ... 169
5.6.2 Modelling of the rigidification rate (Grigid.) ... 170
5.6.3 Accuracy of the proposed model ... 172
5.6.4 Significance of the microstructural parameters ... 173
5.7 Conclusions ... 176
5.8 References ... 177
Chapter 6 : Conclusions and Future Work ... 185
6.1 Conclusions ... 185
6.1.1 Performance evaluation of disruptive shears ... 185
6.1.2 Quantifying the physical and chemical kinetics of build-up ... 186
6.1.3 Role of mixture parameters on the kinetics of build-up ... 187
6.2 Future work ... 189
6.3 Conclusions en français ... 191
6.3.1 Évaluation de la performance des cisaillements perturbateurs ... 191
6.3.2 Quantification des cinétiques physiques et chimiques de l’accumulation... 192
6.3.3 Rôle des paramètres de mélange sur la cinétique de l’accumulation ... 194
xiii
LIST OF FIGURES
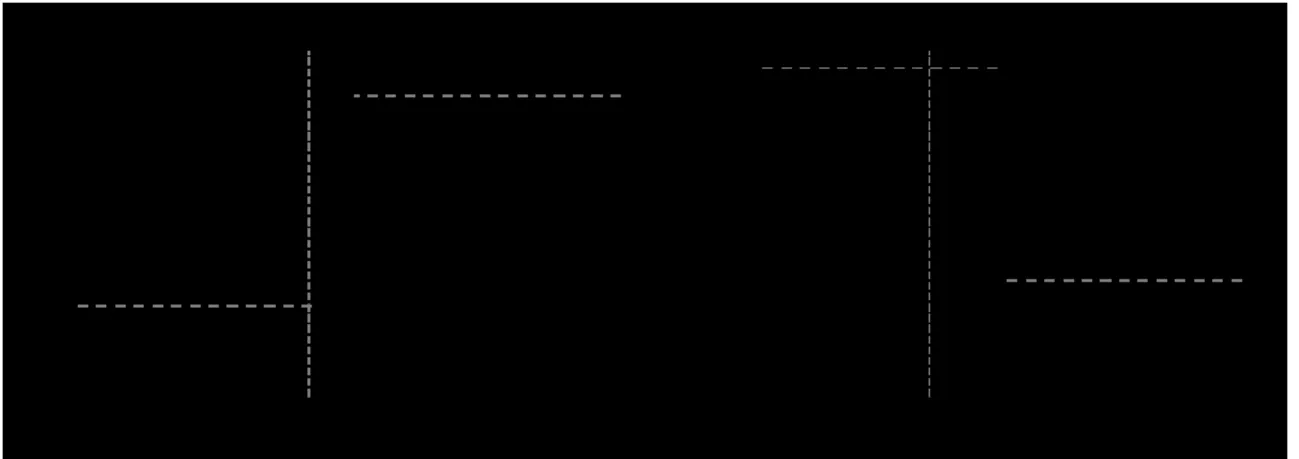
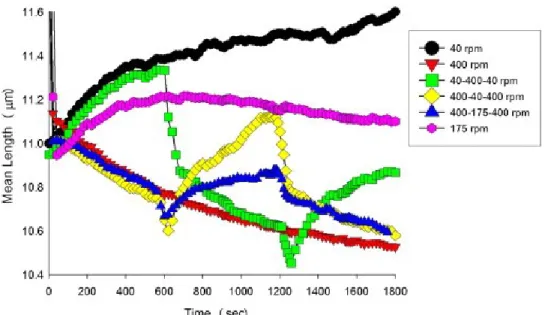
Figure 2.1 - Shear flow of a viscous Newtonian fluid ... 10 Figure 2.2 - The flow curves for a Newtonian, shear-thinning (Pseudoplastic), shear-thickening (Dilatant) and yield stress material (Bingham)... 11 Figure 2.3 - The thixotropic behavior during a step experiment; a) Thixotropic material, b) anti-thixotropic material... 13 Figure 2.4 - Breakdown and build-up of a 3-D thixotropic structure (Barnes 1997) ... 13 Figure 2.5 - Mean chord length evolution when subjected to different shearing conditions (Ferron et al. 2013) ... 15 Figure 2.6 - Counts per second when subjected to different shearing conditions (Ferron et al. 2013) ... 15 Figure 2.7 - Various types of response to a sudden reduction in shear rate (a): b) viscoelastic; c) inelastic thixotropic; d) most general (Mewis and Wagner 2009) ... 16 Figure 2.8 - The two-plates-model and oscillatory shear, adapted from (Mezger 2011) ... 17 Figure 2.9 - The time-dependent stress, strain, and shear rate functions for the cases of perfect elastic, perfect viscous, and viscoelastic material, adapted from (Mezger 2011) ... 18 Figure 2.10 - Schematic illustration of the strain sweep test at a fixed frequency ... 20 Figure 2.11 - Schematic illustration of the variations of G’ and G” in a strain sweep test, adapted from (Mezger 2011)... 20 Figure 2.12 - Schematic illustration of the frequency sweep test at a constant strain amplitude ... 21 Figure 2.13 – Frequency sweep of two dispersions; dispersion 1 is a gel-like structure while dispersion 2 is a liquid-like structure, adapted from (Mezger 2011)... 22 Figure 2.14 - Schematic illustration of the time sweep test at a constant strain amplitude and frequency ... 22 Figure 2.15 - Schematic representation of different colloidal particles. (Genovese 2012) ... 24 Figure 2.16 - Schematic presentation of the relative importance of forces in concrete for the different components, a) Separation distance is assumed to be 100 times smaller than the particle size. b) Separation distance assumed to be always 1 nm (Flatt 2004b)... 25 Figure 2.17 – Average diameter, radius of curvature and surface to surface separation at the contact points (Roussel et al. 2010) ... 27 Figure 2.18 – Correlation between normalized Hamaker constant and the separation distance between cement particles (Flatt 2004a) ... 28 Figure 2.19 – Attractive energy as a function of distance between particles (Ravina and Moramarco 1993) ... 28 Figure 2.20 – Schematic representation of the double layer (Ravina and Moramarco 1993) ... 30 Figure 2.21 - Repulsive energy as a function of distance between particles (Ravina and Moramarco 1993) ... 31
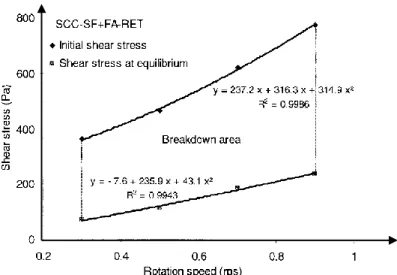
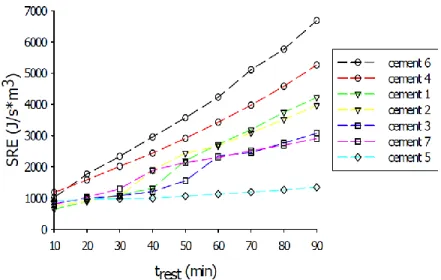
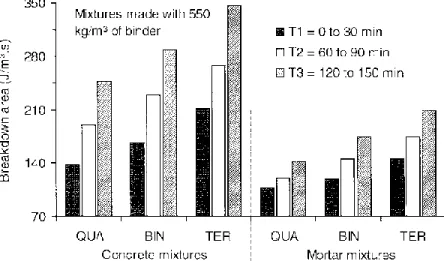
to increasing and decreasing shear rate ramps (Roussel 2006) ... 38 Figure 2.27 – Typical example of structural breakdown curves for SCC (Assaad et al. 2003) 39 Figure 2.28 – Typical example of structural breakdown area calculation (Assaad et al. 2003) 40 Figure 2.29 – An example showing the specific rebuilding energy (SRE) for resting time of 90 minutes (Ferron 2008) ... 41 Figure 2.30 – Typical torque-time profile for concrete (Assaad et al. 2003) ... 42 Figure 2.31 – Results of dynamic yield stress development and structural build-up of cement mixtures made with w/c ranging from 0.34 to 0.42 (Billberg 2006) ... 44 Figure 2.32 – The test protocol to assess the reversible and nonreversible components of thixotropy (Billberg 2006) ... 44 Figure 2.33 – Sketch for the two critical strains. (Left): largest critical strain in a yield stress measurement; (right): smallest critical strain in a strain sweep measurement (Roussel et al. 2012) ... 46 Figure 2.34 – Storage modulus as a function of time for w/c = 0.40 cement paste. Frequency 10 Hz, amplitude 0.5% (Roussel et al. 2012) ... 47 Figure 2.35 – The breakdown area (Ab) for different particle distances (d) (Lapasin et al. 1983b) ... 48 Figure 2.36 – The effect of C3A in cement on the thixotropic hysteresis area by Ish-Shalom and Greenberg as reported in (Billberg 2006) ... 48 Figure 2.37 – The effect of cement type on the specific rebuilding energy (SRE) (Ferron 2008) ... 50 Figure 2.38 – Rate of rebuilding versus C3A content for pastes made with a superplasticizer (Ferron 2008) ... 50 Figure 2.39 – Rate of rebuilding versus alkali content for pastes made with a superplasticizer (Ferron 2008) ... 51 Figure 2.40 – Breakdown area for SCC and CEM mixtures made with ternary cement (Assaad and Khayat 2004) ... 52 Figure 2.41 – Breakdown area for SCC and CEM mixtures made with 550 kg/m³ of binder (Assaad and Khayat 2004) ... 52 Figure 2.42 - Influence of VMA and SP on number of flocs (Ferron et al. 2013) ... 53 Figure 2.43 – Variation of static yield stress with rest time (Abd El Megid 2012) ... 55
Figure 3.1 - (a) MCR 302 coaxial cylinder rheometer; (b) Dimensions of used profiled bob and cup ... 68 Figure 3.2 - Schematic representation of the proposed testing procedures ... 69 Figure 3.3 - Typical measured flow curve (solid line) and apparent viscosity (dashed line) for 0.35 and 0.50 w/c suspensions ... 71 Figure 3.4 - Variation of structural parameters with shear strain for 0.35 w/c suspension. (a) Strain sweep from 0.0001% to 20% at angular frequency of 10 rad/s; (b) Strain sweep from 0.0001% to 250% at angular frequency of 100 rad/s ... 72 Figure 3.5 - Damping factor of 0.35 w/c suspension under different shear strains and angular frequencies ... 73 Figure 3.6 - Shear stress and shear moduli before, during, and after applying a shear rate of 225 s-1 for 100 s, w/c = 0.35 ... 74 Figure 3.7 - (a) Shear stress response before and after rotational disruption; (b) Storage modulus response before and after rotational disruption, w/c = 0.35 ... 75 Figure 3.8 - Storage modulus response before and after rotational disruption, w/c = 0.50 ... 76 Figure 3.9 - Normalized storage modulus for various disruptive shear rates ... 78 Figure 3.10 - Shear stress and shear moduli before, during, and after imposing strain of 3.5% and angular frequency of 100 rad/s for 60 seconds, w/c = 0.35 ... 79 Figure 3.11 - Storage modulus responses obtained before and after oscillatory disruption, w/c = 0.35 ... 80 Figure 3.12 - Storage modulus responses obtained before and after applying a rotational followed by an oscillatory shear. (a) Rotational shear of 150 s-1 followed by various LAOS at angular frequency of 100 rad/s; (b) Rotational shear of 225 s-1 followed by various LAOS at angular frequency of 100 rad/s, w/c = 0.35 ... 82 Figure 3.13 - Storage modulus responses measured before and after applying an oscillatory followed by a rotational shear. (a) Various LAOS at angular frequency of 100 rad/s followed by rotational shear of 150 s-1; (b) Various LAOS at angular frequency of 100 rad/s followed by rotational shear of 225 s-1, w/c = 0.35 ... 83 Figure 3.14 - (a) Normalized storage modulus for various shearing procedures; (b) Normalized damping factor for various shearing procedures, w/c = 0.35... 85 Figure 4.1 - Particle size distribution of NF-GU and HF-GU cements and calcium carbonate 99 Figure 4.2 - Variations of shear moduli with shear strain between 0.0001% and 20% and at angular frequency of 10 rad/s. (G’: full symbol, G”: empty symbol) ... 102 Figure 4.3 - Time sweep measurements at shear strain of 0.001% and angular frequency of 10 rad/s for various solid fractions (Sf) of inert CaCO3 suspensions. Evolutions of (a) storage modulus; (b) phase angle with rest time ... 103 Figure 4.4 - Time sweep measurements at shear strain of 0.001% and angular frequency of 10 rad/s for CaCO3 and HF-GU cement suspensions having solid fraction of 0.48. Evolutions of (a) storage modulus; (b) phase angle with rest time ... 106 Figure 4.5 - Variations of static yield stress with rest time for various cement mixtures ... 109
Figure 5.1 - Particle size distributions of used cements ... 129 Figure 5.2 - Variations of shear moduli with shear strain at an angular frequency of 10 rad/s (mixtures are identified by their w/c, temperature, cement type) ... 132 Figure 5.3 - Evolutions of a) Storage modulus and b) Phase angle at a shear strain of 0.001% and an angular frequency of 10 rad/s for cement mixtures proportioned with different w/c .. 134 Figure 5.4 - Variations of Grigid. and tperc. indices with w/c ... 135 Figure 5.5 - Variations of Grigid. and tperc. indices for suspensions made with different w/c and cement fineness values ... 136 Figure 5.6 - Variations of Grigid. and tperc. indices with temperature ... 136 Figure 5.7 - Variations of Grigid. and tperc. indices with Na2SO4 percentage of LA cement suspensions ... 137 Figure 5.8 - Variations of electro-kinetic properties (ξ, κ-1, conductivity, and pH) with fineness of cement of suspensions (30% solid concentration) ... 140 Figure 5.9 - Variations of electro-kinetic properties (ξ, κ-1, conductivity, and pH) with temperature of suspensions (30% solid concentration) ... 141 Figure 5.10 - Variations of electro-kinetic properties (ξ, κ-1, conductivity, and pH) with percentage of Na2SO4, by mass of LA cement, of suspensions (30% solid concentration) .... 142 Figure 5.11 - The predicted interaction between two fixed charges in the simplified free-energy model with the change in a) w/c; b) cement fineness; c) temperature; d) added Na2SO4 as a percentage of LA cement content ... 149 Figure 5.12 - Number particle distributions and corresponding cumulative volume distributions of GU and LA cements ... 154 Figure 5.13 - SEM images for 0.50 w/c mixture made with a) GU-original; b) GU-8000 ... 155 Figure 5.14 - Variations of dynamic viscosity of equivalent electrolytes with temperature .. 157 Figure 5.15 - Variations of frequency of collisions per 1000 μm3 of paste with the change in a)
w/c; b) cement fineness; c) temperature; d) added Na2SO4 as a percentage of LA cement content ... 160 Figure 5.16 - Heat flow curves during cement hydration for various mixture parameters a) w/c; b) cement fineness; c) temperature; d) added Na2SO4 as a percentage of LA cement content ... 163
Figure 5.17 - Variations of the nucleation and growth constants KB and KG for various mixture parameters a) w/c; b) cement fineness; c) temperature; d) added Na2SO4 as a percentage of LA cement content ... 167 Figure 5.18 - Measured and predicted tperc. as function of microstructural parameters (αt) .... 170 Figure 5.19 - Measured and predicted Grigid. as function of microstructural parameters (αG) . 172 Figure 5.20 - Comparison between the predicted and measured build-up indices ... 173 Figure 5.21 - Variations of the build-up indices with the microstructural parameters a) tperc.; b) Grigid. ... 175
xix
LIST OF TABLES
Table 2.1 – The dynamic shear parameters for different materials, (Mezger 2011) ... 19 Table 2.2 – The different cement used by (Ferron 2008) ... 49 Table 2.3 – Classification of SCC according to Athix. (Roussel 2006) ... 55 Table 2.4 – Various build-up indices used in (Abd El Megid 2012)... 56 Table 3.1- Mineralogical and physical characteristics of used GU cement ... 67 Table 4.1 - Chemical and physical characteristics of used cement, silica fume, and calcium carbonate ... 98 Table 4.2 - Mixture proportions of cement and calcium carbonate pastes ... 99 Table 4.3 - Zeta potential of HF-GU cement and calcium carbonate suspensions proportioned at 30% solid content ... 106 Table 4.4 - Build-up indices of various cement suspensions ... 110 Table 5.1 - Chemical characteristics of used GU and LA cements ... 128 Table 5.2 - Physical characteristic of GU and LA cements... 129 Table 5.3 - The mixture parameters of investigated cement pastes... 130 Table 5.4 - The chemical potentials of dissolved ions in the pore solutions extracted from cement mixtures at an age of 30 minutes ... 145 Table 5.5 - Characteristics of the Brownian portion in (100 μm3 or 0.315 ng) of cement powders ... 156 Table 5.6 - Number densities of equivalent mono-Brownian particles in 1000 μm3 of paste . 156 Table 5.7 - Ionic concentrations of prepared electrolytes simulating the extracted pore solutions ... 157 Table 5.8 - Estimated physical parameters from the BNG model ... 165 Table 5.9 - Microstructural parameters of the mixtures used for validation ... 173 Table 5.10 - The reference mixture and the range of microstructural parameters used to estimate tperc. ... 174 Table 5.11 - The reference mixture and the range of microstructural parameters used to estimate Grigid. ... 174
xxi
NOTATIONS
Symbol Definition
a Particle radius
a Harmonic average of spherical particles radii
A Hamaker constant
A’ Fitting constant
A(h) Free energy of the system
A* Fitting constant
Ab Breakdown area
Athix. Thixotropic index
B’ Fitting constant
B* Fitting constant
C Number densitiy of Brownian particles D Stokes-Einstein diffusivity
d50S Median surface-based particle size d10V, d50V, d90V Volume-based particle sizes
dmax Diameter of the largest particles in the system dmin Diameter of the smallest particles in the system
e Elementary charge
fC Frequency of collisions
Fdi Force due to the divalent counter-ions Fmo Force due to the mono-counter-ions FVDW Van der Waals attractive force
g Acceleration of gravity
G Growth rate (in Chapter 5)
G Shear modulus
G’ Storage Modulus
G* Complex shear modulus
G” Loss Modulus
Grigid. Rigidification rate
h Separation distance between particles
H Vane diameter
IB Nucleation rate per unit area of cement surface
IC Index of cohesion
KB Rate of covering the surface of cement particles with hydration products in a unit volume of paste
kB Boltzmann constant
Kdi Probability of divalent counter-ions in the confined solution
V
Pe Péclet number
Rep Reynolds number
S Scaling constant converts measured heat flow into a fractional rate of transformation
S1 Rescaled wall-wall separation distance S2 Rescaled wall-wall surface charge density Sd Initial separation distance between particles
Sf Solid fraction
T Absolute temperature
Tmax Maximum torque
tperc. Percolation time
tanδ Damping factor
VBrownian Volume of the Brownian portion
W Stability ratio
w/c Water-to-cement ratio
W∞ Stability ratio in the absence of any stabilizing forces
Z Ion valence
Zeq Valence of the equivalent electrolyte
Angular frequency
Shear strain
(t) Shear strain function A Amplitude of shear strain
γ Shear rate
γ(t) Shear rate function
∆ρ Density difference between the particle and suspending medium ∆ ηapp Drop in apparent viscosity
δ Phase angle
ε0 Relative dielectric permittivity of the vacuum εr Dielectric permittivity of the solvent
xxiii
η* Complex viscosity
η, η0 Viscosity of the suspending medium
μp Plastic viscosity
κ-1 Debye length (thickness of the double layer)
ξ Zeta potential
ρc Density of cement
ρw Density of water
τ Shear stress
τ(t) Shear stress function τe Equilibrium shear stress τi Initial shear stress
τo Dynamic yield stress
τorest Static yield stress
τ0rest@20min Apparent yield stress measured after 20 minutes of rest
ϕ Solid fraction
ϕm Maximum packing fraction
1
CHAPTER 1 : INTRODUCTION
1.1 Problem statement
Over the years, cement-based materials have been widely used worldwide in various construction projects, including buildings, bridges, and tunnels. The design of cement mixtures should be tailored to achieve proper rheological properties and to ensure adequate flow performance and successful casting (Banfill 2006). Thixotropy of cement-based suspensions has a direct impact on their placement and consolidation performance as well as on the microstructural development and overall performance of the hardened materials (Abd El Megid 2012; Banfill 2006; Khayat et al. 2012a; Kwasny et al. 2015; Omran 2009; Wang et al. 2011). Thixotropy is a time-dependent phenomenon describing the decrease in viscosity with time when a flow is applied to a sample that has been previously at rest, and the subsequent recovery of viscosity when the flow is discontinued (Barnes 1997; Mewis and Wagner 2009).
Although thixotropy includes two reversible aspects (build-up at rest and breakdown under shear), the build-up is reported to have a greater impact on the performance of fresh cement-based materials after casting. Typical applications where structural build-up is a key design parameter include:
Tall wall elements: during casting, it is better to use a concrete with a high kinetics of structural rebuilding to reduce the maximum lateral pressure exerted on the formwork and allow a faster pressure decay after casting (Amziane and Ferraris 2006; Assaad 2004; Khayat and Omran 2011; McCarthy et al. 2012; Tchamba et al. 2008). This can result in lower values of the formwork’s design loads and significantly reduce the construction cost of concrete formwork. It is worthy to mention that in the United States, for example, it was reported that the cost of formwork can be as much as 60% (and sometimes even more) of the total cost of the completed concrete structure in place (ACI Committee 347R-14 2014).
Multi-layer casting: it is crucial to design and use concrete with adapted kinetics of structural rebuilding to avoid possible reductions in bond strength between the cast
to allow gaining a sufficient strength level capable of sustaining the weight of subsequently extruded layers (Perrot et al. 2016).
Cement-based suspensions, such as concretes and mortars, are granular materials by nature. They are in fact consist of fine and/or coarse aggregate suspended in a cement suspension. The specific reasons of structural build-up find their origins at the colloidal level (i.e. cement paste). In the case of colloidal suspensions, a three-dimensional structure can be formed at rest due to inter-particle forces, such as the van der Waals attractive forces (Ferron et al. 2013; Flatt 2004). However, in the case of cementitious suspensions, this phenomenon is more complex and is associated to combined physical and chemical effects. Indeed, as soon as cement and water are mixed, the hydration process starts, hence leading to changes in the growth rate of apparent rheological properties (Bentz et al. 1999; Roussel 2012). The degree of structural build-up of cement suspensions is further affected by several mixture parameters, including mixture composition and characteristics of its ingredients as well as temperature and shear history (Assaad and Khayat 2004; Assaad and Khayat 2006; Ferron et al. 2013; Khayat and Assaad 2006; Omran 2009).
Different techniques have been developed to quantify the structural build-up of cement-based suspensions (Amziane et al. 2008; Billberg 2006; Khayat et al. 2012b; Mahaut et al. 2008). Most of these techniques are based on assessing the structuration at rest after the breaking down the internal network structure using a rotational shear flow. Indeed, the accuracy of the measured build-up characteristics relies on the pre-shear regime as well as the shear stress applied during the liquid-solid transition (Coussot 2005; Dullaert and Mewis 2005; Ovarlez and Chateau 2008; Rueb and Zukoski 1997). Moreover, the use of rotational shear flow to measure the apparent
rheological properties at various resting periods can undergo micro-structural rearrangement within the colloidal network. This will result in a destructive regime which necessitates carrying out measurements on renewal mixtures. Furthermore, although various indices have been proposed to describe the overall effect of build-up, they did not provide an insight into the physical and chemical kinetics of structuration. Therefore, they have limited contribution to understanding the key factors affecting the build-up behavior of cement suspensions at rest. To date, limited information exists regarding the use of oscillatory shear flow in quantifying and investigating the build-up of cement suspensions. Indeed, the use of dynamic rheology allows the application of micro shear strains to monitor the viscoelastic properties and structure’s recovery in a non-destructive manner. The overall goal of this research is to employ the dynamic oscillatory shear rheology to describe and monitor the structuration kinetics of cement suspensions at rest. Accordingly, this allows developing more reliable indices to describe the physical and chemical mechanisms of structuration. Such indices can enhance the fundamental knowledge and provide valuable information on the complex kinetics of build-up of cement-based materials. Moreover, they can be useful in understanding the effect of various mixture parameters on build-up behavior of cement-based materials after casting. Such an understanding can contribute in facilitating design and optimization of cement-based materials with adapted build-up given the application on hand.
1.2 Research objectives
Understanding how to design concrete with targeted properties cannot be attained unless a fundamental knowledge of the complex rheological behavior of cement paste is achieved. The main objective of this work is to use the dynamic rheometry to provide a deeper insight into the physical and chemical kinetics of build-up of fresh cement pastes and to identify the key factors affecting this phenomenon. The objectives of this study are:
1. Evaluate the dispersing performance of various shearing procedures that can be applied to obtain a well-dispersed state for cement suspensions.
2. Develop new build-up characteristics that can be used to quantify the physical and chemical kinetics of structural build-up of cement suspensions.
1.3 Outline of the thesis
The thesis is divided into six chapters that might be summarized as follows:
Chapter 1 provides an overview of the research problem and significance as well as the objectives of the research work and a brief summary of the contents of the thesis.
Chapter 2 gives a brief introduction on fundamentals of rheology and thixotropy. In addition, it discusses the origin of thixotropy and the colloidal interactions affecting the flocculation behaviour of cement-based suspensions. This chapter also highlights the existing methods and protocols used to assess thixotropy of cement suspensions. Furthermore, it gives a background on the dynamic rheology and its advantages.
Chapter 3 offers a performance evaluation on the different dispersing shearing procedures that can be applied by the rheometer on fresh cement pastes. The investigated shearing profiles include rotational and oscillatory shear as well as combinations of both. The results of this chapter are used to propose a shearing procedure that can be applied to allow investigating build-up from a well-dispersed state.
Chapter 4 presents the use of non-destructive dynamic rheology in investigating build-up of inert calcite-based suspensions and cement-based suspensions. Moreover, it develops two independent build-up indices that can be used the physical and chemical kinetics of structural build-up of cement suspensions. This chapter also presents the correlation between developed indices and decay of lateral pressure of different cement past mixtures.
Chapter 5 discusses and investigates the effect of mixture parameters on the percolation time and rigidification rate. The investigated parameters include the water-to-cement ratio (w/c), cement fineness, alkali sulfate content, and temperature of suspension. In addition, the corresponding microstructural changes in inter-particle potentials, Brownian effects, and nucleation intensities is evaluated and discussed. It also correlates the developed build-up indices to the microstructural changes of cement suspensions.
Chapter 6 provides a summary and an overview of main findings obtained in the study. Recommendations for future work are also presented.
It worth mentioning that, Chapters 3, 4, and 5 were corresponding to four submitted and published technical papers in scientific journals as follows:
Chapter 3: Mostafa, A. M., Diederich, P., and Yahia, A. (2015). "Effectiveness of rotational shear in dispersing concentrated cement suspensions." Journal of Sustainable Cement-Based Materials, 4(3-4), 205-214.
Mostafa, A. M., and Yahia, A. (2015). "Performance evaluation of different rheometric shearing techniques to disperse concentrated cement suspension." Applied Rheology, 25(3), 34337. Chapter 4: Mostafa, A. M., and Yahia, A. (2016). "New approach to assess build-up of cement-based suspensions." Cement and Concrete Research, 85, 174-182.
Chapter 5: Mostafa, A. M., and Yahia, A. (2016). "Physico-chemical kinetics of structural build-up of neat cement-based suspensions.", submitted to Cement and Concrete Research, June 2016.
Amziane, S., Perrot, A., and Lecompte, T. (2008). "A novel settling and structural build-up measurement method." Measurement Science and Technology, 19(10), 105702.
Assaad, J. (2004). Formwork pressure of self-consolidating concrete: Influence of thixotropy, Doctoral thesis, Université de Sherbrooke, pp. 464.
Assaad, J., and Khayat, K. H. (2004). "Assessment of thixotropy of self-consolidating concrete and concrete-equivalent-mortar - Effect of binder composition and content." ACI Materials
Journal, 101(5), 400-408.
Assaad, J. J., and Khayat, K. H. (2006). "Effect of viscosity-enhancing admixtures on formwork pressure and thixotropy of self-consolidating concrete." ACI Materials Journal, 103(4), 280-287.
Banfill, P. F. G. (2006). "Rheology of fresh cement and concrete." Rheology Reviews, 61-130. Barnes, H. A. (1997). "Thixotropy—a review." Journal of Non-Newtonian Fluid Mechanics, 70, 1-33.
Bentz, D. P., Garboczi, E. J., Haecker, C. J., and Jensen, O. M. (1999). "Effects of cement particle size distribution on performance properties of Portland cement-based materials."
Cement and Concrete Research, 29(10), 1663-1671.
Billberg, P. (2006). Form pressure generated by self-compacting concrete—Influence of
thixotropy and structural behaviour at rest, Doctoral thesis, Royal Institute of Technology,
SE-100 44 Stockholm, Sweden, pp. 105.
Coussot, P. (2005). Rheometry of pastes, suspensions, and granular materials: applications in
industry and environment, New Jersey: John Wiley & Sons. 291 p.
Dullaert, K., and Mewis, J. (2005). "Thixotropy: Build-up and breakdown curves during flow."
Journal of Rheology, 49(6), 1213-1230.
Ferron, R. D., Shah, S., Fuente, E., and Negro, C. (2013). "Aggregation and breakage kinetics of fresh cement paste." Cement and Concrete Research, 50(0), 1-10.
Flatt, R. J. (2004). "Dispersion forces in cement suspensions." Cement and Concrete Research, 34(3), 399-408.
Khayat, K. H., and Assaad, J. J. (2006). "Effect of w/cm and high-range water-reducing admixture on formwork pressure and thixotropy of self-consolidating concrete." ACI Materials
Journal, 103(3), 186-193.
Khayat, K. H., and Omran, A. F. (2011). "Field validation of SCC formwork pressure prediction models." Concrete International, 33(6), 33-39.
Khayat, K. H., Omran, A. F., and Al Magdi, W. "Evaluation of thixotropy of self-consolidating concrete and influence on concrete performance." Presented at Proceedings 3rd Iberian
Congress on Self Compacting Concrete, Madrid.
Khayat, K. H., Omran, A. F., Naji, S., Billberg, P., and Yahia, A. (2012b). "Field-oriented test methods to evaluate structural build-up at rest of flowable mortar and concrete." Materials and
Structures, 45(10), 1547-1564.
Kwasny, J., Sonebi, M., Plasse, J., and Amziane, S. (2015). "Influence of rheology on the quality of surface finish of cement-based mortars." Construction and Building Materials, 89, 102-109. Mahaut, F., Mokeddem, S., Chateau, X., Roussel, N., and Ovarlez, G. (2008). "Effect of coarse particle volume fraction on the yield stress and thixotropy of cementitious materials." Cement
and Concrete Research, 38(11), 1276-1285.
McCarthy, M. J., Dhir, R. K., Caliskan, S., and Ashraf, M. K. (2012). "Influence of self-compacting concrete on the lateral pressure on formwork." Proceedings of the ICE-Structures
and Buildings, 165(3), 127-138.
Mewis, J., and Wagner, N. J. (2009). "Thixotropy." Advances in Colloid and Interface Science, 147-148(0), 214-227.
Omran, A. F. (2009). Formwork pressure exerted by self-consolidating concrete, Doctoral thesis, Université de Sherbrooke, pp. 332.
Ovarlez, G., and Chateau, X. (2008). "Influence of shear stress applied during flow stoppage and rest period on the mechanical properties of thixotropic suspensions." Physical Review E, 77(6), 1403-1403.
Perrot, A., Rangeard, D., and Pierre, A. (2016). "Structural build-up of cement-based materials used for 3D-printing extrusion techniques." Materials and Structures, 49(4), 1213-1220. Roussel, N. (2012). Understanding the rheology of concrete, Cambridge: Woodhead Publishing. 364 p.
Roussel, N., and Cussigh, F. (2008). "Distinct-layer casting of SCC: The mechanical consequences of thixotropy." Cement and Concrete Research, 38(5), 624-632.
9
CHAPTER 2 : LITERATURE REVIEW
2.1 Introduction
This chapter provides background information on rheology of different types of materials, dynamic oscillatory shear rheology, and mechanisms of attraction and repulsion between colloidal particles. In addition, a survey of the previous work on the origin of build-up of cement suspensions, the experimental methods to quantify thixotropy, and the factors affecting cementitious materials thixotropy is discussed. Finally, a brief introduction on the indices used to quantify build-up of cement-based suspensions is discussed.
2.2 Rheology of materials
Rheology can be defined as the science of the deformation and flow of matter (Barnes et al. 1989). Rheology can be used to optimize the proportions of concrete mixtures in order to obtain certain flow properties. Furthermore, rheology allows the evaluation of the effects of mixture constituents on the obtained flow performance (Banfill 2006). In general, rheology is concerned with all types of materials including elastic, viscous, and viscoelastic materials. The following sections summarize the response of different types of materials when subjected to a shear stress.
2.2.1 Elastic materials
An ideal elastic (solid) material deforms instantaneously when subjected to a stress, where the energy invested in deforming the solid is fully stored. After removing the shearing stress, the original shape is restored and induced deformation vanishes. For these materials, the elastic strain is linearly related to the stress applied hence, Hooke’s law can be applied (Equation 2-1) (Barnes 2000; Macosko 1994):
For perfectly viscous materials, Isaac Newton (1687) proposed the following relationship: “The resistance which arises from the lack of slipperiness originating in a fluid is proportional to the velocity by which the parts of the fluids are being separated from each other” (Macosko 1994). In this case, the viscous liquid deforms continuously under constant shear stress. In addition, induced deformation will not be recovered after the removal of applied stress. The flow of a perfectly viscous (Newtonian) fluid between two parallel plates is shown in Figure 2.1. In the case of a constant viscosity with time, a linear relationship between shear stress and shear rate can be obtained according to Equation 2-2:
Figure 2.1 - Shear flow of a viscous Newtonian fluid
dv
η
η
dy
Equation 2-2where, τ is the shear stress, η is the viscosity, and dv/dy is the velocity gradient or shear rate (dγ/dt).
11
When a constant stress is applied on a perfectly viscous material, the angle of deformation changes at a constant rate. Once the stress is removed, the viscous material stays in its final shape. Therefore, the viscous material does not have any memory (Macosko 1994). In most cases, the ratio between shear stress and shear rate (i.e. the viscosity) is not constant and depends on the instantaneous shear rate (Figure 2.2).
Figure 2.2 - The flow curves for a Newtonian, thinning (Pseudoplastic), shear-thickening (Dilatant) and yield stress material (Bingham)
Liquids that exhibit an increase in viscosity when the shear rate increases are known as dilatants (shear-thickening). On the other hand, fluids that exhibit a decrease of their viscosity when their shear rate increases are characterized as pseudo-plastic fluids (thinning). A power-law model can be applied to describe the thinning and shear-thickening behaviors (Equation 2-3):
n
m
Equation 2-3where, m is the consistency factor and n is the consistency index.
In this model, the value of “n” is used to distinguish between the thinning and thickening behaviors. For n < 1, the material is a thinning, for n > 1, it is a shear-thickening and Newtonian if n = 1.
where, τo is the yield stress and μp is the plastic viscosity.
2.2.3 Viscoelastic materials
Viscoelastic materials are materials that exhibit both elastic and viscous behaviours when undergoing deformations or stresses. At a constant stress, the viscoelastic material behaves as an elastic material and undergoes an instantaneous strain. Then, with time, strain increases due to the viscous properties. Once the load is removed, only the elastic deformation will be recovered. In other words, these materials can store some of the induced energy and use it for the recovery, and dissipate the rest by means of friction (Macosko 1994). Several tests can be used to investigate the viscoelastic properties. This includes creep, stress relaxation, and oscillatory tests. More details about the oscillatory tests and dynamic rheology will be presented in Section 2.4.
2.2.4 Thixotropic materials
Thixotropy can be defined as a decrease of the viscosity with time under a constant shear stress or shear rate, followed by a gradual recovery when the stress or shear rate is removed (Barnes 1997). This definition clearly refers to a reversible and time-dependent phenomenon (Figure 2.3).
13
Figure 2.3 - The thixotropic behavior during a step experiment; a) Thixotropic material, b) anti-thixotropic material
Thixotropic behavior occurs because it takes a finite time for the microstructure to change from one state to another. The decrease in apparent viscosity with time under constant shear is believed to be due to micro-structural changes in the suspension. This decrease in viscosity will continue with the shearing time until an equilibrium state (the lowest energetically possible state) is achieved. Thus, the thixotropic time, in which the micro-structural changes take place, is an important parameter when studying thixotropy (Mewis and Wagner 2012). The transition of the material from the at-rest to shearing conditions, and vice versa, is illustrated in Figure 2.4.
agglomerates. The continuous shearing results eventually in reaching an equilibrium state in which the agglomerates cannot be broken into smaller fragments. At rest, the particles can form agglomerate into a network by means of weak physical bonds (Wallevik 2003). The rheological behavior of the suspension is related to the formed network structure and the rate at which it can form. It has been admitted by (Roussel 2006) that a thixotropic concrete is a concrete that displays a short flocculation characteristic time (typically several minutes) and a de-flocculation characteristic time of several tens of seconds in the 1 to 10 s-1 shear rate range.
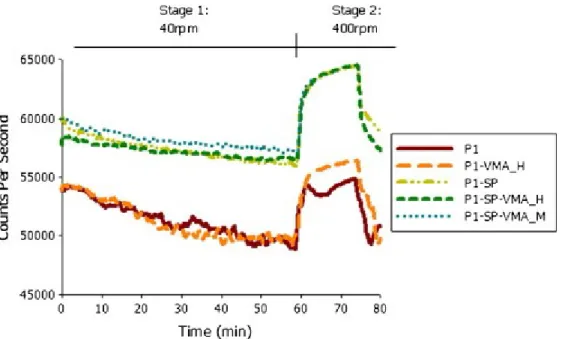
The size distribution of the flocs formed within the fresh state under different shearing conditions has been monitored in real-time using a Focused Beam Reflectance Measurement (FBRM) (Ferron et al. 2013). The variations of the mean chord length, representing the floc size, as well as the counts per seconds, reflecting the number of agglomerates, with different shearing conditions of 0.30 w/c mixture are shown in Figure 2.5 and Figure 2.6, respectively. At the case of a stirring intensity of 40 rpm, the mean chord length gradually increases over time, which shows that the kinetics of aggregation can dominate at low shearing conditions due to the orthokinetic aggregation. Simultaneously, the number of counts decreased reflecting the phenomena of floc formation. On the other hand, the application of a higher shearing intensity of 400 rpm resulted in a reduction in the flocs size and an increase in their number, indicating a disaggregation process. Furthermore, it was found that the aggregation and breakage kinetics of the paste matrix are highly influenced by shear history and the time scale for recovery is longer than the time needed to breakdown the structure.
15
Figure 2.5 - Mean chord length evolution when subjected to different shearing conditions (Ferron et al. 2013)
Figure 2.6 - Counts per second when subjected to different shearing conditions (Ferron et al. 2013)
Several techniques were proposed to evaluate the degree of thixotropy of cement-based materials, such as the hysteresis area, breakdown area, and start-up test. A summary for the most applicable quantifying techniques is given in Section 2.7.
similar conditions the shear stress in an inelastic thixotropic material would drop instantaneously to a lower value, and evolves gradually in the opposite direction to its new steady state (Figure 2.7-c). The most general response would be a combination of the two types, i.e. a sudden drop and a gradual stress relaxation and finally a slow, gradual increase in viscosity (Figure d). Because of the time-dependent viscosity recovery in Figure 2.7-c and Figure 2.7-d, these two 2.7-cases are 2.7-considered thixotropi2.7-c (Mewis and Wagner 2009).
Figure 2.7 - Various types of response to a sudden reduction in shear rate (a): b) viscoelastic; c) inelastic thixotropic; d) most general (Mewis and Wagner 2009)
17
2.4 Dynamic oscillatory shear rheology
The principles of the oscillatory tests can be illustrated using a two-plates-model in as shown in Figure 2.8 (Mezger 2011).
Figure 2.8 - The two-plates-model and oscillatory shear, adapted from (Mezger 2011) In this model, the tested material is located between two plates where the lower plate is stationary while the upper one is oscillating by means of a drive wheel and a pushing rod. One complete rotation of the driving wheel from 0º to 360º corresponds to a one single shearing cycle. The performed number of shearing cycles per unit time represent the frequency. At positions of 90º and 270º, the deformation of the material between the two plates is maximum (i.e. maximum shear strain) and the speed is zero (i.e. zero shear rate). Conversely at 0º and 180º, the moving plate is in the zero position reflecting a zero shear strain and maximum shear rate. In the case of a perfect solid material, Hooke’ law applies as follows:
τ(t) G γ(t)
Equation 2-5where, τ(t) and (t) are the sine functions of shear stress and strain, respectively, and G* is the complex shear modulus. Since G* is constant, the shear stress response will be always “in phase” with the induced shear strain (i.e. the phase angle δ = 0). The induced strain function is:
Figure 2.9 - The time-dependent stress, strain, and shear rate functions for the cases of perfect elastic, perfect viscous, and viscoelastic material, adapted from (Mezger 2011) In the case of an ideally viscous material, Newton’s law applies:
19
τ(t) η γ(t)
Equation 2-8where, η* is the complex viscosity and γ(t) is the shear rate function. As far as the value of η* is constant, the shear stress is in phase with the shear rate and “out of phase” with the shear strain by a delay (δ) of 90º (Figure 2.9). In the case of a perfect viscous material η* = G”/, where G” is the loss modulus reflecting the deformation energy spent by the material to change its structure during shearing. Rearranging Equation 2-8 and keeping in mind that
γ(t) = d(t)/dt, the measured stress can take the following expression:
A
τ(t) G" γ cosωt
Equation 2-9When performing oscillatory tests on a viscoelastic material, an in-between situation will persist, where the phase angle (δ) will exhibit a value between 0º and 90º and the stress response will be a function of both G’ and G” as follows:
A A
τ(t) G' γ sin ωt G" γ cosωt
Equation 2-10tan δG" G ' Equation 2-11
where, tan δ is the damping factor describing the ratio of the viscous and the elastic portions of the viscoelastic deformation. A classification of the materials based on the oscillatory parameters is shown in Table 2.1 (Mezger 2011).
Table 2.1 – The dynamic shear parameters for different materials, (Mezger 2011)
Ideally viscous
flow behavior viscoelastic liquid Behavior of a behavior showing Viscoelastic 50/50 ratio of the viscous and elastic
portions Behavior of a viscoelastic gel or solid Ideally elastic deformation behavior δ = 90° 90°>δ > 45° δ = 45° 45°>δ > 0° δ = 0° tan δ →∞ tan δ >1 tan δ =1 tan δ <1 tan δ →0
G’→0 G”>G’ G” =G’ G’>G” G” →0
2.4.1 Strain sweep
The amplitude sweep test is an oscillatory test that is carried out by increasing the induced strain values while keeping the frequency at a constant value (Figure 2.10). The main
Figure 2.10 - Schematic illustration of the strain sweep test at a fixed frequency
Figure 2.11 - Schematic illustration of the variations of G’ and G” in a strain sweep test, adapted from (Mezger 2011)
In the first domain, which corresponds to low strain values, the storage and loss moduli are constant and independent on the value of applied strain (i.e. linear viscoelastic domain, LVED). On the other hand, for a strain values higher than a critical strain value, the nonlinear domain appears where G’ and G” become functions of the applied strain indicating a large amplitude oscillatory shear (LAOS). Preforming the oscillatory tests at strain values within the LVED (i.e. small amplitude oscillatory shear, SAOS) can ensure non-disturbing the microstructure, hence non-destructive measurements (Mezger 2011;
21
Roussel et al. 2012). The critical strain value defining the LVED corresponds to the strain value at which the G’ or G” values begin to deviate noticeably from the preceding constant values.
2.4.2 Frequency sweep
These tests are performed by varying the frequency while keeping the strain amplitude constant (Figure 2.12). The G’ and G” at low frequencies describe the long-term behaviour of the samples. Conversely, the short-term behaviour is expressed at high frequencies (i.e. rapid motion) (Mezger 2011).
Figure 2.12 - Schematic illustration of the frequency sweep test at a constant strain amplitude
The frequency sweep is very important, particularly for investigating the behaviour of polymer melts. In the case of dispersions such as paints, this test can be used to evaluate their long-term storage stability (i.e. sedimentation stability). An illustration for the variations of the shear moduli with the angular frequency for two different types of dispersions is shown in Figure 2.13. A dispersion exhibiting a G’ > G” corresponds to a gel-like structure and physical stability at rest. On the other hand, dispersions showing a G” > G’ at low frequencies corresponds to a liquid-like structure where floating and phase separation is expected (Mezger 2011).
Figure 2.13 – Frequency sweep of two dispersions; dispersion 1 is a gel-like structure while dispersion 2 is a liquid-like structure, adapted from (Mezger 2011)
2.4.3 Time sweep
During the time sweep measurements, an oscillatory shear is applied at a constant strain amplitude and frequency (Figure 2.14). This allows observing the time-dependent changes in the viscoelastic properties (i.e. G’ and G”). Preforming the time sweep measurements using SAOS where the applied strain value is within the LVED ensures following the microstructural changes in a non-destructive manner (Mewis and Wagner 2009). In the case of inert suspensions or gels, the presence of a particulate network would be reflected by a plateau in the storage modulus after a given resting period.
Figure 2.14 - Schematic illustration of the time sweep test at a constant strain amplitude and frequency
23
2.5 Colloidal suspensions
Suspensions are mixtures of solid particles (suspended phase) in a liquid medium (suspending material). In the case of concrete suspensions, the suspended solid particles consist of non-colloidal particles, such as coarse and fine aggregate, as well as colloidal particles, such as cement and in some cases mineral additives such as silica fume. Colloidal particles refer to the elements which exhibit weak gravitational to Brownian effects and whose motions are affected by thermal forces (Mewis and Wagner 2012). The size of the colloidal particles ranges from a few nanometers to a few micrometers (Qin and Zaman 2003; Russel and Schowalter. 1989). The smaller size limit ensures that the mass of the colloid is significantly larger than the mass of the molecules comprising the suspending fluid. On the other hand, the upper size limit ensures that thermal forces are still significant compared with the gravitational one (Mewis and Wagner 2012). It was demonstrated that cement particles larger than 40 μm in diameter seem to behave, at least to some degree, as colloid particles (Wallevik 2009).
The nature of the inter-particle forces between the colloidal particles determines the microstructure of the suspended phase, hence the flow behavior of the suspension. The colloidal suspensions can be classified as follows (Genovese 2012):
Hard-sphere suspensions: no inter-particle forces other than infinite repulsion at contact. These rigid, inert, spherical particles are called hard-spheres as shown in Figure 2.15 (a-b).
Stabilized suspensions: net repulsive forces keep particles separated as shown in Figure 2.15 (c-d).
Aggregated suspensions: net attractive forces produce particle aggregation as shown in Figure 2.15 (e). Above the gelation concentration, aggregates interconnect into a network, forming a gel shown in Figure 2.15 (f).
Figure 2.15 - Schematic representation of different colloidal particles a) isolated hard-spheres, b) caged and packed mono-disperse spheres at random close packing (RCP), and face centered cubic array (FCC), c) isolated repelling particles (dashed line represents the range of the repulsive potential), d) caged repelling particles, e) isolated fractal clusters of
aggregated particles (dashed line represents the smallest enclosing sphere), and f) network of fractal clusters. (Genovese 2012)
Generally, the forces affecting the behavior of solid particles in concrete suspensions are related to: gravity, inertia, viscous drag, dispersion (van der Waals), electrostatic and Brownian forces. The relative importance of these forces for each class of particles was examined using dimensionless numbers, in which the normalization term is the gravity force (Figure 2.16) (Flatt 2004b).
25
Figure 2.16 - Schematic presentation of the relative importance of forces in concrete for the different components, a) Separation distance is assumed to be 100 times smaller than
the particle size. b) Separation distance assumed to be always 1 nm (Flatt 2004b) As can be observed, the most important forces in the colloidal range (silica fume) are dispersion, electrostatic and Brownian, followed by viscous drag. On the other hand, gravity, viscous, and inertia forces are the most important forces in case of non-colloidal range (coarse aggregate) (Flatt 2004b). More details on the forces governing the colloidal particles at rest will be presented in the next Sections.
where, kB is the Boltzmann constant, T is the absolute temperature, and “a” is the radius of the particle. The Brownian forces work as a thermal randomizing force, allowing the particles undergo constant translational and rotational movements. Brownian motion is only noticeable for particles smaller than roughly 1 μm (Macosko 1994). In this case, effect of the Brownian force becomes similar or higher than the effect of gravity. However, for larger particles, the energy exerted by temperature is too low, compared to gravity force so the thermal activation is not expected to influence the behavior of the suspension.
2.5.2 Van der Waals attractive forces
Attractive forces arise from the ever-present quantum mechanical effects caused by fluctuations in the electron clouds surrounding atoms (Mewis and Wagner 2012). The atoms of one colloid induce polarization in the atoms of another. Van der Waals force is the general term for all the weak inter-molecular attractive forces existing between neutral molecules. These forces are significant only when particles are very close to each other (by the action of Brownian motion). In regard to thixotropy of colloidal cement suspensions, the inter-molecular bonds are easily broken by shear; thus, it is likely that these weak secondary bonds will control the reversible coagulation and de-flocculation. There are three main types of theses secondary forces: dipole-dipole interactions, hydrogen bonds, and London dispersion force (Macosko 1994).
In 1937, Hamaker proposed a molecular model to calculate the attractive van der Waals force between particles. This model is based on the summation of the van der Waals energies between all pairs of molecules in separate particles (Overbeek 1977). In the range