HAL Id: hal-01008501
https://hal.archives-ouvertes.fr/hal-01008501
Submitted on 9 Oct 2020
HAL is a multi-disciplinary open access
archive for the deposit and dissemination of
sci-entific research documents, whether they are
pub-lished or not. The documents may come from
teaching and research institutions in France or
abroad, or from public or private research centers.
L’archive ouverte pluridisciplinaire HAL, est
destinée au dépôt et à la diffusion de documents
scientifiques de niveau recherche, publiés ou non,
émanant des établissements d’enseignement et de
recherche français ou étrangers, des laboratoires
publics ou privés.
Distributed under a Creative Commons Attribution| 4.0 International License
Modelling of marine growth effect on offshore structures
loading using kinematics field of water particle
Franck Schoefs, Morgan Boukinda
To cite this version:
Franck Schoefs, Morgan Boukinda. Modelling of marine growth effect on offshore structures loading
using kinematics field of water particle. 14th International Offshore and Polar Engineering Conference
and Exhibition (ISOPE04), 2004, Toulon, France. �hal-01008501�
Modelling of marine growth effect on offshore structures
loading using kinematics field of water particle
Franck Schoefs and Morgan Boukinda
Université de Nantes, Research Institute of Civil Engineering and Mechanics GeM - UMR CNRS 6183, Sea and Litoral research Institute, IUML - FR CNRS 3473
Université de Nantes is a founding member of WEAMEC, Nantes , France
ABSTRACT
Structural response to extreme events or fatigue loading and structural integrity are major criteria to be quantified in a rational process of reassessment for offshore structures. It is now well established that the probabilistic mechanics approach gives an efficient means for measuring the relative changing in safety level compared to a predefined requirement. This paper proposes a probabilistic modelling of marine growth effects based on both Response Surface Methodology and the panel of available tests in laboratory. This method is here suggested to condition hydrodynamics coefficient to particle kinematics field randomness.
INTRODUCTION
The proposed paper takes place in the actual challenge for the reassessment of existing offshore structures where some uncertainties are to be quantified on the basis of inspection reports analysis. When studying the mechanical behaviour of structures placed in severe environmental conditions as offshore platforms, the structural reliability analysis offers, after decades of developments, a set of robust tools and methods. It leads to state the importance of uncertainty and sensitivity analysis especially in view to characterise the stochastic structure of the loading acting on the platforms. One must consider the intrinsic randomness of waves and the uncertainty on the modelling of fluid-structure interaction in their relative contribution to the response i.e. the load on the structure. Particularly, one must take into account the natural cluster of organisms i.e. the marine growth fouling (kelps, mussel beds ...) versus a probabilistic modelling. In fact, this settlement of the structure includes the major uncertainty source in term of diameter increment and hydrodynamic coefficients level. Its corresponding uncertainty evolves upon several factors (seasons, depth, ... ) and during the life of the structures and is greater at the design step when no inspection reports are available. For steel fixed offshore structures like Jacket or Jack-up platforms, the hydrodynamic overloading caused by marine growth is major in terms of percentage on each component and consequently on their summation for the external global loading assessment. Only effects on these platforms are considered here.
Because of the cost of under-water inspections, it is not realistic to
research a complete description of the marine growth during the life of the structure and to require a cleaning program based on this complete knowledge. In fact, database are very poor, and assumption are to be specified on the basis of rational criteria.
The proposed paper reviews the actual practice of marine growth modelling in terms of loading and test procedures. In a second time, probabilistic modelling assumptions are analysed in their relative influence on the load response surface. The response surface methodology comes to be a versatile approach to perform sensitivity studies through Monte Carlo simulations or differential analysis. It leads to a ranking of basic variables and underlines the most important to be modelled. A probabilistic modelling is proposed in the form of a discrete probability density function of hydrodynamics coefficients based on uncertainties on diameter and also on a conditioning to random variables of kinematics fields of water particle. This conditioning is assessed when introducing the hydraulic parameters, the Reynolds and Keulegan-Carpenter numbers, which allows to link the in-site randomness of wave kinematics field to the assessment of hydrodynamic coefficients in laboratories.
For the illustration, the site of the North Sea is selected. Data are taken in the bibliography. The so-called jacket platforms, which are steel framed structures, are considered and subjected to a quasi-static loading during severe conditions (storms).
REVIEW OF MARINE GROWTH MODELLING AND TESTING.
It is instructive to firstly mention the relevant contributions in the literature, which can be distinguished in two families: hydrodynamic modelling from experiments and marine growth physical modelling from in-situ measurements.
In the first way, lot of works have been developed on the basis on sensitivity studies of overloading due to the nature and thickness of marine growth and hydrodynamic structure of flow. As the techniques of flow velocity and acceleration measurements are particularly in-depth, complete studies are mostly recent. In fact, the equipments in water tunnels or large basin are generally costly considering the fact that large-scale experiments must be consider for similitude conservation. Some of them are usefully reviewed and detailed by Sarpkaya (1990). The pioneer works due Sarpkaya (1976; 1977)
Paper No. 2004-JSC-344 Schoefs Page number 2 of 8 concern fixed roughened cylinders placed in a sinusoidally oscillating
flow. Others consider roughened cylinders subjected to sinusoidal oscillation in a large basin with intention of promoting two-dimensional flow (Rodenbusch and Gutierrez, 1983). After this period, another way of experimentation concerns the carriage technique i.e. forced sinusoidally oscillations of a cylinder in a basin (Kasahara, Koterayama and Shimazaki 1987; Wolfram, Jusoh and Sell, 1993; Justesen, 1989, Sell). The relative thickness i.e. thickness k divided by diameter D of clean cylinder tested varies from 1/240 to 1/50. These works contributed largely to a better understanding of relations between the nature and thickness of fouling and relative change of loads. Systematic measurements of Reynolds, Keulegan-Carpenter and Sarpkaya numbers allows to asses precisely the hydrodynamic conditions of the tests. In spite of “controlled laboratory conditions” significant differences in drag, inertia and lift coefficients data are found especially for Keulegan-Carpenter exceeded 8 with no predominant reason (Sarpkaya, 1990). Effects of three-dimensional vortex instability may affect them. A specific work carried out by Theophanatos pointed out that the one-parameter characterization of roughness i.e. k/D is not suitable to embrace all the complexity of fluid-structure interaction and to quantify loading (Théophanatos, 1988). In fact the shape of roughness, effects of soft seaweed, limitation of experimental scales and percentage of covertures have been shown to have a great influence on the results and to be taken into account. Note that in some sites like in the Guinea gulf for instance, waves and currents coexist with a similar contribution to loading and special effects of their combination should be studied (Asao, Tagaki and Uekita, 1986).
In the second way, in situ observation after survey campaigns are analyzed to purpose a modelling of marine growth effects. It is first interesting to define what should be a good inspection i.e. the inspection with the right tool, on the right places at the right time. It is generally advocated to select a pile, or a face of a specific element of which the data are supposed to be representative of the entire level (Wolfram, Jusoh and Sell, 1993). Near the splash area, horizontal members which are generally totally covered are also inspected. The area corresponding to the first thirty meters of depth are generally preferred because of their dominant contribution on hydrodynamic loading. Locally, it is necessary to note with precision the location of the colonized face [10]. Lot of works (see section 1) give a review of marine species present on offshore structures implanted in North Sea (Wolfram, Jusoh and Sell, 1993; Picken, 1985), near India (Sankalpa, 1991), near the west coast of USA (Sharma, 1983). Most of these works define the way to assess the marine growth thickness from circumference measure with an uncertainty depending of the nature of species. Considering now, the impact on hydrodynamic coefficient of Morison equations (Eashwar, Subramanian and Balakrishnan, 1995), it is generally assumed (Wolfram, Jusoh and Sell, 1993) that drag coefficient is obtained following a linear regression with the thickness upon (k/D). Authors generally concluded that data are sparse and that more inspection are needed. Even with these data, there will still be non reducible uncertainties due to intrinsically variable patterns and measurement errors. In attempt to optimize cleaning programs there is a way to introduce this uncertainty through Risk Based Inspections strategy.
These studies allows to advocate guidelines for a probabilistic modelling at a given time : generally the stochastic process of marine growth colonization is unknown. In particular the process of colonization depends strongly on phenomena short in time as seasons ore severe storms during winter which are able to clean part of the structure and on some electrochemistry effects as cathode protection (Eashwar, Subramanian and Balakrishnan, 1995). Recent works show how to introduce seasonal variation for changing the Global Design Number level (Faber, Hansen and Moller, 2001). It leads to less
conservative combination values of marine growth and waves. Finally, it leads to mix a pure reliable approach based on the relative change of safety index levels due to increase of random loads with a deterministic one specifying conservative procedures and implementing sensitivity studies to hypothesis.
The next section deals with the Morison equations and response surface methodology which is well adopted to sensitivity and uncertainty analysis.
RESPONSE SURFACE OF MARINE LOADS
The previous sections give the main trends in view to quantify marine growth effects for overloading purposes. It appears that sources of uncertainty are various. First the data, based on circumferential measurement or R.O.V’s picture interpretation, leads to uncertain estimation on thickness and percentage of cover. Then the force measurements in laboratory and the signal treatment lead to versatile results and to uncertain evaluation of loading. Finally, the use of Morison equations (Morison, O’Brien and Schaff, 1950) for all orientations of components is an expansion of the standard case where the formula as been developed and lead us to introduce uncertainty on the model.
These uncertainties are introduced in the Morison equations. Their expression, translated in local coordinates, indicates that the force per unit span can be separated into drag (1) and inertial (2) components (Fig. 1),
Figure 1. Local coordinates on a beam.
(M) V (M) V 0 0 0 0 0 0 D 2 1 (M) fD mg → → ⎥ ⎥ ⎥ ⎦ ⎤ ⎢ ⎢ ⎢ ⎣ ⎡ θ ρ = D D X C C C π (1) f (M) 1 4 D C 0 0 0 C 0 0 0 C A (M) I 2 X M M = ʹ′ → ⎡ ⎣ ⎢ ⎢ ⎤ ⎦ ⎥ ⎥ ρθmg π (2) where
- ρ is the water density, D the cylinder diameter,
- →V (M) and →A(M) are respectively the instantaneous flow velocity and the acceleration at M point,
- CX, CD, C'X, CM, are hydro-dynamic coefficients (respectively
two drag and two inertia coefficients) for modelling the fluid-structure interaction. There are introduced as model uncertainty variables.
- θmg acts as a multiplying coefficient for taking into account the
"marine growth" screen effects on beam diameter uncertainty.
These equations generally predict the main trends in measured data quite well, once appropriate joint distribution for hydro-dynamics coefficients depending on sea-state parameters and distribution of θmg
can be provided. This factor itself depends of the marine growth nature (hard or soft) and structure (percentage of curvature). Nevertheless Morison equations are not able to translate all the complexity of the
L xb
x
b
→
y
b→
z
b
→
O b Dfluid-structure interaction with enough accuracy (i. e. high frequency content of the flow, gross vortex shedding effects, ...).
Keeping in mind these short comings as source of response problems, they are relevant to introduce non linear effects and their complexity is consistent with respect to the large uncertainty in marine growth or fluid interaction modelling caused by the lack of investigations. In fact higher complexity should be lost in this uncertainty. A matrix response surface has been developed (Labeyrie and Schoefs, 1996) and is shown to be very tractable for sensitivity studies. Such a response enables us to introduce the main uncertainties in flow modelling versus Cd (drag
coefficient) and also the increasing screen effects due to marine growth (θmg). Sensitivity studies have shown (schoefs, 2002) that the variance
of this coefficient Cd contributes up to 61 % to thevariance of external nodal forces when the extreme wave height and and the corresponding period have respectively influence ratios of 35 and 3 % in the wave area. From a probabilistic point of view, these variables are not dependent. This paper proposes a conditioning of Cd to the wave kinematics. By extension, a similar approach can be followed for the other hydrodynamic coefficients.
SENSIBILITY OF THE HYDRAULIC PARAMETERS AND THE DRAG COEFFCIENT
Hydrodynamics coefficients depend mainly on hydraulic parameters (number of Reynolds and Keulegan-Carpenter) and of the relative roughness of the beam element. For our application, a platform in the North Sea is considered and submitted to storm conditions. The water depth is 100 meters and table 1 presents the extreme wave specifications and probabilistic hypotheses considered for numerical applications.
Table 1. Extreme sea state parameters in North Sea (Schoefs, 1995).
Hs : significant wave height : Gumbel distribution :
⎥ ⎦ ⎤ ⎢ ⎣ ⎡ ⎟ ⎠ ⎞ ⎜ ⎝ ⎛ ν − − − = ν u x exp exp Gu, ; 100 years : u = 15.5 m ; ν = 1.2
Tstat : sea state duration ; Exponential distribution with expectation 3hrs
H given (Hs, Tstat) : Gumbel distribution :
⎥ ⎦ ⎤ ⎢ ⎣ ⎡ ⎟ ⎠ ⎞ ⎜ ⎝ ⎛ ν − − − = ν u x exp exp Gu, 2 c H u= s , c 2 2 Hs = ν ,
( )
⎟⎟ ⎠ ⎞ ⎜ ⎜ ⎝ ⎛ φ = s stat H T log c 100 years : Hs= 15.5m ; Tstat = 3hrs ; u = 28.5 m ; ν = 1.9 T given H : Normal (Log-normal) distributed, E(T/H)= φ(H)= 6H+39Hydraulic parameters computing
The Response Surface mentionned in the previous section is based on a matrix Response Surface of the kinematics field. It allows to determine the hydraulic parameters from the stochastic field of particle velocity U following the equations:
Number of Reynolds: ν =U*D Re (3) Number of Keulegan-Carpenter: D T * U Kc= (4) where U stands for the velocity intensity of the particles of the fluid ( m/s ) in extreme conditions, T is the extreme wave period in such sea states (s), ν denotes the kinematic viscosity (m2/s) and D the diameter of cylinders (m).
This Response Surface will be presented in a further paper. For simulations and sensitivity studies, computing is performed for several cylinder diameters (0.5 m, 1m and 1.5 m). The range on water depth
considered here is the first 50 meters were marine growth is mainly present. Only vertical and horizontal orientations of components are considered for illustration. For vertical cylinders, the wave velocity introduced in hydraulic parameters are in the wave plane and in the wave direction (Ux) as for horizontal cylinders, they are in the wave plane, perpendicular to the wave direction (Uy). It leads that the corresponding hydraulic parameters are complementarity, in the sense of the velocity intensity U (Eqs. 5~7).
(
)
( )
2 2 2 2 2 Re * Re ν D U Ux y h v+ = + (5) 2 1 2 2 Re * Rev+ h=C U ; 2 1 ⎟ ⎠ ⎞ ⎜ ⎝ ⎛ = ν D C (6)(
2 2)
( )
2 2 2 2 2 * C *U D T U U Kc Kcv+ h= x+ y = ;( )
2 2 D T C = (7)Where Rev, Kcv,Reh ,Kchare respectively the Reynolds and Keulegan
carpenter numbers for vertical (index v) and horizontal (index h) components.
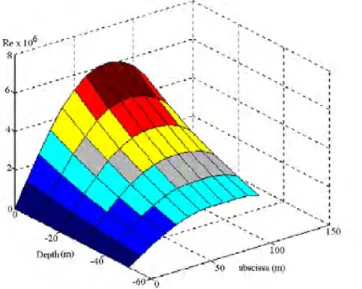
Figure 2. Spatial variation of the Reynolds number for a vertical cylinder of diameter 1 meter.
Figure 3. Spatial Variation of the number of Reynolds for a horizontal cylinder of 1 metre diameter.
Paper No. 2004-JSC-344 Schoefs Page number 4 of 8 Figures 2 and 3 present the variation of the trajectories of the Reynolds
number expectation with depth. To describe this stochastic field indexed by (x,z,t), it is equivalent to consider the index time for a specific location of the structural member and several location of this member in the wave direction. This last option is chosen here and explain the term of abscissa x placed in the figures. For a vertical cylinder (Fig. 2) the Reynolds number is maximal when it is minimal for an horizontal cylinder located at the same depth (Fig. 3). From these figures, well known results can be proved : the velocity intensity and the Reynolds number decreases with depth. Moreover, the statistics of the hydraulic parameters show a very strong variability according to the orientation and the diameter of the cylinder (Boukinda, 2003).
In view to model the marine growth overloading effect from wave kinematics field, there is a need to characterize flow regime. The statistical data obtained on the various common diameters (Boukinda, 2003) lead to the conclusion that for the field studied here, three types of regime are present : sub-critical (Re<105), super-critical and post-critical (Re>3.5*106). They have been determined from Achenbach definitions (Theophanatos, pp. 18-21, 1988). As only a little number of Reynolds numbers are in the sub-critical area, the experimental studies of Théophanatos (1988), being driven for most part in sub and post-critical, will be used to quantify marine growth overloading effect. A comparative study could be based on American Petroleum Institute advice (API recommended practice, pp.113-119, 1993). This one, for modelling of offshore structures in severe environmental condition as in our case, refers essentially to post-critical regime. However to determine drag coefficient they introduce the ratio CD / CDS (CDS for steady-flow drag coefficient at post-critical Reynolds number) which take into account wake amplification in post-critical regime. The use of CDS would be conservative for the statistical calculations of wave forces (API recommended practice, p.114, 1993). The figure below summarizes the area of experimental conditions of both approaches API advice and Théophanatos tests.
Figure 4. Hydraulic experimental conditions of Théophanatos and the API advice.
Analysis of hydraulic parameters random field
Statistical distributions of the hydraulic parameters. The use of an
algebric programming, adapted to the matrix writing of the response surface, presents the advantage to control the properties studied through interface of visualizations (Schoefs, 1996). The discrete distributions plotted on figures 4, 5 and 6 represent the fluctuation of the Reynolds number. They are obtained from the stochastic field describe upon by an integrating over the wave length. These results have been obtained
from a Latin Hypercube Sampling of extreme wave height and period in the North Sea. Similar results have been obtained for the Keulegan-Carpenter number, both for vertical and horizontal cylinders and whatever the diameter.
Figure 5. Example of exponential distribution obtained for a vertical cylinder of diameter 1 meter.
Figure 6. Example of asymmetrical distribution obtained for a vertical cylinder of diameter 1 meter.
Figure 7. Example of normal distribution obtained for a vertical
Tree types of distribution are observed : - an exponential distribution,
- a distribution of dexter or left-hand asymmetrical type, - a distribution of type normal,
A more complete analysis shows that the distributions of asymmetrical type are dominant in surface, near the mean sea level. The distributions following an exponential or normal distribution are more important in depth. However one can find some cases of asymmetrical or normal distributions for several depths (Boukinda, 2003). According to the hypotheses supplied to characterize the sea state (table 1), a normal distribution implies a major influence of the wave period. An asymmetrical distribution indicates a dominant effect of the wave height. In surface, the velocity field is influenced by the height and the period of the swell. The period plays a more dominant role in depth, influencing the intensity statistics of the water particle velocity of the fluid. This result is well known and has been proved in previous paper (Schoefs 1996).
Graphs of iso-values contour. Graphs of iso-values contour allow to
analyze the variation of hydraulic parameters statistics with depth and time. Figure 8 represents contours of the mean of Reynolds number for a vertical cylinder. The abscissa has been divided in subsection of 10 meters. It is too crude to analyze distribution effects -3 meters is better- (schoefs, 1996) but sufficient to evaluate variations of the mean value. It is interesting to underline that the variation of this parameter is significant during a wave flow – from 1.7 to 5.6 106-(abscissa in the graph) and with depth too –from 2.7 to 5.6 106 -. Another point must be underlined and is particularly interesting for the reduction of computational time : the symmetry of the graph. In fact, the wave motion being periodic, the information on intensity of velocity projection is periodic. In particular, in the case where the point is always in water, the values can be treated on a quarter of the period or the wave length. In others cases, non suitable values must be removed. The Figure 9 presents mean values of the Keulegan-Carpenter number for a horizontal cylinder. A similar interpretation can be made. The symmetry versus a vertical axis is obtained for an abscissa of 80 and Kc takes value in a very large range from 15 to 75.
0 10 20 30 40 50 60 70 80 90 100 110 -50 -45 -40 -35 -30 -25 -20 -15 -10 -5 0 Abscissa (m) De p th ( m ) 1.7 1.7 1.7 1.7 1.7 2.7 2.7 2.7 2.7 3.7 3.7 4.6 4.6 5.6 Re x 10e6
Figure 8. Contour of iso-values for mean of Reynolds number (vertical cylinder).
We denote that the symmetry is not perfect in depth for the Keulegan-Carpenter number. This can be due to the role of variables H and T
which varies with depth and can affect the symmetry of distribution and thus the mean value (Labeyrie, Schoefs 1996).
0 10 20 30 40 50 60 70 80 90 100 110 -50 -45 -40 -35 -30 -25 -20 -15 -10 -5 0 Abscissa (m) De p th ( m ) 15 30 30 30 30 45 45 45 45 60 60 60 75 75 Kc 15 15
Figure 9. Contour of iso-values for mean of Keulegan-Carpenter number (horizontal cylinder).
Estimation of drag coefficient for a vertical cylinder. On the basis of
hypothesis presented in table 1, simulations can be performed starting from the response surface of velocity field and expressions on hydraulic parameters. By introducing the factor θmg (see Eqs 1~2) an exhaustive study can be driven to measure the influence of particle kinematics field and marine growth on the hydrodynamic coefficients.
This study focuses on a point of a vertical member at a water depth of 10 meters, in the wave area where the marine growth is of major importance. The present work starts from available data reported by Wolfram (1993) about a colonization of mussels in the North Sea. Mussels are considered in the paper for illustration only and the modelling can be extended to all type of rigid marine growth. From these data we choose the case of a colonization coverage 100 %, average thickness 50 mm, situated between 0 and 10 m of depth. The hydraulic parameters formula in presence of marine growth are given :
D De=θmg× (8) D t mg=1+2 θ (9) Re De U Remg =θmg× ν × = (10) mg mg Kc De T U Kc θ = × = (11)
De stands for effective diameter of the colonized cylinder, θmg for factor
which allows to take into account the screen effect of impact of marine growth, t for average thickness of marine growth, Remg and Kcmg for
hydraulic parameters associated to the presence of marine growth. Let us consider the results obtained by Théophanatos on vertical cylinders. From an hydraulic point of view, the artificial roughness and the mussels allow to make a direct work on curves presented by Théophanatos (p.129, 1988). For cylinders covered with sand, the relative roughness is equal to 0.023. For cylinders covered with pyramids, it is equal to 0.038. These values correspond to the relative
Paper No. 2004-JSC-344 Schoefs Page number 6 of 8 roughness we are needed for respective cylinders of 1.1 m and 0.6 m of
equivalent diameter.
Let us consider now API regulations, the factor of development of the swell (CD / CDS) is introduced. The drag coefficient of the rough and smooth cylinder follow the same evolution when the number of Keulegan-Carpenter is normalized by the CDS (Kc upper than 12). For Kc values lower than 12, it is similar if the number of Keulegan-Carpenter is not normalized by the CDS (API recommended practice, p.114, 1993). This point leads to distinguish between two studies depending of Kc value (Kc < 12 and Kc > 12).
A comparative study on simulation based on these two approaches -Theophanatos tests and APT advice- shows that the drag coefficient differs. Figure 10 presents three statistics of Cd, the minimum Cdmin,
the maximum Cdmax and the mean values obtained for two
representative diameter of O.6 and 1.1 meter. The data collected from the graphs supplied by Théophanatos show a fluctuation less important than that coming from the regulation API. Ones can also note taht the drag coefficients are, altogether, more important when they are established by Théophanatos's curves. A reasoning from the studies of Théophanatos are more conservative in our case.
Figure 10. Comparison API/ Théophanatos (vertical rough cylinders)
Figure 11. Distribution of the drag coefficient according to variation of marine growth’s thickness
By introducing a variation of marine growth thickness of ± 8 mm around the average value 50 mm (Fig. 11), the corresponding relative roughness is quite constant, what allows us to use graphs supplied by Théophanatos. The variation of drag coefficient is very fair for a cylinder of 0.6 m of equivalent diameter and significant for a larger diameter of 1.1 m. The effect of marine growth on the drag coefficient seems to be more important on cylinders of large diameters. In every case, this study shows the interest to lead an analysis more precise on marine growth. This would allow to establish a methodology of
inspection and more rigorous maintenance by a qualification of data base.
PROBABILISTIC MODELLING OF DRAG COEFFICIENT
The previous section leads to conclude that the water particle kinematics field play a dominant role when analyzing hydraulic parameters and then hydrodynamic coefficients. Moreover, this stochastic field governs the randomness on Cd. Besides, test results
show that there is a correlation between hydrodynamic coefficients and hydraulic parameters. Measures of the hydrodynamic coefficients are thus subjected to uncertainty which should be introduced in the probabilistic approach. We propose a probabilistic modelling which takes into account the several sources of randomness or uncertainties in the problem :
- randomness on the numbers of Reynolds and Keulegan-Carpenter, due to the randomness on the sea state parameters in severe conditions.
- uncertainties on the diameter of colonized cylinders ( θmg ) due to
the uncertainty on the model of marine growth evolution or on measurements. Size measurements is probably the most ambiguous aspect of marine growth. The use of a tapemeasure, often employed to estimate the increase of the average thickness, stays a technique very useful but also very subjected to uncertainties on the thickness ( hard fouling) or the length (soft fouling) of the various type of marine growth and generally cannot quantify the variations which occur among member faces (Théophanatos, 1988).
- uncertainties on Cd assessment in tests (in our case, tests made by
several authors).
Scheme of probabilistic modelling. The figure below summarizes the
approach developed here. First the wave height and period, respectively H and T, and the marine growth screen effect θmg are
introduced as basic variables in view to assess the hydraulic parameters as stochastic field. This transfer can be modeled through a response surface. Then a discrete distribution of Cd is obtained by using the transfer of test results and graphs. Results obtained by several authors (A1 and A2 on Fig. 12) can be mixed to increase the number of
available data.
If some authors seems to have made their test in better conditions or in a more realistic way compared to the reality, a weighting can be introduce (w1 and w2 on Fig. 12). The results depend on the subdivision
of hydraulic parameter axis and Cd axis and an optimization should be
proposed. This question is not treated in this paper. In view to simplify following expression of probabilities, we adopt the notation :
) x X x ( P ) X ( P i = i−1< i< i+1 (12) According to the uncertainties connected to the tests and the reliability of the measures, the calculations are balanced. It leads to the probability : ) Kc ( P ) Kc / Cd ( P w ) Kc ( P ) Kc / Cd ( P w ) Cd ( P = 1 A1 i i × + 2 A2 i i × (13) ) Cd ( P ) Cd ( P n 1 i i
∑
= = w P (Cd) w P (Cdi) n 1 i 2 A 2 i n 1 i 1 A 1∑
∑
= = + = =1 (14)with w1+w2=1. n is selected such asP(Cd<Cd1)=0, 0
) Cd P(Cd > n = .
Illustration with Theophanatos tests. The two ranges of Kc values
selected for fitting regression curves are presented in table 2. First, the dispersion of the data obtained by different authors is measured to analyze if there is a simple relationship (polynomial of low order) between the drag coefficient and the number of Keulegan-Carpenter (Fig. 9.5 p. 131, Théophanatos, 1988). For Keulegan-Carpenter numbers between 10 and 21, the coefficient of correlation of 0.5 shows a large dispersion around the linear relationship coming from measurements and different tests procedures used by authors (Théophanatos, 1988). The coefficient of determination obtained for Keulegan-Carpenter numbers between 21 and 35 indicates a rather satisfactory linear relationship.
Table 2. Linear equations for the drag coefficient
Type of marine growth Regression Equation Y = a + bx Coefficient of correlation Artificial roughness 10< Kc<21; CD = 2,61–0.049 Kc (1) r = 0.5 21<Kc<35; CD = 1,97 + 0.016 Kc (2) r = 0.67
Elsewhere a study on correlation between the drag coefficient and the non-dimensional relative roughness (k/De) show clearly that the drag coefficient is a function of k/De (Wolfram J., Jusoh I. et Sell D., ASME 1993). The increase of the drag coefficient depends of both relative roughness and hydraulic parameters. These two parameters having uncertain evaluation due to the experimental conditions, they introduce uncertainties on the forces coefficients of Morison equation. The probabilistic approach used here to estimate drag coefficient, allow to select hypothesis when introducing these variables in reliability analysis. The results of probabilistic calculations following the different intervals of CD are given in the tables 3 – 5. All tests results are not
brought together to assess statistics of Cd knowing Kc. According to the reliability of the experimental test procedures, there is a way to advocate a weight depending of the procedure. The coefficients of accommodation (table 6) are given according to the adaptation of the test procedures to represent the mussel colonization and to well measure forces. The experimental data of Sarpkaya for a sand roughness agree reasonably well with those of Théophanatos (rough cylinder with pyramids). Those of Rodenbusch are very closed to those obtained by Théophanatos. Nath's results diverge with the results
described previously. This difference is probably due to marine growth modelling and to the procedures of forces measurement, filtering and corrections of the deep parameters (Théophanatos, 1988, pp. 130-132). According to this comment a value close to 1 is selected when the model represent very well the complexity of fooling and hydraulic conditions and when the sequences of signal treatment are robust. This method allows to introduce in the modelling all the available data.
Table 3. Probabilistic calcuations for 10 < KC < 15
10< Kc <15 Théophanatos Sarpkaya Rodenbusch Nath
P(Cd1<Cd<Cd2) 0 0 0 1
P(Cd2<Cd<Cd3) 0.12 0 0 0
P(Cd3<Cd<Cd4) 0.75 0.29 1 0
P(Cd4<Cd<Cd5) 0.12 0.71 0 0
Table 4. Probabilistic calcuations for 15 < KC < 21
15< Kc <21 Théophanatos Sarpkaya Rodenbusch Nath
P(Cd1<Cd<Cd2) 0 0 0 0.5
P(Cd2<Cd<Cd3) 0 0.6 0 0.5
P(Cd3<Cd<Cd4) 1 0.4 1 0
P(Cd4<Cd<Cd5) 0 0 0 0
Table 5. Probabilistic calcuations for 21 < KC < 35
21< Kc <35 Théophanatos Sarpkaya Rodenbusch Nath
P(Cd1<Cd<Cd2) 0 0 0 0.67
P(Cd2<Cd<Cd3) 0 0.09 1 0.33
P(Cd3<Cd<Cd4) 1 0.9 0 0
Table 6. Theoretical expertise for the drag coeffcient
Théophanatos Sarpkaya Rodenbusch Nath Coefficients of
accomodation 0.8 0.5 0.3 0.1
Weight 0.47 0.29 0.18 0.06
The conditional probability of the drag coefficient shows an asymmetrical distribution (Fig. 13).
Figure 13. Drag coefficient probability conditioned to Kc.
The discrete probability density function is deduced from this previous results and the probability of Kc being in the tree ranges (Fig.14). Ranges of Cd refers to those given in table 3~5. Cd1 =1 ; Cd2 =1.375 ; Cd3 =1.75 ; Cd4 =2.125 ; Cd5 =2.5
Paper No. 2004-JSC-344 Schoefs Page number 8 of 8 Figure 14. Drag coefficient probability.
This modelling allows to conclude that the distribution is asymmetric. Considering the followed methodology and the conditioning to Kc which follows a non-symmetrical distribution, this result is not surprising. The mean value µ and the standard deviation σ are obtained by the equations (15) and (16).
Cdi p Cd i i
∑
= = 4 1 ) ( µ (15) ² ) ) ( ( ) ( ² 4 1∑
= − = i i Cd Cdi p Cd µ σ (16)The mean value is 1.834 and the standard deviation 0.051. This values lead to a COV of only 3 %. It is of course very fair and show that CoV of 30 % generally assumed can overestimate the variation in some cases.
CONCLUSION
The modelling of marine loads on Jacket platforms in presence of marine growth remains very complex. Randomness on Reynolds and Keulegan-Carpenter numbers due to the wave stochastic field, uncertainties on hydrodynamics coefficients and experimental tests implies a work on probabilistic modelling. The response surface methodology allow to integrate in calculations hydraulics parameters and the determination of the hydrodynamics coefficients can be accessible from the experimental tests. It leads to a discrete probability density function of hydrodynamic coefficients based on a conditioning to the wave kinematics basic variables. Results show that usual hypothesis on CoV for hydrodynamic coefficients are mainly over-estimated and as a consequence make the reliability less.
REFERENCES
API (1986) “Study on wave forces on a cylinder in the fields where wave and flow coexist”, Proc. Of International Offshore Mechanics
and Arctic Symposium, Tokyo – Japan, pp. 130–135, ASME Pub.
New York.
Asao T., Takagi N., Motora S., Sakuta M, and Uekita M. (1986) “A study on wave forces on a cylinder in the fields where wave and flow coexist”, Proc. Of International Offshore Mechanics and
Arctic Symposium, Tokyo – Japan, pp. 130–135, ASME Pub. New
York.
Boukinda M. (2003). “Caractérisation mécanique des chargements hydrodynamiques dus aux bio salissures marines”, Internal Report, Université de Nantes.
Eashwar M., Subramanian G., Chandrasekaran P., Manickam S.T., Maruthamuthu S. and Balakrishnan K. (1995) “The interrelation of cathode protection and marine macro-foulind”, Bio fouling, vol 8, pp. 303-312, Harwood Academic Publishers GmbH, Singapore.
Faber M.H., Hansen P.F., Jepsen F.D. and Moller H.H. (2001) “Reliability-based management of marine fouling”, Journal of
Offshore Mechanics and Arctic Engineering, vol 123, Issue 2, pp.
76-83, Elsevier Science Ltd.
Justesen P. (1989) “Hydrodynamic forces on large cylinders in oscillatory flow”. ASCE Journal of Waterway, Portg, Coastal and Ocean Engineering. Vol. 115, N°4, July pp. 497-514.
vol. 189, pp. 149 - 154. (1950)
Kasahara Y., Koterayama W. and Shimazaki K. (1987) “Wave forces acting on rough circular cylinders at high Reynolds numbers”, OTC 5372, Houston, Texas-USA, April 27-30.
Labeyrie, J. and F. Schoefs, (1996) “Matrix Response Surfaces For Describing Environmental Loads”, vol. II Safety and Reliability,
Proc. of 15th O.M.A.E, Florence, pp. 119-126.
Morison, J.R., O'Brien M.P., Johnson J.W. and Schaff. S.A. “The forces exerted by surfaces waves on piles”, Petroleum trans. Picken G.B. (1985) "Review of marine fouling organisms in the
North Sea on offshore structures", Discussion Forum and
Exhibition on Offshore Engineering with Elastomers, June 1985,
Plastics and Rubber Inst., London , vol. 5, pp. 5.1 - 5.10.
Rodenbusch G. and Gutierrez C.A. (1983) “Forces on cylinders in two-dimensional flow”, technical report. Vol. 1, BRC 123-83, Bellaire Research Center, Houston, Texas – USA.
Sankalpa Mitra, (1991) “Marine growth on offshore structures in Indian offshore waters and removal strategy”. First International Offshore
and Polar Engineering Conference, I.S.O.P.E, P.o. Box 1107 Golden
U.S.A., pp. 143 – 147.
Sarpkaya T. (1990) “On the effect of roughness on cylinders” , Journal
of Offshore Mechanics and Artic Engineering, Transactions of the
American Society of Mechanical Engineers, Vol.112, pp.334-340. Sarpkaya T. (1976) “In-line and transverse forces on smooth and sand
roughened circular cylinders in oscillating flow at high Reynolds numbers”, Technical Report n° NPS-69SL-76062, Naval Post Graduate School, Monterey, California-USA.
Sarpkaya T. (1977) “In-line and transverse forces on cylinders on cylinders in oscillatory flow at high Reynolds numbers”, Journal of
Ship Research, Vol.21, N°4, pp.200-216.
Schoefs F. (1996) “Response Surface of wave loading for reliability of marine structures”, PhD Thesis, nov. 1996, University of Nantes. Sell D., “Marine Fouling”, Proceeding of the Marine Conservation
Symposium, Royal Soc. of Edinburg
Sharma J.N. (1983) “Marine growth on the Hondo platform in the Santa Barbara Channel”. 15 th Annual Offshore Technology Conference, vol. 2, Dallas U.S.A., pp. 469 – 474.
Theophanatos A. (1988) “Marine growth and hydrodynamic loading of offshore structures”, PhD thesis, University of Strathclyde - UK, Feb 1988.
Wolfram J., Jusoh I. et Sell D. (1993) “Uncertainty in the estimation of the fluid loading due to the effects of marine growth”, Safety and
Reliability Symposium, Proc. of 12th int. conf. on Offshore
Mechanics and Arctic Engineering, (O.M.A.E'93), Glasgow, vol. II, pp. 219-228 (ASME 1993). 0 0,1 0,2 0,3 0,4 0,5 0,6 0,7 0,8 P(Cd) (Cdi-1-Cdi)/2 1.79 1.56 1.94 2.31
View publication stats View publication stats