HAL Id: hal-02979802
https://hal.ehesp.fr/hal-02979802
Submitted on 19 Nov 2020HAL is a multi-disciplinary open access archive for the deposit and dissemination of sci-entific research documents, whether they are pub-lished or not. The documents may come from teaching and research institutions in France or abroad, or from public or private research centers.
L’archive ouverte pluridisciplinaire HAL, est destinée au dépôt et à la diffusion de documents scientifiques de niveau recherche, publiés ou non, émanant des établissements d’enseignement et de recherche français ou étrangers, des laboratoires publics ou privés.
Long-term effect of first-line injectable multiple sclerosis
treatments: input of a time-dependent propensity score
Mathilde Lefort, Yohann Foucher, Remi Lenain, Sandra Vukusic, Gilles Edan,
Emmanuelle Leray
To cite this version:
Mathilde Lefort, Yohann Foucher, Remi Lenain, Sandra Vukusic, Gilles Edan, et al.. Long-term effect of first-line injectable multiple sclerosis treatments: input of a time-dependent propensity score. Pharmacoepidemiology and Drug Safety, Wiley, 2020, 29 (12), pp.1680-1688. �10.1002/pds.5154�. �hal-02979802�
Full title: Long-term effect of first-line injectable multiple sclerosis treatments: input of
a time-dependent propensity score
Short title: Effect of first-line multiple sclerosis treatments (max 50 characters)
Authors:
Mathilde Lefort(1)(2), Yohann Foucher(3)(4), Remi Lenain(3)(5), Sandra Vukusic(6-9), Gilles Edan(2)(10), and Emmanuelle Leray(1)(2)(11)
Affiliations:
(1)
Rennes University, EHESP, REPERES – EA 7449, F-35000 Rennes, France
(2) Univ Rennes, CHU Rennes, Inserm, CIC 1414 [(Centre d’Investigation Clinique de Rennes)], F-35000
Rennes, France
(3)
INSERM UMR 1246 – SPHERE, Nantes University, Tours University, Nantes, France
(4)
Nantes University Hospital, Nantes, France
(5)
Lille University Hospital, Lille, France
(6)
Hospices Civils de Lyon, Service de Neurologie, sclérose en plaques, pathologies de la myéline et neuro-inflammation, F-69677 Bron, France
(7)
Observatoire Français de la Sclérose en Plaques, Centre de Recherche en Neurosciences de Lyon, INSERM 1028 et CNRS UMR 5292, F-69003 Lyon, France
(8)
Université de Lyon, Université Claude Bernard Lyon 1, F-69000 Lyon, France
(9)
Eugène Devic EDMUS Foundation against multiple sclerosis, state-approved foundation, F-69677 Bron, France
(10)
Department of Neurology, CHU Pontchaillou, Rennes, France
(11)
METIS Department, EHESP French school of public health, Rennes, France
Corresponding author:
Mathilde Lefort
Address: Métis department, École des hautes études en santé publique, Avenue du Professeur-Léon-Bernard, CS 74312, 35043 Rennes Cedex, France
Email address: mathilde.lefort@ehesp.fr
Accepted
2 Abstract (250 words)
Purpose: The long-term effect of beta-interferon and glatiramer acetate on multiple sclerosis (MS)
disability progression has resulted in controversial results, probably due to a lack of appropriate control of biases as raised in observational studies. In particular, the time of the therapeutic decision is difficult to define when the controls are not treated.
Methods:This retrospective observational study was based on a series of patients from the MS expert center
in Rennes, France. We used a time-dependent propensity score defined as the linear predictor of a Cox model estimating the hazard of being treated at each time from MS onset. The matching procedure resulted in two groups: patients matched as treated and as not yet treated. The restricted mean times (RMST) to reach a moderate level of disability or worsening of the disability were compared between the two groups in an intention-to-treat analysis.
Results: Of the 2,383 patients included in the study, 556 were matched as treated. The matching procedure
provided a good balance of both the time-fixed and the time-dependent covariates. A slight difference was observed for the time to reach a moderate level of disability, in favor of the “not yet treated” group (difference in the RMST: -0.62 [-0.91; -0.33]) while no difference was found in terms of worsening of the disability (-0.03 [-0.24; 0.33]).
Conclusion: This unexpected result is probably due to unmeasured confounders. However, this
time-dependent PS warrants consideration in long-term effectiveness studies.
Keywords: Multiple sclerosis, disability progression, effectiveness, observational study, propensity score Key points
No benefit of interferon-β and glatiramer acetate on disability progression in multiple sclerosis were showed in this study
The time of the therapeutic decision, i.e. the baseline in comparative effectiveness study, is hard to identify when the controls are untreated.
Time-fixed propensity scores are often used while confounders are time-dependent.
The time-dependent propensity score is a useful tool that warrants consideration in treatment effectiveness studies in a chronic disease context.
Word count: 3272/3000
Prior postings and presentations:
Oral communications
Accepted
3 Lefort M, Edan G, Leray E. Propensity score methods: The study of the effect of β-interferon and glatiramer acetate on multiple sclerosis disability. The 34th
International Conference on Pharmacoepidemiology & Therapeutic Risk Management (ICPE). Oral presentation. Prague, Czech Republic, August 22-26, 2018.
Lefort M, Foucher Y, Lenain R, Vukusic S, Edan G, Leray E. Long-term effect of interferon-β and glatiramer acetate in real-world settings use on disability progression: input of time-dependent propensity score. The 35th International Conference on Pharmacoepidemiology & Therapeutic Risk Management (ICPE). Oral presentation. Philadelphia, Pennsylvania, United States of America, August 24-28, 2019.
Lefort M, Foucher Y, Lenain R, Vukusic S, Edan G, Leray E. Long-term effect of first-line injectable multiple sclerosis treatment using time-dependent propensity score matching. The 41st Annual Conference of the international society for clinical biostatistics (ISCB). Oral presentation. Kraków 2020, Poland, August 23-27, 2020 (Virtual congress).
Poster
Lefort M, Foucher Y, Vukusic S, Edan G, Leray E. Long-term effect of interferon-β and glatiramer acetate in real-world settings on disability progression: input of time-dependent propensity score. The 26th annual meeting of the European Charcot Foundation. Poster. Baveno, Italy, November 15-17, 2018.
Abbreviation:
MS: multiple sclerosis
RRMS: relapsing-remitting multiple sclerosis β-IFN: beta-interferon
EDMUS: European database for multiple sclerosis EDSS: expanded disability status scale
GA: glatiramer acetate ITT: intention to treat
PS: propensity score
RMST: restricted mean survival time SD: standard deviation
SMD: standardized mean differences
Accepted
4
Main text
Introduction
Comparative effectiveness research allows treatments in real-life conditions to be studied when randomized clinical trials are lacking or not feasible. It needs to take into account specific issues related to the control of bias. Treatment options for multiple sclerosis (MS) have become more diverse and more complex over the past twenty years. This context necessitates up-to-date and rigorous assessment of the effectiveness of such treatments.
MS is a chronic disease that affects the central nervous system. This lifelong disease often starts in early adulthood, and it affects more women than men1. Relapsing-remitting MS (RRMS), characterized by the occurrence of relapses2, is the most common phenotype. In the long run, the symptoms accumulate and lead to irreversible disability. Thus, most patients ultimately convert to secondary progressive MS.
The first available MS disease-modifying agents, beta-interferon (β-IFN) and glatiramer acetate (GA), were approved in France in November 1995 and January 2002, respectively3,4. They are safe and they are still often prescribed. Their efficacy compared to placebo in the short- and medium-term, especially in terms of reducing relapses, has been shown in randomized clinical trials as well as by observational studies5,6. Nevertheless, their long-term effects remain less clear.
The studies comparing treated versus treatment-naive patients have mostly demonstrated a beneficial effect of β-IFN and GA, as concluded in a recent meta-analysis7
. Very different results, however, have been obtained with hazard ratios for the time to having a need for a walking aid ranging from 0.14 to 1.30. In observational studies, results can be skewed by several biases8, in particular, indication bias, resulting in non-comparable characteristics of the treated versus the control patients. The methods to control for bias have evolved over the past several decades. In particular, propensity scores (PS) are a commonly used solution to control for indication bias, aiming to mimic a randomized clinical trial 9. Nevertheless, the time of the therapeutic decision is difficult to define when the controls are not treated. It relates to the theoretical and unobserved time at which an untreated patient would have been treated. Consequently, previous studies focusing on the β-IFN and GA effects on MS disability progression may have suffered from the time-dependent confounding.
The use of a time-dependent PS may solve these issues10, as it enables control patients to be identified who are comparable to the treated patients when the latter start treatment. In the present study, we propose to assess the effectiveness of β-IFN and GA in MS using a matching method originally devised by Lu11.
Accepted
5
Materials & Methods
Study population
This retrospective study was based on a series of patients from the MS expert center in Rennes, France12. Patients who are monitored by private neurologists can schedule consultations at expert centers, when needed. In Rennes, data have been systematically compiled since 1976 in the European Database for Multiple Sclerosis (EDMUS) software13. This information is updated at each consultation14, and in May 2017, it comprised data for a total of 5,150 patients. Information on the treatments and relapses are collected at each consultation. The frequency of a consultation is patient dependent. MS-related disability is measured using the Expanded Disability Status Scale (EDSS), which ranges from 0 (normal) to 10 (death due to MS)15. All of the enrolled patients provided informed consent for participation and for their data to be stored and used for research. Data confidentiality and safety were ensured according to the recommendations of the French “Commission Nationale Informatique et Libertés” (CNIL).
All of the patients with MS according to the Poser16 or the McDonald17 criteria; a relapsing MS onset before December 31st 2005; and who were treatment-naive before 30 November 1995 (the date when β-IFN was approved in France), did not reach an irreversible EDSS score of 3, and did not convert into secondary progressive MS before November 30th 1995, were included in the present study.
Exposure
Over the study period, four preparations of β-IFN were available: interferon beta-1b (Betaseron®, 250 µg), interferon beta-1a (Avonex®, 30 µg and Rebif®, 22 µg and 44 µg) and one preparation of GA (Copaxone®, 20 mg). As all these preparations have similar indications and presumed equivalent effectiveness, all patients that were exposed for at least one day were considered in a single group18–20.
Outcomes
Three outcomes were defined as follows: (1) the time from matching to reaching an irreversible EDSS score of 3, which corresponds to moderate disability15, (2) the time from matching to the first worsening of the EDSS, and (3) the number of relapses within 5 and 10 years following matching.
An EDSS score was considered to be irreversible when it persisted for at least 6 months, and until the last consultation. A relapse was defined as the occurrence of new symptoms or the worsening of symptoms that had occurredpreviously, for at least 24 hours. Worsening of the EDSS was defined as an increase by 1½ points when the initial EDSS score was 0, by 1 point when the initial score was comprised between 1 and 5½, or ½ a point if the initial score was more than 5½.
Accepted
6
Time-dependent propensity score
We used the method initially proposed by Lu11. This method consisted of matching treated patients with untreated patients who had the same chance of being treated at the same time. This procedure is divided into two steps. The first step consisted of modeling the time from the disease onset to the first prescription of β-IFN or GA using a cause-specific updated Cox regression. The times were right-censored at the earliest of the four following events: initiation of a treatment other than β-IFN or GA, conversion to secondary progressive MS, assignment of an irreversible EDSS score of 3, or the last visit entered in the database at the extraction date. The dependent PS was defined as the linear predictor of this Cox model with time-dependent covariates.
As recommended21, this model was adjusted for variables associated with the outcome. Thus, a PS model was specified for each of the three outcomes. The following variables were considered: sex, age, the year of MS clinical onset, the number of relapses in the past 12 months, the EDSS score, the EDSS variation since the last consultation, and the delay since the first consultation at the MS expert center. The number of relapses in the past 12 months, the EDSS score, the EDSS variation, and the delay since the first consultation were time-dependent covariates. The number of relapses was divided into 5 modalities: zero, one, two, three, and more than three. The EDSS score was categorized as: ≤ 1, 2-3, and ≥ 4. The EDSS variation was categorized as: (1) improvement if there was a decrease by 1 point when the initial EDSS was < 5.5, or 0.5 a point when the initial score was ≥ 5.5; (2) worsening when there was an increase by 1 point if the initial EDSS was < 5.5, or 0.5 a point when the initial score was ≥ 5.5, and (3) stable in all other cases. The delay since the first consultation at the MS expert center was categorized into 3 modalities: (1) none, if no consultation, (2) recent, if the delay from the first consultation was less than 3 years, and (3) old, if it was more than 3 years.
Matching procedure
The second step of the procedure consisted of matching treated patients at the time of treatment start with untreated patients who had a comparable PS value at that time. According to the positivity assumption, all of the patients should have a not-null probability of being treated in order to be matched. Thus, only time points after both MS clinical onset and treatment availability in France (i.e., 30 November 1995) were considered. As patients from the untreated group can initiate treatment later in the disease course, this group is referred to as the “not yet treated” group. Nearest neighbor matching at random, with a caliper of 0.2 of the standard deviation without replacement, was used22. If a treated patient was matched as “not yet treated” at a time before his own treatment initiation, he was excluded from the set of treated patients and could not be matched as treated later. To check the balance in the matched cohort, standardized mean differences (SMD) were computed, with 10% being considered as an acceptable difference23. Regarding the
time-Accepted
7
dependent variables, SMD were calculated using the value at matched time for “not yet treated” and “treated” patients.
Baseline was the time of matching, i.e. the decision of treatment start for patients matched as treated and the corresponding time for patients matched as “not yet treated”.
Main analyses from the matched cohort
The median follow-up duration from matching was estimated using the reverse Kaplan-Meier method24. The distributions of time-to-events were estimated using the Kaplan-Meier estimator. The area under this survival curve up to 10 years represented the restricted mean survival time (RMST)25. This interval of 10 years was determined according to the follow-up duration available in the dataset. Moreover, the numbers of relapses within 5- and 10-years following matching were analyzed using a negative binomial regression, with the log-transformed observation time as offset.
After matching, an intention to treat (ITT) analysis was performed (all the subjects remained in their treatment group regardless of any post-matching events such as treatment modification). Moreover, bootstrapping (1,000 samples) was used to obtain the confidence intervals and to handle the randomness of the matching (i.e. each random matching that led to a different matched sample). The analyses were performed using R software (R 3.4.0).
Results
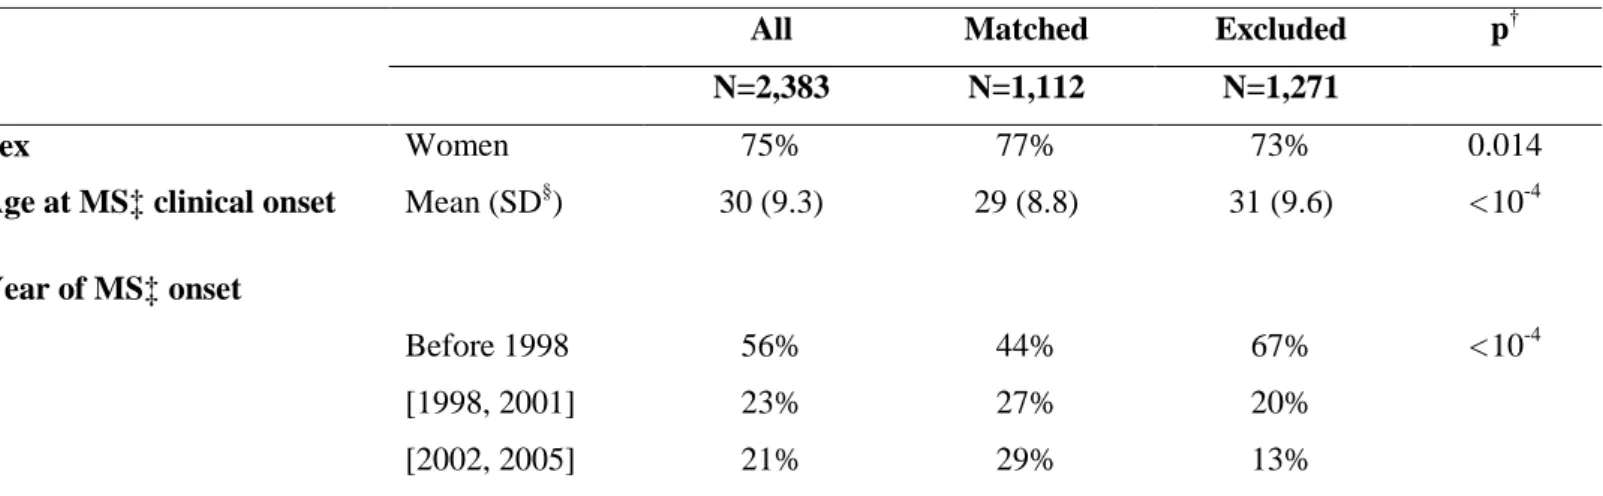
A total of 2,383 patients were included in the present study (Figure 1), of whom 933 were treated with β-IFN or GA. Overall, the matching procedure led to the exclusion of 1,271 patients, although the matched population (including 556 of the 933 treated patients) approached the distribution of the initial cohort in terms of sex, age, and the period of MS clinical onset (Table 1).
Figure 1 here Table 1 here
Characteristics of the matched dataset
As shown by the standardized mean differences in Table 2, the matching procedure resulted in a good balance of both the time-fixed and the time-dependent covariates. The mean age at matching was 34 ± 9.9 years, and 77% were women. The median follow-up duration was 9.5 years (95% CI from 9.1 to 10.0). It was 9.3 years (95% CI from 8.6 to 10.0) and 9.8 years (95% CI from 9.2 to 10.5) for the β-IFN/GA-treated patients and the “not yet treated” patients, respectively.
Table 2 here
Accepted
8
Accepted
9
Comparisons of the outcomes
The survival curves for the probabilities of not reaching an irreversible EDSS 3 and of not having a worsening of the EDSS are presented in Figures 2A and 2B. As summarized in Table 3, no difference was found for worsening of the disability, and a slight difference was observed for the time to reach EDSS 3, albeit in favor of the “not yet treated” group.
Analysis of the number of relapses indicated that the incident rate ratio was 1.23 [1.07; 1.40] over 5 years and 1.16 [1.01; 1.32] over 10 years, in favor of the “not yet treated” group.
Figure 2 here
Therapeutic sequences in the two groups
In the treated group, β-IFN/GA was initiated after a median time of 3.4 years (interquartile range: 1.2 - 7.9) after MS clinical onset, and its median duration was 2.0 years (interquartile range: 1.0 – 4.6). The reason for stopping treatment (known for 364 of the patients) was inefficacy for 36% and intolerance for 37%. As shown in Figure 3A, after the initial exposure to β-IFN or GA, 22% of the patients in the treated
group switched to another first-line treatment and 12% switched to a second- or third-line treatment.
Of the 556 patients from the “not yet treated” group, 259 were treated with β-IFN/GA later in the disease course. The β-IFN/GA-treatment-free survival is presented in Figure S1. The cumulative probability of being treated was 18% (95% CI from 15% to 22%) at one year and 47% (95% CI from 42% to 51%) at 5 years. The RMST over 10 years showed that treatment was delayed by 5.7 years (95% CI from 5.3 to 6.1) for the “not yet treated” patients. Moreover, patients from the “not yet treated” group could have received other treatments, as shown in Figure 3B.
Figure 3 here
Accepted
10
Discussion
In this study, we investigated how to assess long-term treatment effectiveness in real-life settings. As discussed previously8,10, this issue entails considerable challenges, such as the choice of the appropriate control group. The novelty of the present study was the application of a time-dependent PS to compare patients with MS who had received β-IFN or GA treatment to patients who had not yet initiated treatment but who had the same probability of being treated at that time.
The use of a time-fixed PS (i.e., classical PS) to compare treated patients to never treated ones would have been an intuitive and well-known methodology. But, on the one hand, patients who were never treated are probably patients who did not need treatment due to a benign course. On the other hand, patients who were never treated could be patients who had no chance of being treated, either because treatment was not available (such as patients from a historical control cohort) or because they were not eligible for treatment (such as secondary progressive MS patients). In addition, a time-fixed PS needs to identify the therapeutic decision time, which is difficult to define for untreated patients. Thus, the choice of the baseline date is often questionable and may lead to biased results. Indeed, the time-points for patient inclusion differed between the studies, and they did not correspond to the therapeutic decision. For instance, inclusion could be at MS onset26,27 or at the first consultation at the MS expert center28. In our opinion, patient characteristics could have changed between these baseline dates and the time of therapeutic decision. The response to treatment could have been impacted by events such as relapses or disability worsening before treatment initiation. These two issues, being the control group and baseline, led us to explore the interest of a time-dependent PS. The time-dependent PS implies that patients can be matched as untreated although they could be treated later in the disease course (here, 259 patients), leading to a control group being referred to as “not yet treated”. Thus, this methodology offers a design where the controls are patients with a delayed treatment. This appears to be suitable in many research contexts and corresponds better to the care management of chronic diseases in the real-life, especially when treatments are largely prescribed over time.
When applied to MS, this method yielded results that were in accordance with previous studies28,29 but that were nonetheless unexpected. Indeed, the previously mentioned meta-analysis7 pooled data from 10 observational studies and 4 long-term extensions of randomized clinical trials and showed a beneficial effect of β-IFN or GA, with a hazard ratio of 0.56 (95% CI from 0.46 to 0.68) for the time to reach irreversible EDSS 4. However, it was based on different designs and methods that are subject to varying degrees to potential biases8, especially indication bias.
For instance, in the first publication published in 2007, the patients were included at different time points according to their treatment status, since the treated patients were included at treatment initiation while the control patients were included at the first consultation at the MS expert center30. This difference
Accepted
11
could have biased the results and favored the treatment since events that occurred from the first consultation to treatment initiation were excluded from the analysis only for the treated group, leading to immortal time bias8,29. When an attempt at correction was carried out29, the conclusion changed, with a new HR estimate of 2.02 instead of 0.73.
In addition, the timing when potential confounders are assessed is important. Several situations have been observed in the literature: assessment at different times30, not necessary at baseline, and sometimes after the treatment start. Such practices have been shown to lead to misspecification in the PS model31. Moreover, randomized clinical trials do not include parameters measured after baseline as covariates.
The study period may have also impacted the results. For instance, a Canadian study28 used a contemporary control cohort (July 1995 – December 2004) and a historical control cohort (April 1985 – June 1995) and provided inconsistent results. Use of a historical control cohort implies that the comparison was performed between two different periods, as the treated patients were compared to the patients followed-up before treatment availability and who were hence, by definition, not treated. This type of design could lead to biased results32,33 due to changes over time, for instance in diagnostic criteria, disease progression, standard of care practices, or the quality of the data collection34. In the present study, the inclusion period was 1996-2006 and hence corresponded to outdated therapeutic practices of French neurologists. Indeed, the patients were treated after a mean MS duration of 5 years, while the current recommendations are to treat as soon as possible after MS onset35. This long delay could also be related to the fact that the first symptoms of MS do not always lead to a consultation with a neurologist, and a delayed diagnosis typically results in delayed access to MS-specific care. The number of therapeutic options has increased in recent years and most of the new drugs have been shown by randomized clinical trials to exhibit comparable or higher efficacies than β-IFN/GA. In addition, when the first treatment was made available in 1996, an assumption that more severe patients were treated at the time compared to later or current practices could be made.To reduce the potential bias linked to changes over the study period, the year of MS onset was considered in the PS.
In our opinion, our study suffered from unmeasured confounding. We were not able to balance groups based on MRI data due to a high rate of missing values, as MRI was not systematically done or collected over the study period. The E-value associated with the analysis of the time to reach EDSS 3 suggests that the minimum strength of association, regarding the risk that an unmeasured confounder could fully explain the treatment-outcome association would be 2.336. This value seems compatible with our assumption since the MRI is now known as a central prognostic factor, and the measures of association with the time to reach EDSS 3 ranged from 1.2 [0.5 -2.9] to 4.4 [2.4 – 8.0], according to the number of lesions (1-3 to ≥10) in the Barcelona cohort37. This limitation is not related to the PS method and would have affected the results no matter which methods were used. Moreover, due to its monocentric design, the size of our study cohort was small, and exclusions due to matching contributed to its reduction. Our study probably also
Accepted
12
suffers from a lack of power. Therefore, only an significant effect of treatment on the disability worsening could have been shown with this sample size. In addition, due to the MS expert center recruitment, our study is not population-based and may lack full representation34,35. Lastly, the present study did not require any specific rhythm in the follow-ups and used the visits as data collected. The frequency of these visits differed from one patient to another.
However, we do think that this innovative methodology based on time-dependent PS warrants consideration in long-term effectiveness studies. These kinds of applicative studies contribute to the knowledge of such methods based on matching with time-dependent treatments, which induces many questions10. It would be interesting to see it applied to additional datasets or other chronic disease registries, particularly with regular follow-up data from differing contexts to better appreciate its strengths and potential limitations.
Accepted
13
Acknowledgments
The authors wish to thank Damien Le Port (Rennes Hospital, France) for the data collection and the quality control, Prof Emmanuel Oger for his comments on the manuscript, and the “Observatoire Français de la Sclérose en Plaques” (OFSEP), which is supported by a grant provided by the French government and administered by the "Agence Nationale de la Recherche," within the framework of the "Investments for the Future" program, as reference ANR-10-COHO-002, by the Eugène Devic EDMUS Foundation against multiple sclerosis and by the ARSEP Foundation.
Funding
This work was part of Mathilde Lefort’s Ph.D., which is funded through an unconditional donation from Roche SAS, without any link to the scientific contents of the work.
Conflict of Interest Statement
M. Lefort reports travel grants from Roche SAS.
Y. Foucher reports speaking honoraria from Biogen and Sanofi R. Lenain has nothing to disclose
S. Vukusic reports consulting and lecturing fees, travel grants, and unconditional research support from Biogen, Celgène, Geneuro, Genzyme, MedDay, Merck Serono, Novartis, Roche, Sanofi Aventis, and Teva Pharma
G. Edan reports personal honoraria for lectures or consulting from Bayer, Biogen, LFB, Merck, Novartis, Roche, Sanofi. Research support from Bayer, Biogen, Genzyme, Merck, Novartis, Roche and Teva Pharma E. Leray reports consulting and lecture fees or travel grants from Biogen, Genzyme, MedDay Pharmaceuticals, Merck Serono Novartis, and Roche
Accepted
14
References
1. Filippi M, Or AB-, Piehl F, et al. Multiple sclerosis. Nat Rev 2018; 4: 1–27.
2. Lublin FD, Reingold SC, Cohen JA, et al. Defining the clinical course of multiple sclerosis The 2013 revisions. 2014.
3. HAS. BETAFERON 250 - Transparency committee. 2010. 4. HAS. Copaxone - Avis de la commission. 2002.
5. Jacobs L, Beck R, Simon J, et al. Intramuscular interferon Beta-1atherapy initiated during a first demyelinating event in multiple sclerosis. J Med 2000; 343: 898–904.
6. Comi G, Filippi M, Barkhof F, et al. Effect of early interferon treatment on conversion to definite multiple sclerosis: A randomised study. Lancet 2001; 357: 1576–1582. doi:10.1016/S0140-6736(00)04725-5.
7. Signori A, Gallo F, Bovis F, Di Tullio N, Maietta I, Sormani MP. Long-term impact of interferon or Glatiramer acetate in multiple sclerosis: A systematic review and meta-analysis. Mult Scler Relat
Disord 2016; 6: 57–63. doi:10.1016/j.msard.2016.01.007.
8. Sormani MP, Bruzzi P. Can we measure long-term treatment effects in multiple sclerosis? Nat Rev
Neurol 2014; 11: 176–182. doi:10.1038/nrneurol.2014.237.
9. Austin PC. A tutorial and case study in propensity score analysis: An application to estimating the effect of in-hospital smoking cessation counseling on mortality. Multivariate Behav Res 2011; 46: 119–151. doi:10.1080/00273171.2011.540480.
10. Thomas LE, Yang S, Wojdyla D, Schaubel DE. Matching with time-dependent treatments: A review and look forward. Stat Med 2020; 39: 2350–2370. doi:10.1002/sim.8533.
11. Lu B. Propensity score matching with time-dependent covariates. Biometrics 2005; 61: 721–728. doi:10.1111/j.1541-0420.2005.00356.x.
12. Leray E, Yaouanq J, Le Page E, et al. Evidence for a two-stage disability progression in multiple sclerosis. Brain 2010; 133: 1900–1913. doi:10.1093/brain/awq076.
13. Confavreux C, Compston DAS, Hommes R, McDonald WI, Thompson AJ. EDMUS, a European database for multiple sclerosis. J Neurol Neurosurg Psychiatry 1992; 55: 671–676.
14. Vukusic S, Casey R, Rollot F, et al. Observatoire Français de la Sclérose en Plaques (OFSEP): A unique multimodal nationwide MS registry in France. Mult Scler J 2018: 1–5.
doi:10.1177/1352458518815602.
15. Kurtzke JF. Rating neurologic impairment in multiple sclerosis: an expanded disability status scale (EDSS). Neurology 1983; 33: 1444–1452. doi:10.1212/WNL.33.11.1444.
16. Poser CM, Paty DW, Scheinberg L, et al. New Diagnostic Criteria for Multiple Sclerosis : Guidelines for Research Protocols. Ann Neurol 1983; 13: 227–231.
17. Mcdonald WI, Compston A, Edan G, et al. Recommended Diagnostic Criteria for Multiple Sclerosis : Guidelines from the International Panel on the Diagnosis of Multiple Sclerosis. Ann Neurol 2001: 121–127.
18. Wingerchuk DM, Weinshenker BG. Disease modifying therapies for relapsing multiple sclerosis.
Accepted
15
BMJ 2016; 354. doi:10.1136/bmj.i3518.
19. La Mantia L, Di Pietrantonj C, Rovaris M, et al. Interferons-beta versus glatiramer acetate for relapsing-remitting multiple sclerosis. Cochrane Database Syst Rev 2016; 2016.
doi:10.1002/14651858.CD009333.pub3.
20. Healy BC, Glanz BI, Zurawski JD, Mazzola M, Chitnis T, Weiner HL. Long-term follow-up for multiple sclerosis patients initially treated with interferon-beta and glatiramer acetate. J Neurol Sci 2018; 394: 127–131. doi:10.1016/j.jns.2018.09.020.
21. Brookhart M alan, Schneeweiss S, Rothman KJ, Glynn RJ, Avorn J, Stürmer T. Variable selection for propensity score models. Am J Epidemiol 2006; 163: 1149–1156. doi:10.1093/aje/kwj149.
22. Austin PC. A comparison of 12 algorithms for matching on the propensity score. Stat Med 2014; 33: 1057–1069. doi:10.1002/sim.6004.
23. Austin PC, Stuart E a. Moving towards best practice when using inverse probability of treatment weighting (IPTW) using the propensity score to estimate causal treatment effects in observational studies. Stat Med 2015; 34: 3661–3679. doi:10.1002/sim.6607.
24. Shuster JJ. Median follow-up in clinical trials. J Clin Oncol 1991; 9: 191–2. doi:10.1200/JCO.1991.9.1.191.
25. Royston P, Parmar MKB. Restricted mean survival time: An alternative to the hazard ratio for the design and analysis of randomized trials with a time-to-event outcome. BMC Med Res Methodol 2013; 13. doi:10.1186/1471-2288-13-152.
26. Cocco E, Sardu C, Spinicci G, et al. Influence of treatments in multiple sclerosis disability: A cohort study. Mult Scler J 2015; 21: 433–441. doi:10.1177/1352458514546788.
27. Drulovic J, Kostic J, Mesaros S, et al. Interferon-beta and disability progression in relapsing-remitting multiple sclerosis. Clin Neurol Neurosurg 2013; 115: S65–S69. doi:10.1016/j.clineuro.2013.09.024. 28. Shirani A, Zhao Y, Karim ME, et al. Association between Use of Interferon Beta and Progression of
Disability in Patients. Jama 2012; 308: 247–256.
29. Renoux C, Suissa S. Immortal time bias in the study of effectiveness of interferon-β in multiple sclerosis. Ann Neurol 2008; 64: 109–110. doi:10.1002/ana.21352.
30. Trojano M, Pellegrini F, Fuiani A, et al. New natural history of interferon-??-treated relapsing multiple sclerosis. Ann Neurol 2007; 61: 300–306. doi:10.1002/ana.21102.
31. Austin PC. An introduction to propensity score methods for reducing the effects of confounding in observational studies. Multivariate Behav Res 2011; 46: 399–424.
doi:10.1080/00273171.2011.568786.
32. Papageorgiou SN, Koretsi V, Jäger A. Bias from historical control groups used in orthodontic research: A metaepidemiological study. Eur J Orthod 2017; 39: 98–105. doi:10.1093/ejo/cjw035. 33. Spencer E, Brassey J, Heneghan C. Non-contemporaneous control bias. Cat Bias 2017. Available at:
https://catalogofbias.org/biases/non-contemporaneous-control-bias/.
34. Walton MK. Historical Controls for Clinical Trials Contemplation on Use in Drug Development.
Present FDA 2012: 1–30. Available at: https://events-support.com/Documents/Walton_Marc.pdf.
35. Tintoré M. Rationale for early intervention with immunomodulatory treatments. J Neurol 2008; 255: 37–43. doi:10.1007/s00415-008-1006-4.
Accepted
16
36. Van Der Weele TJ, Ding P. Sensitivity analysis in observational research: Introducing the E-Value.
Ann Intern Med 2017; 167: 268–274. doi:10.7326/M16-2607.
37. Tintore M, Rovira À, Río J, et al. Defining high, medium and low impact prognostic factors for developing multiple sclerosis. Brain 2015; 138: 1863–1874. doi:10.1093/brain/awv105.
38. Mckay KA, Tremlett H, Zhu F, Kastrukoff L, Marrie RA, Kingwell E. A population-based study comparing multiple sclerosis clinic users and non-users in British Columbia, Canada. Eur J Neurol 2016; 23: 1093–1100. doi:10.1111/ene.12990.
39. Debouverie M, Laforest L, Van Ganse E, et al. Earlier disability of the patients followed in Multiple Sclerosis centers compared to outpatients. Mult Scler 2009; 15: 251–257.
doi:10.1177/1352458508097919.
Accepted
17
Tables
Table 1: The characteristics of the study population (N=2,383) and comparison of the matched and the excluded patients at disease clinical onset, according to the main outcome (EDSS 3)
†
p-value of Fisher’s test or Student’s t-test comparing the matched and the excluded patients ‡Multiple sclerosis
§
Standard deviation
All Matched Excluded p†
N=2,383 N=1,112 N=1,271
Sex Women 75% 77% 73% 0.014
Age at MS‡ clinical onset Mean (SD§) 30 (9.3) 29 (8.8) 31 (9.6) < 10-4
Year of MS‡ onset Before 1998 56% 44% 67% < 10-4 [1998, 2001] 23% 27% 20% [2002, 2005] 21% 29% 13%
Accepted
Article
18 Table 2: The baseline (= matching) characteristics of the matched cohort (N=1,112) for studying the time to reach EDSS 3, overall and according to the exposure group
†
SMD: standardized mean differences between the treated and the “not yet treated” patients
All Treated Not yet treated SMD†
N=1,112 N=556 N=556
Age at matching Mean (SD‡) 34 (9.9) 34 (9.7) 35 (10.1) 4.3%
Relapses in the past 12 months 7.6%
0 27% 27% 27% 1 43% 42% 44% 2 22% 21% 22% 3 6% 6% 6% More than 3 2% 3% 2% EDSS score 6.3% [0,1] 42% 43% 41% [2,3] 42% 42% 43% 4 and more 15% 15% 16%
EDSS variation since the last consultation 2.3%
Improvement 7% 8% 7%
Stable 81% 80% 82%
Worsening 11% 12% 11%
Delay since first consultation at the expert center 2.5% None 46% 46% 45% Recent 33% 33% 33% Old 21% 21% 22%
Accepted
Article
19
‡
SD: Standard deviation
Table 3: The mean time before reaching outcomes in the two exposure groups, over a 10-year period
†
EDSS: Expanded Disability Status Scale ‡RMST: restricted mean survival time
Mean 95% CI
EDSS† 3
RMST‡ for treated 8.82 [8.59; 9.05]
RMST‡ for “not yet treated” 9.44 [9.26; 9.59]
Difference -0.62 [-0.91; -0.33]
Disability progression
RMST‡ for treated 9.12 [8.90 ; 9.32]
RMST‡ for “not yet treated” 9.09 [8.88; 9.30]
Difference 0.03 [-0.24; 0.33]
Accepted
Accepted
Accepted
Accepted
20
Figure legends
Figure 1: Flowchart of the study population (n=2,383)
Figure 2: Kaplan-Meier estimates of the time to reach A: an irreversible EDSS score of 3 and B: the first worsening of the EDSS
Legend:
A: Time before reaching an irreversible EDSS score of 3; B: Time before the first worsening of the EDSS;
Notes:
For all of the subfigures, the black line represents the survival curve for the treated patients; the grey dotted line represents the survival curve for the “not yet treated” patients. The number of at risk patients is indicated in black for the treated and grey for the “not yet treated” patients. The number of newly treated patients in the “not yet treated” group is indicated for informational purposes, but the analysis was performed using an intention-to-treat frameworks.
Figure 3: The characteristics of exposure after matching for the treated patients and the “not yet treated” patients
Legend:
A: The characteristics of exposure for the treated patients after matching;
B: The characteristics of exposure for the “not yet treated” patients after matching
The first-line treatment group included beta-interferon, glatiramer acetate, dimethyl fumarate, teriflunomide, and peg-interferon; The second- and third-line treatment groups included mitoxantrone, natalizumab, and fingolimod; Off-label treatments included azathioprine, cladribine, cyclophosphamide, and methotrexate.