TIME-DOMAIN NUMERICAL MODEL OF SUBSTATION CONDUCTOR SPAN SUBJECTED TO SHORT-CIRCUIT LOADING
Mathieu Boudou1, Sébastien Langlois1, Kahina Sad Saoud1, Christine Yang2
1Université de Sherbrooke - Canada 2RTE - France
Introduction
Short-circuit faults in electrical power networks result in substantial electromagnetic forces on conductor cables as well as supporting structures. These dynamic forces often have a leading impact on the mechanical response of such elements, particularly in the case of short spans commonly encountered in substation structures. In this regard, most of the available design tools, such as international standard IEC 60865 [1], provide simplified equations to estimate the maximum forces induced during a short-circuit event. Besides the fact that such methods may be either too conservative or completely unsafe, the computed forces are imparted to the support structures as equivalent static loadings with safety margins [2], thus incurring unnecessarily prohibitive costs. Accounting for the dynamic effects in substation structures has shown to be essential for accurate and optimal designs [3]. However, ideal numerical modeling is usually time-consuming and requires large computational resources.
In the present paper, a time-domain finite element model devoted to the dynamic analysis of conductors and support structures is presented for short flexible substation spans. The numerical model, developed using the open source software Code_Aster, employs one-dimensional elements accounting for large displacements to model a study case subjected to two consecutive short-circuit conditions. Three levels of modeling are analyzed and the resulting efforts in the structure are compared with analogous full-scale experimental results. Further parametric analysis is carried out numerically with a view to studying the effect of the short-circuits most influential parameters.
PROBLEM STATEMENT AND NUMERICAL MODELING
Let us consider the substation structure composed of a three-phase bus system supported at both ends by an A-frame gantry. Each phase conductor consists of a single ASTER 1144 conductor cable spanning over 40 m. The two A-frame gantries are typical steel structures employed for a 63 kV operating voltage, each composed of two pairs of IPE 220 profile legs connected together by means of a lattice girder consisting of two parallel UAP 150 sections assembled using L30x30x3 angle members at both the top and bottom sides, as illustrated in Figure 1.
The equivalent material properties for each component of the considered linear elastic structure are summarized in TABLE 1, with E being the Young’s modulus, ν the Poisson’s ratio, ρ the mass density and α the isotropic thermal expansion coefficient.
E (MPa) ν ρ (kg/m3) α
ASTER 1144 cables 5.25x10⁴ 0.3 2866.6 2.3x10⁻⁵
Steel elements 2.1x10⁵ 0.3 7850 1.17x10⁻⁵
Figure 1. Schematic representation of the studied substation structure
The problem is modeled using the finite element package Code_Aster. In this representation, one uses CABLE elements (flexible wires accounting for large displacements and rotations) to simulate the non-linear behavior of the conductors, and a Timoshenko beam model considering large displacements and rotations for the support structures. The model mesh is performed using a sufficient number of fully integrated first-order (linear) elements to define an accurate model. Three levels of modeling are addressed in this paper so as to set a model providing realistic results at lower costs. The major differences between these models are explained subsequently.
Model A
The whole structure is represented in a detailed manner in this model (see Figure 1). As mentioned above, the conductors are modeled using CABLE elements, whereas the support structures are represented with a Timoshenko beam model. Rigid links are employed to connect the center of gravity of each angle member to the mid-axis of the UAP channels, in order to cover all connection eccentricities in the handled structure. The main legs of the A-frame gantries are fixed at their free ends.
Model B
This modeling is identical to the previous one except for the lattice girders attaching the conductors which are modeled here as equivalent beams. The conductors are again represented with CABLE elements and the Timoshenko beam model employed previously is also used to mesh the support structures. The four main legs of each A-frame structure are clamped at their ends.
Model C
Only the conductors are considered in this last model. Such a simplification considerably reduces the size of the problem and thereby the computational time. The mesh pattern for the conductors is similar to the one of the previous two models. As for the boundary conditions, both ends of the three cables are fixed.
In the sequel, the numerical study is conducted in two key steps, for all the treated levels of modeling. On the one hand, a non-linear static analysis, where the substation structure is only subjected to a vertical loading due to its self-weight, is first performed in such a way as to install the conductors as
gantry 2 gantry 1 phase 3 2 1 leg 1 leg 2 leg 3 leg 4 IPE 220 IPE 120
catenaries. This initial sag-tension setting is achieved by applying a temperature variation leading to a sag-to-span ratio of 3.3 %. On the other hand, a non-linear transient dynamic analysis is carried out so as to analyze the response of the substation structure when subjected to two consecutive fault currents. The following governing system of equations for the whole substation structure is derived under Code_Aster using a standard updated Lagrangian formulation:
Mx Cx Kx f (1) wherein M, C and K stand for the global mass, damping and stiffness matrices, respectively. x is the global nodal displacement vector, x and x represent its first and second time derivatives, respectively. Finally, f designates the external forces vector resulting from short-circuit currents. These forces, commonly referred to as Laplace forces, are defined in Code_Aster as the product of two functions, one depending on the time and the other on the space coordinates. Notice that in this study, the power supply feeds only two phases (say phases 2 and 3), the function of time g, for a force per unit length, is given by:
7
2 3
( ) 2.10 ( ) ( )
g t i t i t (2) The intensities in the fed phase conductors i2 and i3are defined according to the following formula:
/
( ) 2 cos t cos
j j j j
i t I
t e
(3) in which Ij is the magnitude of the current j and
its pulsation.
j is the phase, dependant on the short-circuit inception, and
a time-constant.The temporal integration is performed using the Newmark implicit scheme, and the entire problem is solved in an incremental way with the classical Newton-Raphson method in order to cope with the geometric non-linearities due in particular to the motion of the conductors.
Results from a full-scale test program carried out at the R&D EDF laboratory Les Renardières are used thereafter to validate the present numerical approach. The testing facility is similar to the numerical structure but includes additional hardware accessories, such as insulator strings, jumper loops and droppers, which are not represented in the numerical model as they would unnecessarily increase its complexity. Nevertheless, their contribution is taken into account through an equivalent damping coefficient for the conductors estimated based on experimental observations and preliminary numerical study. Damping coefficients of 5 % and 1 % are used throughout this study for the cables and the gantries, respectively.
RESULTS AND DISCUSSION
Several calculations were performed using the presented numerical model. As stated above, the results are first compared against those obtained experimentally (time-history records). The comparisons concern the axial forces in both the conductors and the A-frame gantry and the bending moments in the A-frame structure. Once validated, the numerical model is used to conduct a study by varying the most influential parameters that are: the effective intensity of the short-circuit currents Ik and the short-circuit duration d (which takes the same value for the applied two short-short-circuits). It is worth mentioning that analogous experimental results are available for all the cases covered in this paper but they are not reported here for the sake of brevity. For all the cases studied here, fully asymmetrical
short-circuits are considered as they have shown to be more stringent than symmetrical ones. That is done by setting the phase
equal to zero.The reference case considered to study the accuracy of the numerical modeling concerns the following parameters: Ik = 31.5 kA, d = 120 ms, and ti = 3 s (ti being the time interval separating the two consecutive short-circuits). In what follows, results from models A, B and C are discussed. The reported outcomes concern the axial forces measured in the phase conductor 3 and the axial forces/bending moments (about y-axis) in the main leg 4 (A-frame gantry 1), in order to make them comparable with the experimental measurements. Let us mention that the forces transmitted by the conductors to the gantries induce herein a non-uniform bending moment about x-axis. Accordingly, forces in the four main legs of the A-frames are such that the intensity carried by leg 1 and leg 2 is different from the one carried by leg 3 and leg 4. (leg 1 and leg 3 are in compression while leg 2 and leg 4 are in tension).
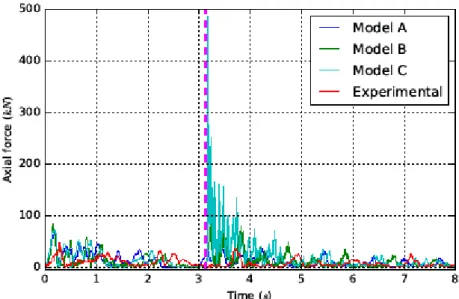
Comparison between the numerical and the experimental axial forces is depicted in Figure 2 for the phase conductor 3. One may notice that the three numerical results show similar trend as for the experimental results, yet, model A and model B give the most accurate results. The fact that it is almost impossible to reproduce in practice exactly the same dynamic behavior of the conductors may explain the scatter between the two models A and B and the experimental results. Indeed, when subjected to a short-circuit impact, the conductors undergo a very complex pattern of electromagnetic excitation and their response is characterized by large and chaotic displacements. As for model C, one may readily check that the results are not satisfactory, especially right after the second short-circuit triggering (at 3.12 s), since the model does not account for the dynamic coupling between the conductors and the gantries.
Figure 2. Numerical versus experimental axial forces in the phase conductor 3
Figure 3 shows the numerical axial forces and bending moments about y-axis, together with their experimental counterparts in the leg 4. As for the conductors, the numerical and experimental results follow the same tendency, and model A is once again more accurate than model B.
In sum, the previous analysis globally shows good accordance between the experimental results and the numerical models A and B despite the various numerical simplifying assumptions. In contrast, results provided by the simplified model C are too far from the experimental ones, as the effect of the gantries is neglected. Although model A has demonstrated to be the closest to reality, model B is retained to carry out a parametric study as it is computationally much more economical. The influence
of the level as well as the duration of the short-circuit currents on the substation response is analyzed subsequently.
Figure 3. Numerical versus experimental axial forces and bending moments in the A-frame main leg 4 (gentry 1) Effect of the magnitude of the short-circuit currents
The parameters defined in the previous reference example are considered for this study, only the levels of the short-circuit currents (parameter Ik) is varied to take the following values: 10, 20, and 31.5 kA. The resulting axial forces in the phase conductor 3 are plotted in Figure 4. As expected according to experimental observations, a significant increase of the forces in the conductors is clearly observed as the intensity of short-circuits increases. The maximum forces in the conductor 3 are summarized in TABLE 2.
Magnitude (kA) Maximum force during the first short-circuit (kN)
Maximum force during the second short-circuit (kN)
10 4.8 5
20 11.2 50
31.5 80 105
TABLE 2 – Maximum forces in the conductor 3 for varying levels of short-circuit currents
Therefore, efforts in the gantries would follow the same pattern. As shown in Figure 5, the axial forces and the bending moments in the leg 4 increase with the intensity of the short-circuit currents.
Figure 5. Axial force and bending moment in the leg 4 for varying levels of the short-circuits Effect of the duration of the short-circuits
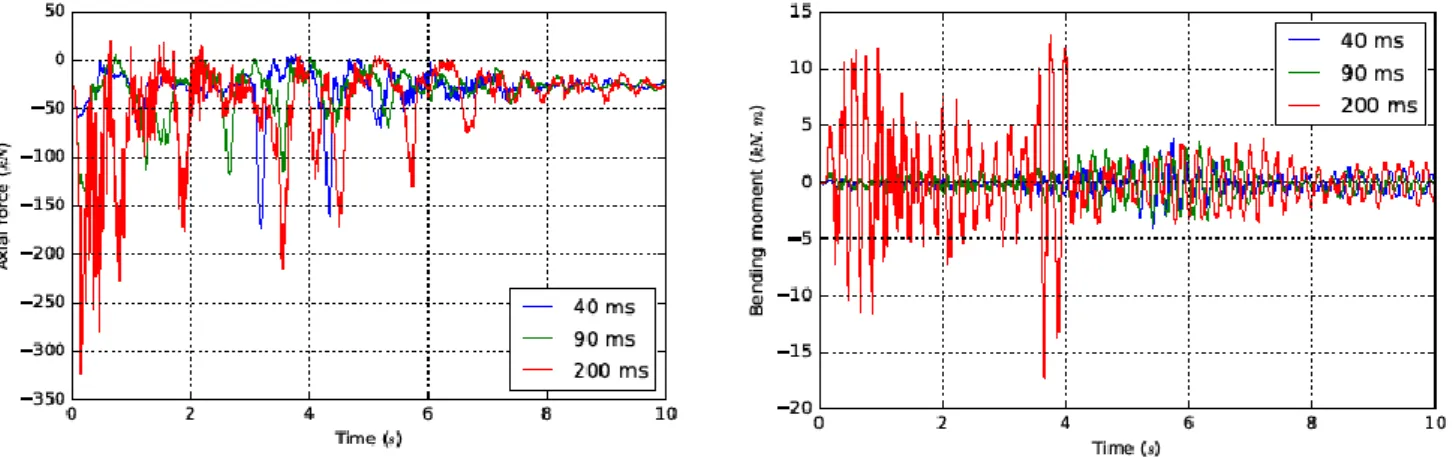
In this example, the levels of the short-circuit currents is set to 31.5 kA. All the other parameters are those of the reference case, except for the duration of short-circuits (parameter d), which takes the following values: 40, 90, and 200 ms. Figure 6 shows the axial forces in the conductors, in which one may notice a clear increase of the efforts with the duration during the first short-circuit fault. As a result, that applies also for the efforts in the gantries, as shown in Figure 7. Nevertheless, the mechanical response is not that obvious right after the second short-circuit. For example, it can be seen from Figure 6 and Figure 7 that the efforts in the substation structure increase as the duration increases between 40 and 200 ms and between 90 and 200 ms. However, the maximum efforts are in general more significant with 40 ms than with 90 ms.
Figure 6. Axial force in the phase conductor 3 for various durations of the short-circuits
Generally, the efforts in the substation structure increase with the duration of the short-circuit fault. However, in-depth analysis must be performed in order to understand potential phenomena that may occur, such as the variances observed above between the results at 40 ms and at 90 ms.
In the following, the problem handled in the present paper is analyzed using an equivalent static approach, in which a numerical static analysis is performed on the substation structure without the conductors. The accuracy of this approach is discussed through a comparison with the dynamic study.
Figure 7. Axial force and bending moment in the leg 4 for various durations of the short-circuits Dynamic analysis versus static analysis
The nonlinear static analysis is conducted for the reference example treated previously (with Ik = 31.5 kA, d = 120 ms, and ti = 3 s). Equivalent static load is applied on one isolated A-frame gantry, more specifically at the attachment points, in such a way as to simulate the forces transmitted by the conductors to the rest of the substation structure. The static loading corresponds to the maximum dynamic forces recorded experimentally in the three conductors.
The resulting numerical efforts in the analyzed structure (axial forces and bending moments about y-axis in the leg 4) are set against their equivalents measured experimentally and using the dynamic analysis (model B). The comparison shows that the experimental efforts are much higher than the numerical efforts estimated with the equivalent static method that ignores the vibrations of the gantry (see TABLE 3). One concludes that the dynamic analysis is necessary in the context of short-circuit loadings.
Axial force (kN) Bending moment (kN.m)
Experimental efforts in leg 4 400 16
Numerical efforts in leg 4 (model B) 340 23
Numerical efforts in leg 4 (static analysis) 215 3.2
TABLE 3 – Comparison between experimental and numerical (dynamic/static) maximum efforts in leg 4
CONCLUSIONS
This paper deals with the analysis of the mechanical response of a substation structures under short-circuit loadings. It aims at developing an effective time-domain model using the finite element package Code_Aster to ease the numerical study.
The proposed model is developed using one-dimensional elements accounting for large displacements to model a flexible substation structure subjected to two consecutive short-circuits. Preliminary analysis on the level of modeling reveals that a detailed modeling for both the conductors and the support structure is required for reliable results. The outcomes globally show good agreements with the experimental results.
Parametric analysis achieved in order to study the effect of various short-circuits parameters comes up to the following conclusions:
- Efforts in the substation structure increase rapidly with the intensity of the short-circuit currents.
- In most of the analyzed cases, the short-circuit duration increases the efforts in the substation structure.
This study also shows that a modeling based on an equivalent static approach may lead to inappropriate estimation of the efforts, since it does not account for the dynamic interaction between the conductors and the support structure. However, a more in-depth analysis is required for a better understanding of the phenomena involved.
Finally, it would be interesting to complete the present study by studying the effect of other short-circuit parameters, such as time interval between two consecutive short-short-circuits and the sag-to-span ratio, on the mechanical response, but also to extend the present method to other substation configurations. A comparative study between the presented numerical approach and international standards may also be performed for the analyzed cases.
REFERENCES
[1] International Electrotechnical Commission, 2011, "Short-circuit currents – Calculation of effects. Part 1: Definitions and calculation method", IEC Std. 60865-1.
[2] Working Group 23.03, 2002, "The mechanical effects of short-circuit currents in open air substations (Part II)", CIGRE Brochure 214.
[3] M.D. Budinich and R.E. Trahan, 1997, "Dynamic analysis of substation busbar structures", Electric Power Systems Research, vol. 42, 47-53.
Acknowledgements
The National Sciences and Engineering Research Council of Canada (NSERC), RTE and Hydro-Québec are gratefully acknowledged for their financial support. The authors would also like to thank EDF for performing the full-scale experimental tests and RTE for providing the experimental data.