Université du Québec
Institut National de la Recherche Scientifique Centre Énergie, Matériaux et Télécomunications
Platinum and Platinum-Ceria Catalysts for the
Electro-oxidation of Ethanol
by
Maria João Vieira Ribeiro Paulo, M.Sc. A thesis submitted to obtain the
degree of Philosophiae doctor (Ph.D.) in Energy and Materials Science December 2018
Jury Members
President of the jury: Prof. Daniel Guay (INRS-EMT) External Examiner: Prof. Rafik Naccache (U. Concordia)
External Examiner: Prof. Oumarou Savadogo (E. Polytechnique) Director of Research: Prof. Ana Tavares (INRS-EMT)
I
Abstract
Direct ethanol fuel cells (DEFCs) are a promising system and a potential sustainable power source for portable, mobile, and stationary applications. The successful application of the direct ethanol fuel cells depends on the availability of a catalyst capable of breaking the carbon-carbon (C-C) bond leading to the complete oxidation of this fuel to carbon-carbon dioxide and water, releasing 12 electrons through an external circuit. Pure Pt is the state of the art electrocatalyst for the oxidation of ethanol but it suffers from some limitations such as poisoning by CO-intermediates, resulting in a slow ethanol oxidation reaction kinetics and incomplete oxidation with the formation of by-products such as acetaldehyde (two-electron oxidation) or acetic acid (four-electron oxidation).
In this work we aim at increasing the activity of Pt for ethanol oxidation, but using an approach that differs from the traditional which consists of carbon-supported platinum catalysts. Instead, we show that the electrocatalytic activity of unsupported Pt nanoparticles (NPs) for the ethanol oxidation in acid medium can be significantly enhanced by the addition of very small amounts of CeO2 nanoparticles ( 5 wt%).
In order to understand and to compare the effect of ceria on Pt nanoparticles with different particle sizes, catalysts with the same composition were synthesized by two different methods, the Pechini (sol-gel) and reduction (solution-based) methods. Variations explored in this work to control and compare the size of the Pt particles include: a 1, 5 and 10 times dilution of the polymeric matrix for the Pechini method, and the addition of a citrate stabilizer for the reduction method. In the first method, Pt NPs with sizes ranging from 4 to 40 nm were obtained, whereas in the reduction method much smaller nanoparticles, with sizes varying between 2 and 6
II
nm, were synthesized. Comparative studies on the Pt, Pt-CeO2-1wt% and Pt-CeO2-5wt%
catalysts synthesized by both methods revealed the existence of two different effects.
In the Pechini method (larger particles), a strong electronic interaction between the Pt and CeO2 nanoparticles was demonstrated by a systematic shift of the Pt 4f7/2 peak to lower binding
energies (BE) with the addition of CeO2. As a result, the current density normalized to Pt’s
electrochemical surface area for ethanol oxidation increased up to 10 by adding 1 wt% CeO2.
This positive effect is however hindered by a high coverage of the Pt nanoparticles surface by CeO2 which results in the decrease of active sites. In this sense the addition of more CeO2
(Pt-CeO2-5wt%) was detrimental for the catalytic activity. Because there is no sharp distinction
between the nanoparticle size and ceria effects, there is no evidence of a size effect on the catalysts produced by the Pechini method.
In the reduction method, we observed sharp shifts of the binding energy to higher values of Pt 4f7/2 with a decreased of the size of Pt nanoparticles. Assuming the Wertheim’s equation
that establishes an inverse proportionality between the binding energy and the particle size of spherical-like clusters, there is evidence for the existence of size effect (final state effect). As expected, this relation is even more pronounced on the citrate-stabilized nanoparticles that correspond to the smallest catalysts produced in this work. In this sense we can remark a progressive BE increase from 71.4 eV (Pt-cit) to 71.9 eV (PtCeO2-1wt%-cit) which is inversely
related by a decrease in the Pt-cit particle size from 4 (Pt-cit) to 2 nm (PtCeO2-1wt%-cit). The
addition of 5wt% CeO2 to Pt-cit corroborates the same trend but its BE varies less than the 1wt%
CeO2 since the last two composites show almost the same particle size. Thus, this enhancement is
more meaningful on samples containing Pt-CeO2 1 wt%-cit and in Pt-CeO2-5wt% with current
III
presents the ideal size for ethanol oxidation (3 nm) to which is ascribed the best compromise between structural and electronic effects and/or oxophilicity effects of the Pt surface in order to favor the formation of CO2.
The HNMR analysis of the liquid products obtained from a 5h ethanol oxidation reaction showed different selectivity: PtCeO2-1wt%-cit produced slightly more acetaldehyde than acetic
acid, whereas PtCeO2-5wt% produced only a small amount of acetic acid. As PtCeO2-1wt%-cit
revealed a higher amount of Ce (III) and liquid products, it is possible that the ethanol oxidation to acetaldehyde and acetic acid, that requires the presence of oxygen-containing species, occurs via Ce2O3/CeO2.
______________________ ______________________
Maria João Paulo Student
Ana Tavares
IV
Acknowledgements
In first place, am deeply grateful to my professor Ana Tavares, for this experience and learning opportunity (not forgetting my master’s) especially for her friendly encouragement during my PhD. This work would not be possible without her generosity, support, kindness and patient guidance… it means a lot.
I am sincerely grateful to my jury members, Professors Daniel Guay, Raffik Nacache and Omarou Savadogo for agreeing to be the reviewers of this work and doing me the honor of being a member in the evaluation of this thesis.
I also want to thanks to professors Ernesto Pereira and Renato Freitas from Sao Carlos University for their collaboration and positive discussions on the publications enrolling this work.
I want to acknowledge to Christophe Chabanier that so kindly helped me with all the characterization techniques as well as Jean-Philippe Masse from École Polytechnique Montréal for the time spent together on TEM.
Also not forgetting my colleagues and friends Spyrus Ntais, Julie Gaudet, Jules Galipaud, Erwan Bertin, Jussara Carneiro, Francesca Capitanio, Sebastian Garbarino and Caludie Roy with whom I had most of the fruitful and pleasant work discussions.
I cannot forget the sympathy and professionalism of Hélène Tanguay, Hélène Sabourin and Louise Hudon.
The INRS would not be the same place without all the friends I made there and that filled my days with joyful moments during this long journey with which I learned, laughed and shared meals together! A special thanks to Esen Sokullu, Régis Imbeault, Juliana Barranco, Denis Ferachou, Qiliang Wei, Manoj Mridha, Antonio Benaya, Eva Hemmer, Cybelle Soares, William
V
Roger, Teresa Simão, Matteo Duca, Ivan Davalos, Hassan Hafez, Marta Quintanilla, and Shadi Rohani.
Pour ma famille au Québec, Lucie, Luc Bergeron merci pour être la et faire partie de ma vie avec beaucoup d’amour! Merci pour votre patience avec les corrections de mon français. Merci infiniment…
At last but not the least, I want to acknowledge my family my parents, my mother, my grandmother, for their unconditional love and support. To Bruno, the person I most admire in life and that hold my hand through it. Finally, a special acknowledgement to my baby Martin, for teaching me every day the true meaning of the scientific methodand for teaching me what it means a true engagement with life. Thank you.
VI
Table of Contents
Abstract ... I Acknowledgements ... IV Table of Contents ... VI List of Figures ... X List of Tables ... XV 1. Introduction...1 1.1. CO2 cycle ...11.2. Direct Ethanol Fuel Cells ...5
1.3. Ethanol oxidation mechanism on Platinum ... 10
1.4. Bifunctional and electronic effects ... 14
1.5. The Pt particle size effect ... 16
1.6. State of the art catalysts for DEFCs ... 17
1.7. Platinum and ceria catalysts ... 21
1.8. Objectives ... 24
1.9. Structure of the thesis... 25
1.10. References ... 26
2. Synthesis and characterization techniques ... 36
VII
2.2. Synthesis of Pt-CeO2 nanoparticles by the Pechini method (Polymeric Precursor Method)
... 37
2.3. Synthesis by the Reduction Method ... 40
2.4. Characterization techniques ... 42
2.4.1. X-ray diffraction ... 42
2.4.2. Transmission Electron Microscopy (TEM) ... 45
2.4.3. X-Ray Photoelectron Spectroscopy (XPS) ... 47
2.5. Electrochemical techniques ... 53
2.5.1. Cyclic Voltammetry (CV) ... 53
2.5.2. Chronoamperometry ... 55
2.6. Proton Nuclear Magnetic Ressonance Spectroscopy ( HNMR) ... 58
2.6.1. Experimental Details ... 60
2.7. References ... 61
3. Pt and PtCeO2 nanoparticles (CeO2 ≤ 5 wt%) synthesized by the Pechini method ... 67
3.1. Summary ... 67
3.2. Results and discussion ... 68
3.2.1. Physicochemical characterization ... 68
3.2.2. Electrochemical characterization ... 77
3.2.1. Ethanol oxidation ... 79
VIII
3.4. References ... 84
4. Electro-oxidation of ethanol with Pt and PtCeO2 prepared by the Reduction Method ... 88
4.1. Summary ... 88
4.2. Physicochemical characterization of the PtCeO2 nanoparticles ... 89
4.3. Electrochemical characterization ... 100
4.4. Ethanol oxidation – HNMR products characterization... 106
4.5. Conclusions ... 111
4.6. References ... 112
5. Comparison of the Pt and Pt-CeO2 catalysts prepared by the reduction and Pechini methods ... 116
5.1. Comparison of the two preparation methods ... 116
5.2. Conclusion ... 123
5.3. Future perspectives ... 124
5.4. References ... 125
A1. Résumé: Cataliseurs de platine et platine ceria pour l’electro-oxidation de l’ethanol .. 128
A2 Appendix – XPS binding energy values for the calculation of Pt4f7/2 ... 141
A3 Appendix – 1HNMR spectra ... 142
A4 Appendix – TEM images (Pechini method) ... 151
A5 Appendix – TEM images (Reduction method) ... 153
IX
A7 Appendix – Cyclic voltammetry (Reduction method) ... 155 A8 Appendix – XRD ... 156 B. Publications during PhD ... 157
X
List of Figures
Figure 1. 1 – CO2 limit levels and safety boundaries1. ...1
Figure 1. 2 – Direct ethanol fuel cell (acid) from Zakaria et al. 17 ...6
Figure 1. 3 – Polarization curves of DEFC as a function of temperature for Nafion-titania composite membranes.24 ...9
Figure 1. 5. – Ethanol oxidation reaction and intermediates by-products on Pt, adapted from ref 36 . ... 11
Figure 1. 6 – Catalysis of EtOH electro-oxidation by PtRu: the influence of catalyst composition. 43 ... 13
Figure 1. 7 – a) The energy level of carbon monoxide molecules, and b) the formation of the strong metal-carbon monoxide bonding (back-donation) 49. ... 15
Figure 1. 8 – Ethanol electrocatalytic activity as a function of % Ce in Pt-CeO2 catalysts67. ... 22
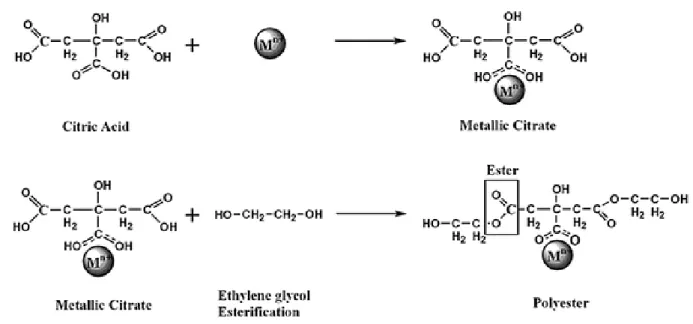
Figure 2. 1 – Scheme of a polyester network with the metallic cations represented as Mn- = Pt, Ce produced by Pechini method5. ... 37
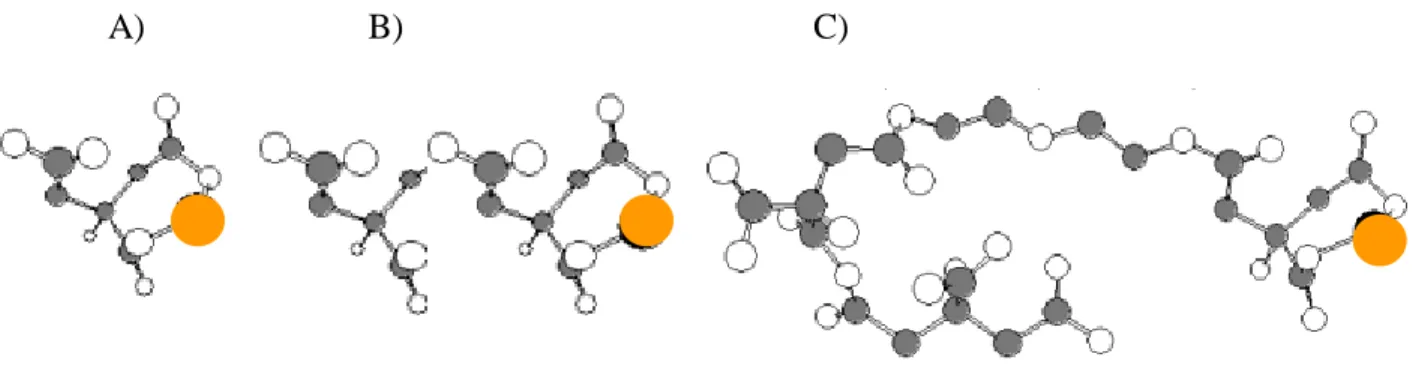
Figure 2. 2. – Scheme illustrating the effect of Pt (orange circles) dilution on the polymer network in the system: A) with 1x, B) with 5x and C) with 10x more polymer dilution. ... 39
Figure 2. 3 – Platinum sterical stabilization by citrate molecules. ... 41
Figure 2. 4 – Bragg’s law scheme of the diffracted X-ray in a crystal.20 ... 43
Figure 2. 5 – Lattice parameters (axis) and angles of a unit cell21. ... 43
Figure 2. 6 – Electron beam interaction for a thin sample24. ... 46
Figure 2. 7 – a) Illustration of the core-level photoelectron emission by the photoelectric effect in a metal; b) Scheme of a core level energy diagram for a sample26. ... 49
XI
Figure 2. 8 – Variation of the potential with time a) and variation of the current with the
potential b)42. ... 53
Figure 2. 9 – Characteristics of a double layer charging area in a Pt cyclic voltammetry. ... 54 Figure 2. 10 – a) Potential vs time waveform and b) resulting current vs time response. ... 56 Figure 2. 11 – Example of 1H NMR spectrum of ethanol plotted as signal intensity vs. chemical shift ( in ppm49. ... 59
Figure 2. 12 – Example of the chemical shifts observed in this work for Pt (sample #1). ... 60
Figure 3. 1 – X-Ray diffraction of pure Pt and nanocomposites samples synthesised by the
Pechini method for: a)-c) Platinum d)-f) PtCeO2-1wt% g)-i) PtCeO2-5wt% with zero, five and
ten times dilution. ... 68
Figure 3. 2 – (a) to (c) X-ray diffraction patterns of CeO2 nanoparticles synthesised by the
polymeric precursor method with 1 , 5 and 10 dilution of the cerium precursors in the polyesther gel. ... 69
Figure 3. 3 – a) - i) TEM images of Pt (a) to (c), Pt-CeO2 1wt% (d) to (f) and Pt-CeO2 5 wt%
(g) to (i) nanoparticles. The statistics for the particle size distribution was done counting 100 particles on images with a 20 nm scale. ... 70
Figure 3. 4 – j) - l) TEM characterization for CeO2 produced by Pechini method with and
without polymeric dilution. The average particle size of CeO2 is between 6 and 8 nm. ... 72 Figure 3. 5 – High resolution ceria spectra for Pt 4f with applied dilutions a)-c) and for Pt 4f in
XII
Figure 3. 6 – Binding energy of Pt 4f7/2 as function of Pt nanoparticles’ average particle size.
The ceria wt% and of the dilution of the Pt and Ce precursors in the polyester gel are indicated in the figure. ... 74
Figure 3. 7 – High-resolution spectra of Ce 3d with 0x, 5x and 10x dilutions for pure ceria a)-c),
for PtCeO2-1wt% d)-f) and for PtCeO2-5wt% g)-i). ... 75 Figure 3. 8 – Binding energy associated to a) u1 Ce (III) and b) v0 (Ce(IV)) main peaks c)
variation of the Ce (III)/Ce (%) and d) Ce/Pt at% ratio. ... 76
Figure 3. 9 – Cyclic voltammograms in the 0.5M H2SO4 electrolyte at 50mVs-1 for a) pure Pt, b)
PtCeO2-1% and c) PtCeO2-5% composites prepared with 1 × (green), 5 × (red) and 10 × (black)
dilution in the precursor polyester gel. The current is normalized to Pt’s electrochemical surface area. ... 79
Figure 3. 10 – Cyclic voltammograms recorded in 1 M ethanol in 0.5 M H2SO4 electrolyte at 50
mV.s-1 for (a) Pt, (b) Pt-CeO2 1wt% and (c) Pt-CeO2 5wt% composites prepared from 1 ×
(black), 5 × (red) and 10 × (blue) dilution in the precursor polyester gel. The current is normalized to Pt’s electrochemical surface area. ... 80
Figure 3. 11 – Chronoamperometric measurements recorded at 0.6 V vs SCE in 1 M ethanol in
0.5 M H2SO4 electrolyte for (a) pure Pt, (b) Pt-CeO2 1 wt% and (c) Pt-CeO2 5 wt% composites
prepared from 1 ×, 5 × and 10 × dilution in the precursor polyesther gel. The current is normalized to Pt’s electrochemical surface area. ... 81
Figure 3. 12 – Current density normalized to the Pt’s electrochemical surface area for the Pt,
Pt-CeO2 1 and 5 wt% composites prepared from 1×, 5 × and 10 × dilution in the precursor
polyesther gel. The current values were taken at the end (t=900 s) of the chronoamperometric measurements recorded at 0.6 V vs SCE in 1 M ethanol in 0.5 M H2SO4. ... 82
XIII
Figure 4. 1 – X-Ray diffractograms of the synthesized Pt-CeO2 catalysts and analysis of the
(111) and (220) peaks with no citrate a), c) and with citrate b), d). ... 90
Figure 4. 2 – TEM micrographs of Pt (a, b), Pt-CeO2 1 wt% (c, d) EDX analysis in inset,
Pt-CeO2 5wt% with EDX analysis in inset (e, f) and (g, h) pure ceria prepared in the absence (left
column) and presence (right column) of citrate. ... 93
Figure 4. 3 – Statistics for particle size distribution from 20 nm scale images having
approximately a distribution of 100 particles for Pt (a, b), Pt-CeO2 1 wt% (c, d), Pt-CeO2 5wt%
(e, f) prepared in the presence (left column) and absence (right column) of citrates. ... 94
Figure 4. 4 – Core level spectra of Pt 4f for PtCeO2 1 and 5 wt% in the absence (a, b, c), and in
presence of citrate (e, f, g). ... 95
Figure 4. 5 – a) Binding energy (B.E.) of the component (Pt 4f7/2) of all catalysts as a function of
(a) ceria’s amount; (b) Pt’s average particle size for the samples with citrate and citrate-free. ... 96
Figure 4. 6 – Ce 3d core level spectra of Pt and PtCeO2 1 and 5wt% in the absence (a, b, c), and
in presence of citrate (e, f, g). ... 98
Figure 4. 7 – a) (Ce/Pt) at% ratio b) Ce (III) at % surface ratio c) B.E. of component (v0) from
Ce (IV) 3d5/2 for the citrate and citrate-free samples... 99 Figure 4. 8 – Cyclic Voltammetry curves for Pt, PtCeO2-1%, PtCeO2-5% prepared (a) without
and (b) with citrate. ... 101
Figure 4. 9 – Forward scans of the currents for all catalysts (a) as prepared without citrate and
XIV
Figure 4. 10 – Chronoamperometric measurements at 0.6 V vs SCE for the catalysts prepared (a)
without and (b) with citrates. Current density at 900 s normalized to the ESA for c) citrate-free and d) with citrate batch. ... 104
Figure 4. 11 – Ethanol oxidation liquid products by Pt and PtCeO2-1 and 5 wt% prepared in the
(a,b,c) absence of citrates and (d,e,f) in the presence of citrates at 0.67V vs SCE. ... 107
Figure 4. 12 – Selectivity of each nanocomposite catalyst toward ethanol oxidation to liquid
products at the end of 5h electrolysis, according to the corresponding Ce(III) %. The corresponding current densities are indicated in green. ... 110
Figure 5. 1 – Shift in the binding energy of Pt 4f7/2 (B.E.) as a function of the average particles
sizes (nm) of the particles produced in this work, using the reduction method (RM) and the Pechinni method (PM) ... 117
Figure 5. 2 – Shift in the Pt 4f7/2 B.E. as a function of the increased amount of ceria in the Pt
nanocomposite catalysts. Catalysts were prepared by the reduction method (RM) and the Pechinni method (PM). ... 119
Figure 5. 3 – Shift in the B.E. of Ce 3d main peak (v0) as a function of increased amount of ceria
in the Pt nanocomposite catalysts. Catalysts were prepared by the reduction method (RM) and the Pechinni method (PM). ... 120
Figure 5. 4 – Current density as a function of the particle size for all catalysts produced in this
work showing that for the catalysts prepared by the reduction method (RM) the particle size effect is predominant relatively to those prepared by the Pechini method (PM). ... 122
XV
List of Tables
Table 1. 1 – Some of the most representative publications on the ethanol oxidation yields by
means of CO2, acetic acid (AA) and acetaldehyde (AAL) in acidic medium. The results are
shown for the best catalyst of each publication. ... 18
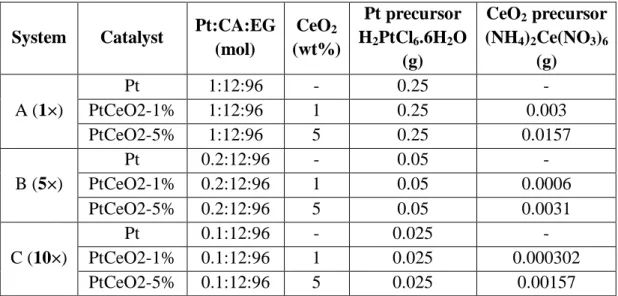
Table 2. 1 – Experimental details on the preparation of Pt and PtCeO2 by the Pechini method. . 40
Table 3. 1 – Electrochemical surface area (ESA) derived from the H-desorption region of the
1
1. Introduction
1.1. CO
2cycle
Carbon dioxide from human and animal respiration is sent into the atmosphere, and then recycled into oxygen by plants in the process of photosynthesis. This cycle that operates on a daily basis, is changing over decades and centuries. Before the widespread use of fossil fuels, the composition of the atmosphere was balanced between CO2-absorbing, oxygen-producing plants,
and CO2-producing, oxygen-absorbing animals. But exploiting and burning of fossil fuels in
large quantities is effectively creating a huge input of carbon dioxide. Before the 18th century, our atmosphere typically contained about 280 parts per million of carbon dioxide. With the spread use of the fossil fuels since industrial era, the amount of CO2 rised, reaching the value of
400 parts per million. In 2014, the CO2 concentrations crossed 400 ppm in the atmosphere for the
first time (410ppm) in at least 2.5 million years, Figure 1. 1
Figure 1. 1 – CO2 limit levels and safety boundaries1.
Recent studies state that, CO2 levels increased 100 ppm over the last century with
consequent temperature increase of about 0.8 °C over this period. Thus, if we eliminate further emissions of CO2 we would obtain near constant temperatures for many centuries2. The rapid
2
growth in demand for animal-based agriculture has put other greenhouse gases like methane and nitrous oxide into the atmosphere. The contribution of agriculture causes about 15% of global emissions1,2. Burning fossil fuels remains by far the biggest single contributor to the problem, causing 57% of global emissions1. In fact, carbon dioxide stays active in the atmosphere much longer than methane and other greenhouse gases. The consequences of this negative effect are visible as in the greenhouse effect, which causes the temperature of the atmosphere to rise as the levels of CO2 rise.
Alternative organic liquid fuels, resulting from vegetable and animal wastes, represent energy incomes that are continuously replenished and renewed3. Biomass wastes derived from domestic, commercial and industrial activities can be converted to ethanol. These include municipal solid wastes (paper, cloth, garden debris) and commercial and industrial wastes (paper, packing materials, textiles, demolition wood). Ethanol is a liquid hydrocarbon, and just like gasoline, it can be distributed via the existing infrastructure and does not require advanced mobile storage containers as it is the case with compressed H2. Different from methanol whose
low boiling point, inflammability, toxicity are harmful to the user if leakage occurs during fuel cell use, ethanol it is non-toxic. Moreover, it is reported that excessive inhalation of methanol can lead to permanent blindness or have an adverse effect on the optical nerve4.
3
Table 1 – The several sources of ethanol, the energy ratio output/input and their
commercialization status4.
Source type Sources Energy
(output/input) Commercialization stage Food crops Corn Wheat Barley Sugarcane Sugar beet Cassava Sorghum 1.4 < corn < 2.8 8 2 Commercial plants of ethanol mainly from
corn (US) and sugarcane (Brazil). Inedible parts of plant - cellulosic ethanol (non-food crops) Corn stover Wheat straw Rice straw Sugarcane bagasse 5.2 – 5.54 5.2 32 Pre-commercial stage or pilot scale. Cellulosic ethanol + waste (non-food crops) Switch grass Forest residue Agricultural waste Municipality waste 2-36 Pilot scale.
The energy output/input ratio, Table 1, is the ratio of the energy content in ethanol to the energy content in fossil fuels used to produce ethanol from the respective biomass. As an example, ethanol produced from corn using fossil fuels as source of electricity, can achieve an energy output/input ratio of 2. However, this energy balance calculated from the output/input ratio is much better if ethanol is produced from cellulosic feedstock such as corn stover, wheat straw or sugarcane bagasse. If process residues and co-products are taken into account for generating electricity (or process heat), the energy output/input ratios obtained can increase from 5.2 to 32 as shown in Table 1.Even more interestingly, ethanol can be produced from non-edible parts of the plans such as switch grass, forest residues and municipality waste. The energy
4
output/input ratio for these sources may vary from 2 to 36 depending on the effectiveness of the pre-treatment to breakdown the cellulosic structure, and also on the utilization of the residual matter for electricity/heat generation. However this last process is still at its pilot scale or demonstration level.
By the other way, using ethanol with gasoline as a vehicle fuel has greenhouse gas (GHG) emissions benefits, considering the life cycle steps required for gasoline production.Even for the common case of corn-ethanol, the carbon dioxide (CO2) released when ethanol is used in
vehicles, is re-cycled to grow crops that capture that same amount of CO25. As a result, ethanol
tolerant vehicles that can run on high-level blends of ethanol produce less net CO2 than
conventional vehicles. A 2012 study by Argonne National Laboratory, found that when these entire fuel life cycles are considered, using corn-based ethanol in place of gasoline reduces life cycle GHG emissions on average by 34%. The future use of cellulosic ethanol may potentially reduce the GHG emissions by up to 108%, since ethanol produced from cellulosic material reduce petroleum inputs substantially6 but it is not as far technologically advanced as corn from agriculture7.
The complete combustion (production of CO2) of both fuels, gasoline and ethanol, is
shown by the following equations8 1.1 and 1.2:
C8H18 (l) + 12.5O2(g) 8CO2(g) + 9H2O(l) + heat (H=3500kJ/mol)
C2H6O (l) + 3O2 (g) 2CO2 (g) + 3 H2O (l) + heat (H=1300 kJ/mol)
In general most countries try to move away from the dependence on traditional petroleum based fossil fuels in favor of more sustainable options. For instance, in Brazil, since 1976 there are no light vehicles running on pure gasoline. Since 1993, this blend was fixed by law at 22% anhydrous ethanol for the entire country9. Other countries such as the USA and more recently in
(Equation 1.1) (Equation 1.2)
5
France (with the E85 fuel containing 85% of ethanol), ethanol is already distributed through the fuel station network for use in conventional automobiles with internal combustion engines (flex-fuel vehicles)10. Canada is also requiring renewable content in fuels and it is committed to reducing its total greenhouse gases emissions by 17% from 2005 to 2020 which is estimated to result in a cumulative reduction of 47.4 million tons of CO25. In long term, the combination of
ethanol (a renewable resource) and fuel cell (a promising and attractive technology) can bring benefits, not only lowering GHG emissions but also increasing the air quality and energy security while creating economic opportunities from the social point of view11.
1.2. Direct Ethanol Fuel Cells
Fuel cells are electrochemical devices designed to convert the chemical energy of a fuel into electricity. One of the main reasons for studying direct energy conversion is to seek out new and better ways to convert our present forms of primary energy (thermal, radiant, mechanical and chemical) into electricity, while improving conversion efficiency.
Fuel cells can help to reduce our dependence on fossil fuels and diminish poisonous emissions into the atmosphere, since they have higher electrical efficiency compared to heat engines12. The efficiency of any energy conversion device is defined as the ratio between useful energy output and energy input. In practice a fuel cell has an efficiency of 50-60% whereas an internal combustion engine is less than 35% efficient13. An internal combustion engine (ICE) that drives cars is limited by the Carnot cycle which means that the engine’s conversion of heat into work, should depend on the temperatures Th and Tc (hot and cold respectively). Most efforts to improve
6
temperatures, the metal of the engine begins to soften14. However not all the supplied heat can be converted to mechanical energy15 due to heat and friction losses16. In addition the CO2 emissions
of a car are proportional to its fuel consumption. However the devices that convert a fuel's chemical energy directly into electrical energy, such as fuel cells, are not limited by the Carnot efficiency and can exceed it. A scheme of a Direct Ethanol Fuel Cell is shown in
Figure 1. 2.
Figure 1. 2 – Direct ethanol fuel cell (acid) from Zakaria et al. 17
The two half and overall reactions occurring in a direct ethanol fuel cell (DEFC) in acid medium at 25 °C are18 written in equations 1.3 and 1.4. The overall reaction is summed up in equation 1.5.
Anode C2H5OH + 3H2O 2CO2 + 12H+ + 12e- E0= 0.084V (Equation 1.3)
Cathode 2O2 + 12H+ + 12 e- 6H2O E0= 1.23V (Equation 1.4 )
7
The fuel (ethanol) is oxidized at the anode producing 12 H+ (Equation1.3) that are conducted through an electrolyte to the cathode. At the cathode, the protons will react with oxygen and, thus, water is produced (Equation 1.4). The 12 electrons that are released upon the oxidation of ethanol travel through an external circuit to the cathode, closing the electrical circuit. Inside the fuel cell, the ionic current is transported by migration and diffusion of the 12 H+ cations in the electrolyte. The overall reaction to produce electricity is shown in Equation 1.5 and the cell voltage in theory is 1.145 V (at 25 °C) i.e. if all the ethanol is fully oxidized to CO2
and water19. The Faradic or current efficiency of a fuel cell reaction can be defined as the ratio of the actual number of electrons involved in the oxidation reaction (nactual) to the theoretical
number of electrons involved in the complete fuel oxidation reaction (ntheo) as given below4,
equation 1.6.
Ef (%)=( nactual/ntheo) × 100 (Equation 1.6)
As it will be detailed in section 1.3 the ethanol oxidation at platinum electrodes leads to the formation of other reaction products than CO2, like acetic acid, acetaldehyde. These reaction
products, that involve the transfer of 4 and 2 electrons, respectively, leads to decrease the total efficiency of a DEFC. The theoretical Faradic efficiency of ethanol oxidation can vary from 33% (i.e. 4/12 × 100 = 33%) to 100% (i.e. 12/12 × 100 = 100%) respectively for a 4 electrons (partial oxidation to acetic acid, i.e., C2H5OH + H2O CH3COOH + 4H+ + 4e-) and 12 electrons
(complete oxidation to CO2 i.e. C2H5OH + 3H2O 2CO2 + 12H+ + 12e-). Therefore, it is very
important to identify the reaction intermediates and products in order to formulate the best catalyst. In practice, most of the DEFC at lab scale produce power densities of around 10% of that obtainable from the corresponding H2 fuel cell20 with 100% complete oxidation reaction.
8
and with a current density of 100 mA/cm2, a DEFC would result in an efficiency of 40%, which is in the same range of efficiency of a diesel internal combustion engine20,21. In a DEFC, however, it is yet not clear if the reduced current density is due to incomplete oxidation or ethanol crossover, or to both. The concept of ethanol crossover will be further detailed but briefly it consists on that amount of ethanol that is transported, together with protons, through the membrane from the anode to the cathode without taking part in the electrochemical reactions. This creates a mix-potential and reduces the efficiency and the overall cell performance20,21. The electrolyte is usually a solid polymer electrolyte membrane (PEM). The oxygen reduction and the ethanol oxidation occur on the two electrode assembled on both sides of this membrane. Currently the only commercial available membrane is Nafion® but ethanol and methanol crossover issues have prompted the development of composite membranes consisting of a polymer and inorganic components (e.g. nafion-composites or other ionomer membranes)22. Both proton conductivity and alcohol permeability increase with temperature in a DEFC but the higher the temperature of the alcohol solution the more severe the membrane swelling which leads to increased fuel crossover23,24. In order to increase the performance of direct alcohol fuel cells (DAFCs) and to reduce the alcohol crossover modified nafion membranes have been attempted as for example, the incorporation of titanate nanotubes in the nafion matrix23,24 . The membranes for PEM fuel cells may be suitable for low (∼40−60°C) or high (in the 100−200 °C)18,25-29 temperature or even at more intermediate temperatures. Nowadays it is necessary to look for membranes that are less permeable to alcohols and work at higher temperatures (80–120 C) to increase the rate of the electrochemical reactions involved (oxidation of alcohol and reduction of oxygen) and to manage better the heat produced10. An example of a polarization curve for a direct ethanol fuel cell, on the range 80-130 ºC (intermediate), is shown in Figure 1.3.
9
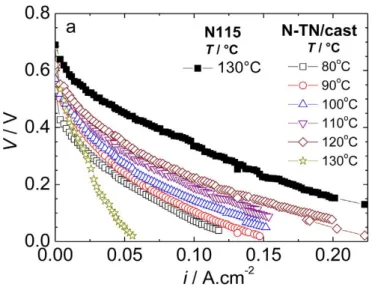
Figure 1. 3 – Polarization curves of DEFC as a function of temperature for Nafion-titania
composite membranes.24
As can be observed in Figure 1.3, increasing the temperature, increases the DEFC performance using Nafion-Titania composite membranes from 80 ºC to 120 ºC, whereas at T=130ºC the lowest DEFC performance is observed. The authors report that this temperature-limit the membrane’s thermal stability is compromised resulting in ethanol crossover within the membrane of the DEFC. As a matter of fact, the fuel crossover in DEFC is responsible for approximately 50% of the reduction of the DEFC performance23,30. By the other way, both ethanol oxidation and oxygen reduction reactions are kinetically very slow31. In the current work, we synthesize Platinum based nanoparticles to electrocatalyze the ethanol electro-oxidation reaction, equation (1.5).
Platinum is the state of art catalyst for several electrochemical reactions, not only because of its stability in both acidic and basic medium, but also because of its reactivity toward most of the oxidation and reduction reactions of a large number of molecules18,32.
10
In order to reduce fuel cell costs, efforts are primarily being made on reducing the Pt loading in the electrodes33. For the platinum group metals (Pt, Ir, Os, Ru, Rh, and Pd) the content and loading have to be low to achieve system cost targets. For automotive fuel cells systems the Pt loading varies from 0.15 to 0.3 mgPt/cm2 34 . For instance by the year 2020 the target value is
expected to be as low as 0.125 mgPt/cm2 for a H2/O2 PEM fuel cell operating at 80°C and a Pt
mass activity of 0.44 A/mg34,35.
1.3. Ethanol oxidation mechanism on Platinum
Oxidation of alcohols, aldehydes, ketones and carboxylic acids are among the most extensively studied reactions on small organic molecules (SOM) on transition metal surfaces such as Pt. The reaction pathways and product selectivity observed during the decomposition of alcohols and aldehydes depend on the transition metal36 . Figure 1.5 shows the whole schematic process of ethanol partial and total oxidation on Pt.
11
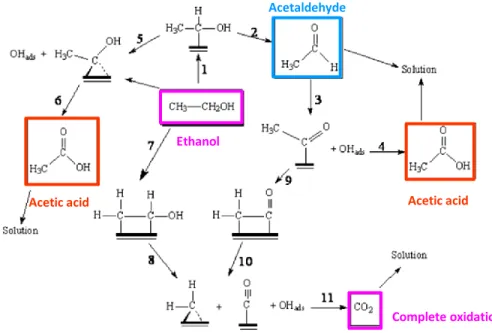
Figure 1. 4. – Ethanol oxidation reaction and intermediates by-products on Pt, adapted
from ref 36.
Ethanol can be first adsorbed on the surface of a Platinum site followed by the -C-H dissociation, leading to the formation of adsorbed acetaldehyde (step 1) that can be released in the solution (step 2)36,37. These are the simplest and fastest steps, which justify the high amounts of acetaldehyde usually obtained by electrolysis. Acetaldehyde can be re-adsorbed according to step 3 and interact with adsorbed OH generating acetic acid in step 436. This product can be also formed through steps 5 and 6 but it is apparently less probable. On the contrary to acetaldehyde, acetic acid is not desirable since it is extremely stable (non-reactive specie) in acid solution impeding the total ethanol oxidation toward CO238. Acetaldehyde may react with the Pt surface
to be oxidized to CO2. Many catalyst materials have been investigated so that ethanol is
selectively oxidized to CO2 instead of partially oxidized to acetic acid and/or acetaldehyde, the
main products in most of the DEFCs. In section 1.6 we will show examples on the ethanol oxidation reaction products.
Acetaldehyde
Ethanol
Acetic acid Acetic acid
12
It is also well known that CO irreversibly adsorbs on the Pt surface, blocking the active sites in the final step. CO strongly binds to platinum with time until total saturation. This phenomenon is known as platinum poisoning. Consequently, the attachment of a CO molecule onto the catalyst reduces the surface available for ethanol oxidation. The presence of adsorbed CO can be explained by two distinct sequences: steps 7 and 8 or steps 9 and 10. In the first case, one molecule of ethanol must adsorb on Pt by the two C-H groups leading to the rupture of the bond between two C atoms36. The second one implies the rupture of the C-H bond of the intermediate form after the acetaldehyde adsorption. Finally, the COads species can react with
adsorbed OH to form CO2 completing the total ethanol oxidation.
It is obvious that an ideal catalyst for ethanol oxidation would be one that results in the selective formation of CH2CH(OH)ads species by the cleavage of C-H bonds (step 7) followed by
C-C bond cleavage (step 8) and subsequent oxidation of intermediates to CO2 in the presence of
adsorbed OH39. To overcome this problem, a second metal which helps Pt to become CO-tolerant, is added to platinum. The second metal should either be able to form oxygenated species (metal-OH) at potentials lower than that for pure Pt or electronically weaken the platinum to CO bond. This would lead to a more complete ethanol oxidation than on a pure platinum catalyst40,41.
Among the metals that can be used, Ru42 has been extensively used due to the easy formation of Ru-OH species at low potentials. For example, Iwasita studied the activity of PtRu electrodeposits with different compositions toward the electrochemical oxidation of ethanol. As shown in Figure 1.6, the catalysts with low Ru content exhibit a very low activity.
13
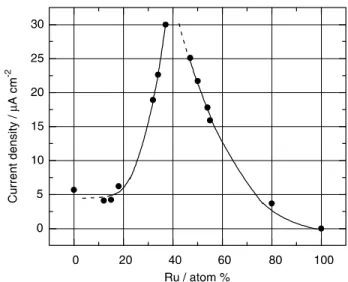
Figure 1. 5 – Catalysis of EtOH electro-oxidation by PtRu: the influence of catalyst
composition. 43
At low Ru concentration, there are not enough Ru sites to effectively assist the oxidation of adsorbed residues and the oxidation current remains almost at the levels obtained for pure Pt. For a Ru content higher than 20 at%, the current densities increase steeply. A Pt:Ru ratio of 60:40 seems to be close to the optimum composition for the ethanol oxidation. Ru concentrations higher than ca. 40 at% cause the current to fall. This effect can be rationalized in terms of an inhibition of ethanol adsorption, which is probably due to the diminution of Pt sites. Therefore, the presence of small amounts of Ru has no effect on the ethanol oxidation current. The promoting current density of Ru starts at a minimum concentration of 20%.
A series of PtM alloys were tested by Beden44 to study the oxidation of small organic molecules in acid and basic media. The authors conclude that from all metals (Ru, Sn, Re, Pb) alloyed with Pt, Ru provided a higher catalytic activity in all the tested experimental conditions. However, the limited availability of Ru may become a significant problem before PEMFC systems can be placed on the market. Due to the limited availability of Ru, it is necessary to find alternative metals at a lowest potential possible. Many other Pt-based catalysts, with a good CO
14
tolerance and that can provide OH, have thus been proposed as alternatives to PtRu45 which are Pt-SnO36, Pt-WO346, Pt-ZrO247, Pt-TiO248 . Indeed the addition of other oxophilic elements to Pt,
in the form of an alloy or a co-deposit also yields to a significant improvement in the CO-tolerance relative to pure Pt49. Consequently, it is generally accepted that complete ethanol electro-oxidation, cannot be performed on Pt only and the operating mechanisms behind the role of the second element are presented in the next paragraph.
1.4. Bifunctional and electronic effects
The “bifunctional effect” was initially proposed in the 70s by Watanabe and Motoo42 to explain the CO oxidation on PtRu catalysts. In this mechanism, platinum is the catalytic material that breaks the C-C chemical bond in ethanol, while ruthenium provides oxidizing species releasing the adsorption sites of platinum occupied by CO (Equation 1.6). Specifically, ruthenium is known to easily bond hydroxyl species (OHads) at a more negative potential than Pt
(Equation1.7). The adsorbed OH reacts with the adsorbed CO on the Pt neighbor oxidizing it (Equation1.8). In this way the CO is transformed in CO2, and the platinum sites become again
available to adsorb ethanol49:
Adsorption: Pt + CO → Pt-COads
Water activation: Ru + H2O → Ru-OHads + H+ + e-
CO to CO2 conversion: Pt-COads + Ru-OHads → Pt + Ru + CO2 + H+ + e-
The “electronic effect” can also be used to explain the mechanism on bimetallic catalysts. This theory is related with the modification of the Pt electronic properties by its co-catalyst. Some authors also call it « ligand effect » since it resembles what occurs when a ligand is bound to an inorganic complex50. It has been proposed that in the electronic effect, the CO tolerance is (Equation 1.6) (Equation 1.7) (Equation 1.8)
15
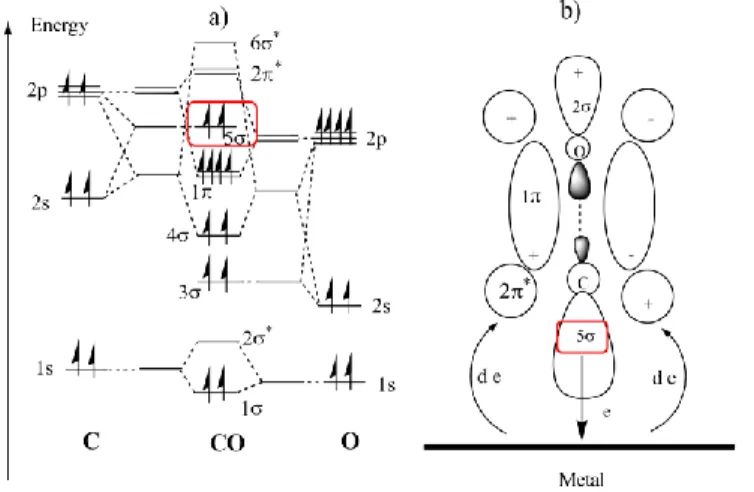
associated with an energy shift of the Pt 5d electronic states caused by the second element. As explained in Figure 1. 6 a) and b), a linear or bridge-bonded CO species are formed on the Pt catalyst surface51-54. Such strong binding between the metal and CO, has been explained by the electron donation of two electrons from the 5 carbon monoxide orbital, Figure 1. 6 a) to the metal, and subsequent transfer of the same two electrons from the d metal atomic orbital to the antibonding 2* CO orbital49, Figure 1. 6 b). This electron transfer is known as back-donation.
Figure 1. 6 – a) The energy level of carbon monoxide molecules, and b) the
formation of the strong metal-carbon monoxide bonding (back-donation) 49.
The proximity of the second metal (the co-catalyst) modifies the electronic structure of Pt. For example, in a presence of less electronegative metals, the electronic density around Pt will increase, increasing the back donation effect. In this way, the strength of the C-O bond will decrease, and the CO will be activated for further oxidation to CO2 so that it desorbs from Pt
surface. As a result the Pt–CO interactions will become weakened and the poisoning effect on Pt is diminished.
16
1.5. The Pt particle size effect
The first direct evidence reported for the effect of the Pt particle size on the binding energy studied by X-Ray photoelectron Spectroscopy (XPS) was done by Mason et al.55 in 1977. The author wrote that “The effects of cluster size on electronic structure are manifested by the variations in core spectra”. Since then, it has been generally accepted that the electrocatalyst size effect certainly exists and in this case, for the electro-oxidation of alcohols and their derivatives on the Pt electrocatalyst surface.
Arenz et al.56 recently showed that the rate of CO2 production is strongly dependent on
the size of Pt nanoparticles in the order of 1 ≤ 2 < 5 << 30 nm. However, they ascribed their results to the number of defects, which were abundant on the surface of large particles and played a beneficial role in CO oxidative removal. In another study57, the catalytic activity of a series of Pt/MWCNTs with average particle size of 1.7, 2.4, and 4.0 nm were tested toward alcohol electro-oxidation reactions, (methanol, ethanol and ethylene glycol) following similar conclusions. The authors reported that the catalytic activities had a strong dependence on their Pt particle size: as the size decreased, the alcohol electro-oxidation increased but this benefit was limited to a stronger CO adsorption on the smaller Pt nanoparticles. Bergamaski et al.58 found that the optimum particle size for methanol electro-oxidation to CO2 was 3–10 nm, and the loss
in efficiency mostly occurred on either too small or too large particles. The authors point out the critical desorption of formaldehyde by-product to the solution once out of this range. Interestingly, in another study59 on ethanol oxidation in platinum nanoparticles in the 2−6 nm range, showed that the Pt catalytic activity (in both the gas and liquid phases) is highly dependent on the size, but not the selectivity. Acetaldehyde was then a general major product.
17
The effect of particle size on the current density of the ethanol oxidation reaction (EOR) has been less studied than in methanol but Perez et al.60 studied the electroactivity of particles with diameter inferior to 5 nm. The author that extensively studied the effect of the particle size on EOR found a maximum current density of 32 mAcm-2 when the Pt (carbon supported) particle size was 2.6 nm for ethanol oxidation. The origin of this particle size effect appears to be due to the stronger adsorption of oxygenated intermediate species on the smaller particles.
1.6. State of the art catalysts for DEFCs
Studies performed in the last two decades reported a wide spectrum of CO2 yields for the
ethanol oxidation reaction. An overview about some publications dealing with ethanol oxidation reaction in acidic media and their key findings are briefly presented in Table1.115.
18
Table 1. 1 – Some of the most representative publications on the ethanol oxidation yields
by means of CO2, acetic acid (AA) and acetaldehyde (AAL) in acidic medium. The results are
shown for the best catalyst of each publication.
Catalyst Method Pt loading Setup T (ºC) Main
product CO2 yield Ref. Polyc. Pt smooth polycrystalline Pt - 3-Electrode cell 10 AAL, AA n.a. 61 Pt Ru, Pt40% Pt-20% Ru/Vulcan XC 72 Comercial (Mateck) Anode and Cathode: 2 mg Pt/ cm2 DEFC 145 CO2 >95% 62 PtxRu(1-x), (1.0<x<0.5) potentiostatic co- deposition - 3-Electrode cell 5-40 CO2 n.a. 63 Polyc. Pt smooth polycrystalline Pt disk - 3-Electrode cell 25 AA, AAL Aprox 10% 64 Pt/C Commercial 20 wt % metal, E-TEK Inc.) 28 μgPt/cm 2 3-Electrode cell 23-30-60 AA, AAL Aprox. 7.5% 27 Pt/C, PtRu/C, PtSn(9:1)/C “Bönneman” method 1.5 mg/cm 2 3-Electrode cell, DEFC 50-110 AA, AAL n.a. 65 Pt/C “Bönneman” method Anode: 3 mgPt/cm 2 , Cathode: 2 mgPt/cm 2 DEFC 80 AA 20% 66 Pt/C Commercial (Pt 20%, Alpha Aesar, Pt:Ru, E-TEK) Anode and Cathode: 4 mg Pt/cm2 DEFC 90 CO2 86% 67 PtSn/C, PtRu/C Commercial (Johnson Matthey Corp.) Anode :1.33m gPt/cm 2 for PtSn/C and PtRu/C Cathode: 1.0 mg Pt/cm 2 . DEFC 90 AA n.a. 68
19 Pt/C Pt/CNT Pt/CNT/PANI NaBH4 reduction method Pt : 40% 3-Electrode cell Room T n.a n.a. 69 PtSn(M) M= Ni, Co “Bönneman” method
2mg/cm2 DEFC 80 n.a n.a. 70
PtSnCe (Pt=68wt% Sn=22wt% Ce=10wt% ) Polymeric precursor method 1mg/cm2 DEFC 100 CO2 Acetic acid n.a 71
The most remarkable characteristic from Table 1.1 is that the highest CO2 yields are
reported for DEFCs and not for model electrodes in a three electrodes setup62. Rao et al.67 proposed that the intrinsic anodic oxidation conditions within a PEMFC anode, mainly residence time (several weeks of operation) and Pt catalyst loading (4 mg cm-2), enhance the C-C cleavage rate. Behm et al.72showed that the main parameter to affect C-C bond breaking in ethanol oxidation is temperature. Higher temperatures lead to an enhanced CO2 efficiency (up to 50%)
because the C-C bond dissociation was reported to be as high as 90% at 250 ºC15. In a recent review paper73, it is also reported that Pt completely oxidizes ethanol to CO2 but rather in small
amount. At higher temperature, Pt alone has a higher conversion to CO2 than other catalysts at 80
ºC but this value remains below 20%. However,it is important to mention that mechanical and thermal stability, along with high ionic conductivity, have to be met with the membrane material in a DEFC. The fraction of ethanol that is converted to CO2 is also influenced by other different
parameters such as ethanol concentration. Camara and Iwasita64 found that the production of acetic acid and acetaldehyde depends strongly on the ethanol concentration. Total oxidation to CO2 and high yields of acetic acid was only observed at ethanol concentrations below 0.1 M.
With increasing ethanol concentration, the oxidation to acetaldehyde becomes the main reaction. This is one of the keys to the complete oxidation to CO2 i.e. to find a way to selectively produce
20
acetaldehyde (aldehydes) even before undergoing the C-C cleavage of the ethanol structure. If this cleavage does not occur, then the non-oxidized acetic acid may form in abundance which is a dead-end procuct70. The same strategy is followed by Beyhan et al.70 that studied several combinations of trimetallic catalysts from the PtSnM family (M=Ni, Co, Rh, Pd) in order to find out the best catalyst for acetaldehyde yield. The authors found out that both Ni and Co can promote the high yields of acetaldehyde that can be further oxidized to CO2. Thus, both
PtSnNi/C and PtSnCo/C produced a four times higher catalytic activity than PtSn/C bimetallic catalyst. Still in the field of rare earths, De Souza et al.71 investigated the ethanol oxidation reaction using PtSnCeO2/C electrocatalysts observing a current density 50% higher than that
observed for commercial PtSn/C. Their tests in DEFC also showed a power density 40% higher than for the same commercial PtSn/C electrodes. The authors found that for PtSn/C electrocatalysts acetaldehyde and acetic acid were the main products while on PtSn/CeO2/C
electrocatalysts produced CO2 and acetic acid. It is very interesting to note that PtSn/C lead to
acetaldehyde, which involves only two electrons per ethanol molecule while the presence of cerium was necessary to convert ethanol preferably to acetic acid which in the end resulted in the best performance for PtSnCe/C catalyst. Data from FTIR suggested that the presence of Sn and Ce either favor CO oxidation, since they produce an oxygen-containing species to oxidize acetaldehyde to acetic acid but the authors do not exclude the possibility of a change in the platinum electronic density due to both elements.
21
1.7. Platinum and ceria catalysts
Pt is recognized to be the best monometallic catalyst for oxidation of small organic molecules in acid medium. However, certain metal oxides such as RuO2,74 WO346, ZrO247,
TiO248, and CeO275-77, have been found to enhance the catalytic activity of Pt for ethanol or
methanol electro-oxidation through synergetic interactions. Nobel metal-ceria based catalysts are among the systems known to exhibit strong catalyst and co-catalysts interactions78. Yao et al79 showed in 1984, that ceria was a chemically active component in such catalysts where it appeared to play the role of an oxygen storage component, releasing stored oxygen during fuel-rich cycles, thus facilitating oxidation of hydrocarbons and CO. Therefore, CeO2 have been
proposed as Pt co-catalyst for the oxidation of small organic molecules80 and many authors have already verified that CO oxidation to CO2 is strongly promoted on Pt partially covered by
CeO278,81-83. In addition, this rare earth costs 4 times less than ruthenium, 10 times less than
iridium, 15 times less than palladium, and 35 times less than rhodium or Pt84.
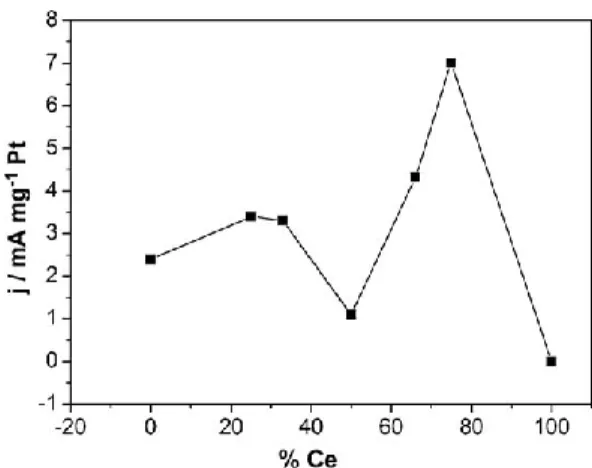
De Souza et al. already reported on a progressive increase in the Platinum’s catalytic performance toward ethanol oxidation85 from 0 to 25 wt% of Ce and then from 50 to 70 wt% although there is no specification on the products obtained, Figure 1. 7. The authors also reported a Pt particle size of 3 nm for all the Pt-CeO2 electrocatalysts.
22
Figure 1. 7 – Ethanol electrocatalytic activity as a function of % Ce in Pt-CeO2
catalysts67.
The Pt performance is enhanced even at Ce contents as low as 25 wt%. The dependence of the current density with %Ce show two maxima, Figure 1. 7. Both enhancements can be attributed to a higher CO tolerance but it is not clear if it is because of bifunctional or electronic effects. For a Ce content of 50% the current decreases substantially, and the authors correlated it to the lower specific surface area of Pt of the catalyst. This behavior is completely different from that observed for Pt-Ru catalysts, where the current densities on catalysts with a Ru content higher than 25% increase steeply, and a Pt:Ru ratio of 60:40 seems be the optimum for ethanol oxidation43, Figure 1.6. The authors conclude that ceria’s behaviour may not be described only by bifunctional mechanism as in PtRu. In a published study86 on the methanol oxidation on PtCeO2 with only 9 wt% of ceria, the composite catalyst exhibited a better activity (20 mA/cm2
with chronoamperometry at 0.5 V vs SCE) and stability than did the unmodified Pt/C (1 mA/cm2 with chronoamperometry at 0.5 V vs SCE. For a matter of comparison, the authors reported a commercial PtRu with electrochemical activity of 30 mA/cm2 under the same conditions.
23
Corradini et al.87 synthesized by the Polyol method, Pt with rare earths (Lanthanides, Ln) catalysts with the same general composition Pt=85 and Ln=15 wt%, including cerium, for ethanol oxidation reaction. The obtained current density follows the order Pt/C < Pt–Eu < Pt–La ~ Pt–Pr ~ Pt–Ce indicating that cerium is the lanthanide with best current density competing with praseodymium (Pr) both reaching approximately a current density of 0.01 mAcm-2 (chronoamperometry at 0.6 V vs RHE). In another work also dedicated to ethanol oxidation, Cordeiro et al.88compared oven-dried PtCeO2 samples at different temperatures, where the
amount of ceria is twice more the amount of Pt. The authors reported that ceria increased two times more the Pt current (chronoamperometry at 0.5 V vs RHE), which was attributed to the heat treatment at 400 ºC. This temperature allowed a suitable crystallite size (8.1nm) and a proper bandgap size of 3.43 eV for optimal electron conduction. Wang et al.89 synthesized Pt-CeO2 catalysts by CBPLD under different pressures finding out that at 0.5 Torr the current
density reached its maximum of 15 mA cm-2 (chronoamperometry at 0.6 V vs Ag/AgCl) due to a higher ESA of the Pt, which exposed a larger number of active sites for surface reactions.
In fact, ceria’s enhanced ability to adsorb, dissociate and release oxygen via the Ce4+/Ce3+ redox cycle80 may justify in many cases its co-catalytic effect. Ceria may adopt several non-stoichiometric oxides between two limit compositions CeO2 (Ce4+) and Ce2O3 (Ce3+) or in
general, CexO2-x. Its defects are oxygen vacancies, acting as an oxygen buffer80,90 facilitating the
incorporation of oxygen into the Pt surface. Thus, ceria can be regenerated due to the oxygen mobility inside its structure80 and this microstructure changes could be behind the enhanced catalytic effect of ceria91. The role of low amounts of CeO2 in the Pt catalyst with respect to
alcohol’s oxidation is not well established. Many alternatives to PtRu have been published on the methanol oxidation on a series of Pt-CeO2 catalysts. Kakati on its recent review91 “Anode
24
Catalysts for Direct Methanol Fuel Cells in Acidic Media: Do We Have Any Alternative for Pt or Pt–Ru?” further explains that CeO2 should be « designed » for synergic interactions with Pt
nanoparticles in order to minimize side effects of CeO2 low electronic conductivity. In addition,
since ceria is insoluble in dilute acidic solutions, it provides an anticorrosion property to the carbon material. Apart from this corrosion resistance, CeO2 serves as an anchor to prevent
agglomeration of Pt nanoparticles, thereby enhancing methanol and ethanol oxidation activity86,91.
In this work, several Pt-CeO2 catalysts have been prepared and their performance has
been studied toward the electrochemical oxidation of ethanol.
1.8. Objectives
Most of the studies in the literature, report on PtCeO2 with CeO2 > 10 to 25 wt%. Also,
most of the studies are devoted to the methanol oxidation. To the best of our knowledge there is a gap of studies on the effect of very small of ceria (CeO2 < 5wt%) on the electrocatalytic
activity of Pt toward ethanol oxidation in acid medium. The only approach found on this sense, dates from 1978, where Georg-M. Schwab92 reported on a system consisting of a semiconductor supported by a metal material termed as an “inverse supported catalyst” (for several catalytic reactions). The author reports that in this situation, the electronic effects on the catalysts are larger than in the usual “normal supported catalysts” because the number of free electrons in a metal is several orders of magnitude higher than in semiconductor. Naturally, this interaction mainly involves those Pt particles in close contact with ceria93. Furthermore, we aim to clarify the influence of the particle size and synergic effect of ceria on the particle’s electrocatalytic reactivity. Since size effects also influence the activity of Pt toward ethanol oxidation, PtCeO2
25
physicochemical investigation of the catalysts is carried out by X-ray diffraction (XRD), X-Ray Photoelectron Spectroscopy (XPS), Transmission Electron Microscopy (TEM) in order to understand the effect of the catalyst’s particle size, morphology and binding energy shifts (electronic effects) and the ethanol oxidation reaction. Since the catalytic activity and selectivity of metal nanoparticles can be tuned by interactions with other nanoparticles94, the main objective of this work is to investigate the addition of very small amounts of CeO2 (≤ 5 wt%) on the
electrocatalytic activity of Pt. We will also aim to further understand the discernible changes in particle electronic and structural properties of these catalysts as function of the particle size and associated binding energies.
1.9. Structure of the thesis
This thesis is organized in 5 different chapters. In chapter 1, an introduction to the direct ethanol fuel cells applications and on the state of the art Pt based catalysts is presented. This description is also extended to the context of the bifunctional, electronic and particle size effects. In chapter 2, the synthesis of the PtCeO2 with CeO2 ≤ 5 wt% by the Pechini and Reduction
methods are detailed followed by a description of the experimental conditions and techniques. The results obtained for the Pechini method are summarized in chapter 3 while those from the Reduction method are presented in chapter 4. Finally chapter 5 presents the conclusion and a description of future work that will need to be performed. A summary in French is available in
26
1.10. References
1. https://350.org/science/.
2. Harde H. Scrutinizing the carbon cycle and CO2 residence time in the atmosphere. Global and Planetary Change 2017;152:19-26.
3. Duff SJB, Murray WD. Bioconversion of forest products industry waste cellulosics to fuel ethanol: A review. Bioresource Technology 1996;55:1-33.
4. Badwal SPS, Giddey S, Kulkarni A, Goel J, Basu S. Direct ethanol fuel cells for transport and stationary applications – A comprehensive review. Applied Energy 2015;145:80-103.
5. https://www.ec.gc.ca/energie-energy/default.asp?lang=En&n=828C9342-1.
6. Farrell AE, Plevin RJ, Turner BT, Jones AD, O'Hare M, Kammen DM. Ethanol Can Contribute to Energy and Environmental Goals. Science 2006;311:506-8.
7. https://www.afdc.energy.gov/vehicles/flexible_fuel_emissions.html 8. https://oss.adm.ntu.edu.sg.
9. https://en.wikipedia.org/wiki/Ethanol_fuel_in_Brazil#cite_note-Lei8723-16.
10. Lamy C, Coutanceau C, Leger JM. The direct ethanol fuel cell: a challenge to convert bioethanol cleanly into electric energy. Catalysis for sustainable energy production 2009:1-46. 11. Demirci UB. Direct liquid-feed fuel cells: Thermodynamic and environmental concerns. Journal of Power Sources 2007;169:239-46.
12. Carrette L, Friedrich KA, Stimming U. Fuel Cells – Fundamentals and Applications. Fuel Cells 2001;1:5-39.
13. Zhang J. PEM fuel cell electrocatalysts and catalyst layers: fundamentals and applications: Springer Science & Business Media; 2008.
27
15. Friedl J, Stimming U. Model catalyst studies on hydrogen and ethanol oxidation for fuel cells. Electrochimica Acta 2013;101:41-58.
16. Rebhan E. Efficiency of nonideal Carnot engines with friction and heat losses. American Journal of Physics 2002;70:1143-9.
17. Zakaria Z, Kamarudin SK, Timmiati SN. Membranes for direct ethanol fuel cells: An overview. Applied Energy 2016;163:334-42.
18. Lamy C, Belgsir EM. Other direct-alcohol fuel cells. In: Handbook of Fuel Cells: John Wiley & Sons, Ltd; 2010.
19. Soloveichik GL. Liquid fuel cells. Beilstein journal of nanotechnology 2014;5:1399. 20. Wang J. Barriers of scaling-up fuel cells: cost, durability and reliability. Energy 2015;80:509-21.
21. Deluga G, Salge J, Schmidt L, Verykios X. Renewable hydrogen from ethanol by autothermal reforming. Science 2004;303:993-7.
22. Andreadis G, Tsiakaras P. Ethanol crossover and direct ethanol PEM fuel cell performance modeling and experimental validation. Chemical Engineering Science 2006;61:7497-508.
23. Ahmed M, Dincer I. A review on methanol crossover in direct methanol fuel cells: challenges and achievements. International Journal of Energy Research 2011;35:1213-28.
24. Matos BR, Isidoro RA, Santiago EI, et al. Nafion–titanate nanotubes composites prepared by in situ crystallization and casting for direct ethanol fuel cells. International Journal of Hydrogen Energy 2015;40:1859-67.
25. Pletcher D. Electrocatalysis: present and future. Journal of Applied Electrochemistry 1984;14:403-15.
28
26. Perez JM, Beden B, Hahn F, Aldaz A, Lamy C. “In situ” infrared reflectance spectroscopic study of the early stages of ethanol adsorption at a platinum electrode in acid medium. Journal of Electroanalytical Chemistry and Interfacial Electrochemistry 1989;262:251-61.
27. Wang H, Jusys Z, Behm RJ. Ethanol Electrooxidation on a Carbon-Supported Pt Catalyst: Reaction Kinetics and Product Yields. The Journal of Physical Chemistry B 2004;108:19413-24.
28. Wang H, Jusys Z, Behm RJ. Ethanol electro-oxidation on carbon-supported Pt, PtRu and Pt3Sn catalysts: A quantitative DEMS study. Journal of Power Sources 2006;154:351-9.
29. Wang H, Jusys Z, Behm RJ. Ethanol and Acetaldehyde Adsorption on a Carbon-Supported Pt Catalyst: A Comparative DEMS Study. Fuel Cells 2004;4:113-25.
30. DeLuca NW, Elabd YA. Polymer electrolyte membranes for the direct methanol fuel cell: A review. Journal of Polymer Science Part B: Polymer Physics 2006;44:2201-25.
31. Ramanujan D, Bernstein WZ, Benjamin W, et al. A Framework for Visualization-Driven Eco-Conscious Design Exploration. Journal of Computing and Information Science in Engineering 2015;15:041010--9.
32. Sharma S, Singh P, Hegde MS. Electrocatalysis and redox behavior of Pt2+ ion in CeO2 and Ce0.85Ti0.15O2: XPS evidence of participation of lattice oxygen for high activity. Journal of Solid State Electrochemistry 2011;15:2185-97.
33. Holton OT, Stevenson JW. The Role of Platinum in Proton Exchange Membrane Fuel Cells. Platinum Metals Review 2013;57:259-71.
29
35. Gasteiger HA, Kocha SS, Sompalli B, Wagner FT. Activity benchmarks and requirements for Pt, Pt-alloy, and non-Pt oxygen reduction catalysts for PEMFCs. Applied Catalysis B: Environmental 2005;56:9-35.
36. Simões FC, dos Anjos DM, Vigier F, et al. Electroactivity of tin modified platinum electrodes for ethanol electrooxidation. Journal of Power Sources 2007;167:1-10.
37. Vigier F, Coutanceau C, Perrard A, Belgsir EM, Lamy C. Development of anode catalysts for a direct ethanol fuel cell. Journal of Applied Electrochemistry 2004;34:439-46. 38. Figueiredo MC, Santasalo-Aarnio A, Vidal-Iglesias FJ, et al. Tailoring properties of platinum supported catalysts by irreversible adsorbed adatoms toward ethanol oxidation for direct ethanol fuel cells. Applied Catalysis B: Environmental 2013;140–141:378-85.
39. Moghaddam RB, Pickup PG. Support Effects on the Oxidation of Formic Acid at Pd Nanoparticles. Electrocatalysis 2011;2:159.
40. Mann J, Yao N, Bocarsly AB. Characterization and Analysis of New Catalysts for a Direct Ethanol Fuel Cell. Langmuir 2006;22:10432-6.
41. Iwasita T, Pastor E. A dems and FTir spectroscopic investigation of adsorbed ethanol on polycrystalline platinum. Electrochimica Acta 1994;39:531-7.
42. Watanabe M, Motoo S. Electrocatalysis by ad-atoms. Part III. Enhancement of the oxidation of carbon monoxide on the platinum ruthenium ad-atoms. Electroanalytical Chemistry and lnterfacial Electrochemistry 1975;60:275-83.
43. Camara GA, de Lima RB, Iwasita T. Catalysis of ethanol electrooxidation by PtRu: the influence of catalyst composition. Electrochemistry Communications 2004;6:812-5.
30
44. Beden B, Kadirgan F, Lamy C, Leger JM. Electrocatalytic oxidation of methanol on platinum-based binary electrodes. Journal of Electroanalytical Chemistry and Interfacial Electrochemistry 1981;127:75-85.
45. Parsons R, VanderNoot T. The oxidation of small organic molecules: A survey of recent fuel cell related research. Journal of Electroanalytical Chemistry and Interfacial Electrochemistry 1988;257:9-45.
46. Zhang D-Y, Ma Z-F, Wang G, Konstantinov K, Yuan X, Liu H-K. Electro-Oxidation of Ethanol on Pt-WO3 ∕ C Electrocatalyst. Electrochemical and Solid-State Letters 2006;9:A423-A6.
47. Bai Y, Wu J, Xi J, et al. Electrochemical oxidation of ethanol on Pt–ZrO2/C catalyst. Electrochemistry Communications 2005;7:1087-90.
48. He X, Hu C. Building three-dimensional Pt catalysts on TiO2 nanorod arrays for effective ethanol electrooxidation. Journal of Power Sources 2011;196:3119-23.
49. Ye S. CO-tolerant Catalysts. In: Zhang J, ed. PEM Fuel Cell Electrocatalysts and Catalyst Layers: Springer London; 2008:759-834.
50. Shukla AK, Aricò AS, El-Khatib KM, Kim H, Antonucci PL, Antonucci V. An X-ray photoelectron spectroscopic study on the effect of Ru and Sn additions to platinised carbons. Applied Surface Science 1999;137:20-9.
51. Beden B, Bewick A, Kunimatsu K, Lamy C. Infrared study of adsorbed species on electrodes: Adsorption of carbon monoxide on Pt, Rh and Au. Journal of Electroanalytical Chemistry and Interfacial Electrochemistry 1982;142:345-56.