Published by Canadian Center of Science and Education
Thermogravimetric Study on Devolatilization Kinetics of Chinalco
Anodes during Baking
Duygu Kocaefe1, Yadian Xie1, Yasar Kocaefe1, Liu Wei2, Shaoling Zou3 & Anjing Wu3 1 University of Québec at Chicoutimi (UQAC), Chicoutimi, Quebec, Canada
2 School of Materials and Architectural Engineering, Guizhou Normal University (GNU), China 3 Guizhou Section, Aluminum Corporation of China Limited (CHALCO), China
Correspondence: Duygu Kocaefe, Department of Applied Sciences, University of Québec at Chicoutimi (UQAC), 555 Boul. de l’Université, Chicoutimi, Quebec G7H 2B1, Canada. Tel: 1-418-545-5011 ext.5215. E-mail: [email protected]
Received: December 30, 2012 Accepted: January 17, 2013 Online Published: January 28, 2013 doi:10.5539/jmsr.v2n2p22 URL: http://dx.doi.org/10.5539/jmsr.v2n2p22
Abstract
The production of aluminum requires the use of carbon anodes which are manufactured from coke, pitch, and recycled butts and anodes. Pitch acts as a binder. Green anodes are produced by mixing all these ingredients and then forming them in a compactor. The final step is the baking of green anodes, which determines the final anode properties. During baking, volatiles evolve from the pitch which carbonizes and binds the particulate matter. Anode quality greatly influences the performance of electrolytic cells and has an impact on carbon consumption, energy use, green house gas emissions, and cost.
In this project, the effects of the baking conditions on some of the anode properties (air permeability, air and CO2 reactivities) were studied, and the devolatilization kinetics was determined for different cases. The results indicate that the lower heating rates and higher baking temperatures improve the above properties. In this article, the experimental work and the methodology for the determination of the kinetic expressions for devolatilization are described, and the results are presented. The position of volatile evolution in the baking furnace can be determined via these expressions, and this could be effectively used in controlling the volatile combustion to improve the furnace performance.
Keywords: anodes for aluminum electrolysis, carbon anodes, devolatilisation kinetics, anode properties
Nomenclature
Ei Activation energy for gas i (J/mol) H Heating rate (K/s)
ki Reaction rate constant for gas i (s-1·concentration1-n) ki0 Pre-exponential factor for gas i (s-1·concentration1-n) ki0,app Apparent pre-exponential factor for gas i (s-1) n Reaction order
R Universal gas constant (8.314 J/mol·K) R2 Correlation coefficient
t Time (s)
T Absolute temperature of sample (K) Xi Conversion of volatile component i
1. Introduction
Carbon anodes are used in alumina electrolysis to produce aluminum. Green anodes which are composed of filler dry aggregate particles (petroleum coke, recycled butts, and rejected green and baked anodes) as well as binder coal tar pitch are prepared by mixing appropriately all the constituents and compacting the mixture to form this mixture. This is followed by the baking of the anodes in a furnace with a certain heating rate up to about 1100 °C to 1200 °C. Then, they are kept at that temperature for a certain period of time (soaking time) in order to homogenise the temperature distribution within the anodes.
During baking, a part of the pitch (the binder) volatilizes, and the rest carbonizes forming a link between filler particles (coke, butts, and recycled anodes). If the anode is heated too rapidly, fast release of volatiles might cause pore and crack formation. High porosity decreases the density and the electrical resistivity of anodes. This means that the baking conditions play a major role in anode quality (Tkac, 1989).
The baked anodes are placed in an electrolysis cell. Alumina in the electrolyte reacts with carbon anode producing CO2 at the anode, and aluminium is produced at the cathode via electrolysis. The formed CO2 can further react with anode carbon (CO2 reactivity) and forms CO, which increases anode consumption. Also, air diffuses through the alumina layer covering the top of the anodes and reacts with carbon (air reactivity) giving CO2. This is another cause of anode overconsumption. Decreasing the reactivity of anodes reduces not only the cost of anode production, but also the CO2 and CO (greenhouse gas) emissions. Reactivity is related to porosity and permeability of anodes since CO2 or air can penetrate more easily into a porous body (Engvoll, 2002; Engvoll, Øye, & Sorlie, 2002).
Depending on the source of the raw material, anode quality can change which in turn affects the anode baking furnace operation. Volatiles released during baking supply part of the energy required for anode baking. Therefore, the knowledge on rate of volatile release is crucial. Also, the baking conditions yielding to best anode quality for a given raw material need to be identified.
In general, the energy supplied in an anode baking furnace is around 5.5 GJ/tonne of anode. There are heat losses due to off-gases, heating of the infiltrated air, and radiation. About 2 GJ/tonne of required energy comes from the combustion of fuel (oil, natural gas, etc.). About 1.4 GJ/tonne energy is supplied by preheated air, approximately 0.1 GJ/tonne comes from the combustion of packing coke, and around 2 GJ/tonne energy is supplied by the combustion of volatiles coming from the pitch devolatilization taking place during baking (Keller & Sulger, 2008). As it can be seen from these figures, nearly 35 % of required energy is supplied by the volatiles. Therefore, it is important to know their devolatilization kinetics in order to use this energy source effectively. The anodes which do not meet the standards (highly reactive, porous, etc.) have to be recycled which this increases the production cost. The anodes which are somewhat acceptable are consumed faster than the anodes with better quality. Identification of the suitable baking conditions will improve quality anodes and decrease the cost of production as well as the energy consumption.
This study provides the kinetic data necessary to quatify the energy available from the volatiles, the rate of volatile release in order to optimize the Chalco’s anode baking furnace operation using their raw materials. Thermogravimetric analyser is used for many purposes such as anode reactivity measurements (Lei, Liu, Li, Yang, & Wang, 2001; Lhuissier, Bezamanifary, Gendre, & Chollier, 2009; Tran, 2011), green coke devolatilization analysis (Hon, Edwards, Marino, & Lubin, 2012), pyrolysis of pitch (Sima et al., 2003). In the literature, a number of studies are reported on the analysis and the kinetic modelling of thermogravimetric weight-loss data using a differential approach (Buttler, 1975; Wallouch, Murty, & Heintz, 1972; Tremblay & Charette, 1988; Kocaefe, Charette, Ferland, Couderc, & Saint-Romaine, 1990). During baking, first heavy components such as polycyclic aromatic hydrocarbons (PAH) are evolved. This is also called condensable gas. At higher temperatures, H2 and CH4 are evolved. In earlier studies, an arbitrary temperature limit had to be set to separate the temperature range where the condensable gas is released from the temperature range where H2 and CH4 are released. Later, a model developed by Kocaefe, Charette and Castonguay (1995) eliminated the need for this arbitrary cut point. In this study, the latter model is used which is described below. To our knowledge, there is no recent study on the measurement of devolatilization kinetics of green anodes during baking.
The rate of nth order reaction is given as (Levenspiel, 1999):
(n 1) n i i 0 i dX k C 1 X dt (1) Using the chain rule, with the heating rate defined as h=dT/dt, the reaction rate can be expressed as:i i i dX dX dT dX h dt dT dt dT (2)
The Arrhenius law is given by:
exp( / )
i i0 i
k k E RT (3) Combining Equations (1), (2), and (3) and then taking the logarithms of both sides give,
, ln ln( ) ( ) i i0 app i n i dX k E dt RT h 1 X (4)
where the apparent pre-exponential factor is defined as:
( )
, n 1
i0 app i0 0
k k C (5) When the right hand side of Equation (4) is plotted as a function of 1/T, a line is obtained if the right “n” value is chosen (this corresponds to the “n” value that gives the largest correlation factor, R2). The activation energy (Ei) of a component “i” and its apparent pre-exponential factor (ki0,app) can be found from the slope and the intercept of the line, respectively.
The devolatilisation and consequent carbonization reactions depend on the raw materials used. Numereous reactions take place during carbonization and their nature is function of the operating conditions (baking temperature, heating rate, holding time) in the baking furnace. Thermogravimetric analysis can be used to simulate and to study the anode baking process. It is possible to use relatively large samples during the baking experiments in order to account for the non-homogeneity of the carbonaceous material. By following the weight loss and measuring the volatile emissions, a rate expression for volatile release can be determined for the anodes which are produced with given raw materials. Then, the properties of the anodes baked under different conditions can be measured and correlated with baking conditions. It is difficult to estimate the baked anode quality without plant trials or an experimental study. The plant trials are costly; consequently, a systematic experimental study has an outmost importance. In the present study, the behaviour of Chinalco anodes which were produced using local raw materials was investiged.
2. Method
Cylindrical anode samples with a diameter of 0.05 m and a height of 0.12 m were prepared using R&D bench scale unit (RDC 161) for green anode preparation. Then, thermogravimetric study, simulating anode baking process, was carried out under different operating conditions. The released volatiles were analysed using a gas chromatograph and their release kinetics were found using the method described in Sections 2.3 and 2.4. After baking, air and CO2 reactivities and permeabilities of anodes were measured and correlated with anode baking conditions.
2.1 Thermogravimetric Analyser (TGA)
Cylindrical anode samples were suspended from a balance (Mettler Toledo AG285, ± 0.01 g) in a tubular furnace. The anodes were baked under inert gas atmosphere. Baking conditions are shown in Table 1. First, the anode samples were heated at a predetermined heating rate up to maximum baking temperature. Then, they were kept at this temperature for a certain period of time (soaking time). The weight loss vs. time and temperature were recorded continuously with a data acquisition system (Keithly, 2700). Outlet gas was passed through an ice bath in order to separate the condensable gas before it was discharged to environment. Figure 1 shows the experimental system.
Figure 1. Thermogravimetric analyser
Table 1. Anode baking conditions
Anode Temperature(ºC) Soaking Time(h) Baking time(h) Heating rate (ºC/h)
1 1050 8 67 17.5
2 950 8 61 17.5
3 1050 12 71 17.5
4 1150 8 73 17.5
5 1050 8 111 10
2.2 Anode Characterisation Tests
CO2 reactivity, air reactivity, and air permeability of baked anodes were measured using standards ISO 12988-1, 12988-2 and 15906, respectively. For CO2 reactivity measurements, anode samples (0.05 m in diameter, 0.06 m in height) were exposed to CO2 gas flow (200 L/h) for 9.5 hours at 960 ºC using the RDC-146 apparatus. This temperature represents the temperature of the anode bottom in an electrolysis cell. Similarly, for air reactivity measurements, same size anode samples were exposed to air (200 L/h) for 11.5 h at 550 ºC which is an approximate temperature of the top of the anode in the cell during electrolysis. The RDC 151 apparatus was used for air reactivity measurements. After cooling and weighing, the samples were mechanically tumbled to remove any loosely bound particles. The total weight loss was taken as the difference between the original sample weight and the final weight which corresponds to loss due to reaction including dusting (Hume, 1999; Aanvik & Sorlie, 2000). The remaining part is the residue. The higher the residue is, the lower the reactivity of anode is (Houston & Øye, 1985).
The permeability of anode is determined by measuring the time required for a gas to pass through a sample in order to refill a partly evacuated system. This test is carried out with the RDC-145 apparatus. Disc-shaped samples with a diameter of 0.05 m and a length of 0.02 m were used (Tosta & Inzunza, 2008).
All the characterization tests were repeated three times. The values given are the average of these measured values.
2.3 Gas Analysis
condensable gas. Then, its methane and hydrogen contents were analysed using a gas chromatograph (Varian 3800) equipped with a thermal conductivity detector (see Figure 1). The detector response was calibrated for methane, hydrogen, and oxygen using calibration gases of known concentrations. Data on oxygen was used to detect if there was any air leak on the line and correct the gas concentration if necessary.
2.4 Methodology for Kinetic Analysis
a) The weight loss data obtained from the thermogravimetric analyser was converted to per 100 g anode basis in order to account for the slight weight differences among the anodes samples. Then, the derivative of this curve was taken, which gives the instantaneous total weight loss due to condensable gas, H2, and CH4 release.
b) Instantaneous concentrations of H2 and CH4 measured in ppm with the gas chromatograph (as a function of time during the experiment) were first converted to g per 100 g of anode sample using the carrier gas flowrate.
c) The instantaneous condensable gas concentration in g per 100 g of anode sample was obtained from the difference between the derivative of instantaneous total weight loss data and the sum of instantaneous H2 and CH4 concentrations.
d) Then, the instantaneous concentration curves of the three volatile components were integrated numerically in order to calculate their cumulative values as a function of time. These data correspond to the cumulative weight loss (in g/100g) released for each of the volatile components (condensable gas, H2, and CH4).
e) The conversion vs. time curves for condensable gas, H2, and CH4 were determined by dividing the cumulative weight loss of the components at any given time to its final weight loss value.
f) Once the conversion vs. time curves were obtained, the activation energies and apparent pre-exponential factors were calculated from Equation (4).
3. Results and Discussion
3.1 Effect of Baking Conditions on Anode Properties
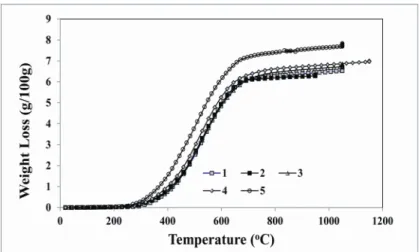
Figure 2 shows the weight loss curves of the anode samples. Anodes 1 to 4 are baked at the same heating rate. The soaking times can’t be seen on this figure since the weight loss is plotted as a function of temperature, and there is a direct relationship between temperature and time through the heating rate until the final baking temperature is reached after which the soaking period starts. Therefore, the weight loss curves of anodes 1 and 3 should be the same since their final baking temperatures are the same. This is the case as it can be seen from the figure. Slight differences can be attributed to the non-homogeneity of the anodes. The baking temperature of anode 2 was lower whereas that of anode 4 was higher than the other experiments. The anode 5 was baked using a lower heating rate. The weight loss for this anode is higher at a given temperature compared to those of the other anodes. When the anode is heated slowly, it takes longer time to reach the same temperature compared to the anodes which are baked faster. Therefore, for anode 5, the contact time between the anode and the gas is longer; consequently, it loses more weight compared to anodes 1 to 4.
Figure 2. Weight loss vs. temperature data of the anode samples
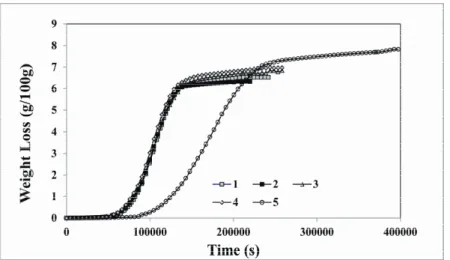
The weight loss vs. time data is presented in Figure 3. On this figure, soaking times can be seen. Weight loss for the experiment performed at the lower heating rate (anode 5) is less than the weight loss of others at a given time. The reason is that it takes longer to reach the same temperature, and at any given time, the temperature of this anode is lower compared to those of other anodes. Anode 1 is heated to 1050 C followed by eight hours of soaking. Anodes 1, 2, and 4 have the same soaking times. Anode 4 was heated to higher temperature (1150 C) which means it was heated for a longer time to reach this temperature. When anodes 1 to 4 are compared, it can be seen that anode 4 lost more weight. Soaking time for this anode was also eight hours. The reverse is true for anode 2 which has the lowest final temperature (950 C). Anode 3 has higher soaking time (12 hours) compared to other anodes. These can clearly be observed from the figure.
Figure 3. Weight loss vs. time data of the anode samples
The carbon dioxide and air reactivities as well as the air permeabilities of baked anodes were measured, and the results are presented in Table 2. Decreasing the maximum baking temperature and, consequently, the baking time increased the reactivity (decreased the residue of both CO2 and air reactivity tests) and increased the permeability of the anodes (anodes 1 and 2). This shows that the anode properties were deteriorated. Increasing the soaking time had the opposite effect (anodes 1 and 3). Increasing maximum baking temperature and time also improved the anode properties as expected (anodes 1 and 4). Increasing the baking time by decreasing the heating rate improved the reactivity, however, slightly worsened the permeability of anodes (anodes 1 and 5). It can be seen from this table that the baking conditions influence the CO2 reactivity more than the air reactivity. Permeability was affected most by the baking temperature.
Table 2. Anode properties
Anode Anode properties CO2 reactivity (% residue) Air reactivity (% residue) Air permeability (npm) 1 89.4 60.2 2.9 2 80.3 58.1 7.5 3 91.3 62.6 2.7 4 95.7 65 2.1 5 93.5 63.2 2.5 3.2 Kinetic Analysis
If the fuel and the volatiles (condensable gas, H2, and CH4) are burnt efficiently in the anode baking furnace, the energy efficiency can be improved. Therefore, the information on the release of these volatiles (quantity, time, temperature range) plays a crucial role for the baking furnace performance. This information can be used as an
input in the baking furnace models as well. Since the anode behaviour depends on the raw materials used, the devolatilization rates have to be measured specifically for a given anode.
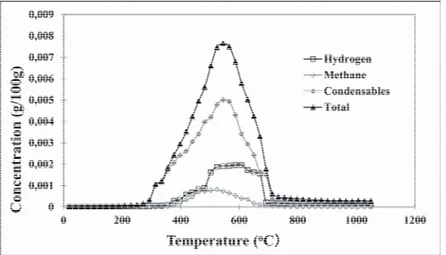
Figure 4 shows the measured instantaneous H2 and CH4 concentrations, the derivative of the total weight loss curve obtained from TGA experiments (total instantaneous weight loss) as well as the instantaneous concentrations of condensable gas for anode 1 calculated from the difference. It can be seen from this figure that the condensable gas release starts around 250 ºC and its concentration increases rapidly reaching a maximum value around 550 ºC. Then, it starts decreasing and becomes negligible after 700 ºC. H2 starts evolving around 300 ºC and reaches a maximum around 550 ºC and decreases to negligible levels when 700 ºC is reached. The rate of production of H2 is nearly constant up to a temperature between 500 ºC and 600 ºC. After 700 ºC, there is a marked drop in H2 production. CH4 release starts around 300 ºC and reaches a maximum at around 500 ºC. The rate of production of CH4 is constant between 475 ºC and 525 ºC. Then, the amount of CH4 released gradually reduces towards 700 ºC. Experiments with other anodes showed similar tendencies with slight differences. This is explained below.
Figure 4. Instantaneous concentrations for anode 1
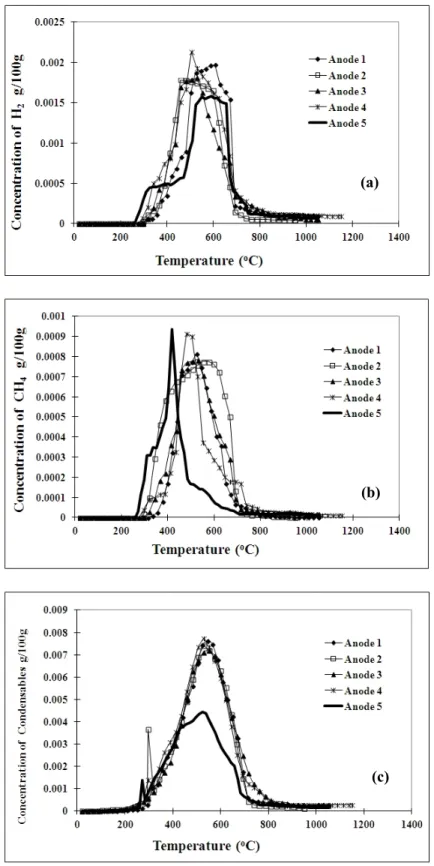
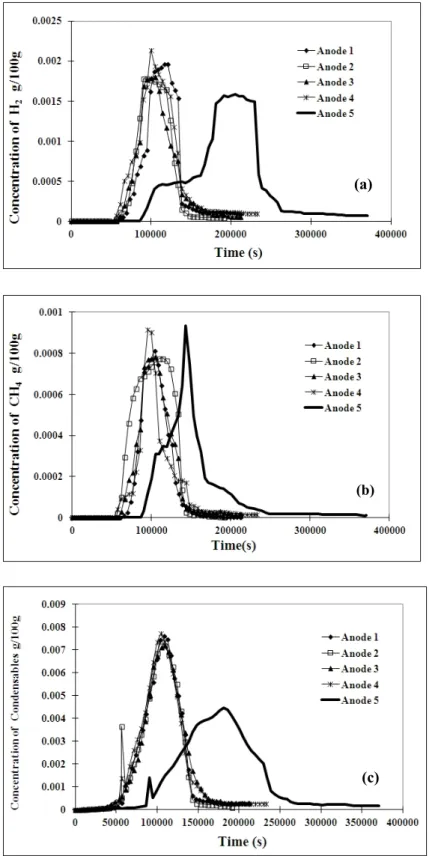
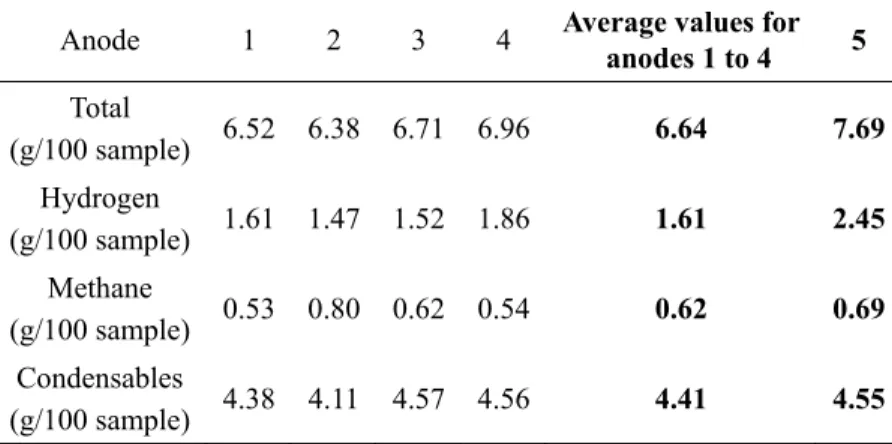
Figures 5(a), (b), and (c) compare the amounts of H2, CH4, and condensable gas released, respectively, with respect to time under different baking conditions (anodes 1 to 5). For anodes 1 to 4, the heating rate is the same, and it is evident from this figure that a similar tendency of H2 evolution is obtained. The slight differences are due to different maximum temperatures and soaking times used as wells the non homogeneous nature of anode samples. However, when a lower heating rate was used (anode 5) for the baking, H2 started forming at a faster rate at lower temperatures compared to the other anodes. Two constant-rate H2 formation zones were observed (Figure 5(a)). Similarly, it can be noted that the character of CH4 evolution for anodes 1 to 4 is different from that of anode 5 (Figure 5b). When low heating rate was used, CH4 started to evolve at lower temperatures. It could also be seen that the rate of formation of CH4 for this anode suddenly dropped and decreased faster compared to the other anodes. Since the heating rate is the same for anodes 1 to 4, the variations in other baking conditions (temperature and soaking rate) seem to affect the methane evolution slightly. Concerning the condensable gas, the shape and the position of the peaks (around 550 ºC) for all the anodes tested are similar. However, the peak height seems to be shorter when a lower heating rate is used (anode 5) compared to those obtained for anodes 1 to 4. Table 3 gives the total amounts of volatile components released under different baking conditions. This table shows that the H2 release is more when the heating rate is slower. However, there is not much difference in condensable gas content when the heating rate is decreased. This seems to be in conflict with the results given in Figure 5 which shows the data with respect to temperature. The reason is the way the data are presented. The comparison can be done on temperature basis as long as the same heating rate is used. When the heating rate is different, the different time scales should be taken in to account. Figure 6 presents the same data with respect to time. It can be clearly seen from this figure that the release of all the volatiles (Figures 6(a), 6(b), and 6(c)) for anode 5 is shifted to later times since a given temperature is reached later for this case. The area of the peak for condensable gas of anode 5 is similar to the others; although the peak height is shorter, the peak width is larger.
Figure 5. Comparison of (a) H2, (b) CH4, and (c) condensable gas concentrations for five anodes with respect to temperature
(a)
(c) (b)
Figure 6. Comparison of (a) H2, (b) CH4 and (c) condensable gas concentrations for five anodes with
respect to time
(a)
(b)
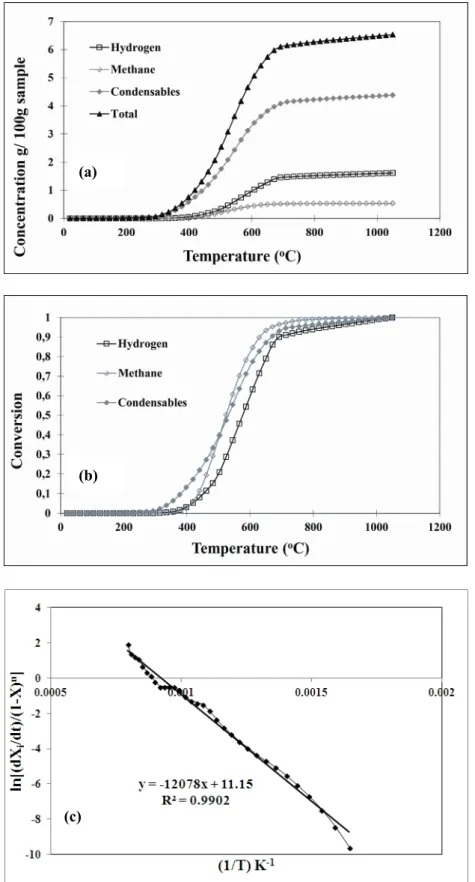
Figure 7. (a) cumulative concentrations and (b) conversions for hydrogen, methane and condensables, and (c) determination of kinetic parameters of methane for anode 1
(a)
(c) (b)
Table 3. Total amount of volatile components released during baking of five anode
Anode 1 2 3 4 Average values for anodes 1 to 4 5
Total (g/100 sample) 6.52 6.38 6.71 6.96 6.64 7.69 Hydrogen (g/100 sample) 1.61 1.47 1.52 1.86 1.61 2.45 Methane (g/100 sample) 0.53 0.80 0.62 0.54 0.62 0.69 Condensables (g/100 sample) 4.38 4.11 4.57 4.56 4.41 4.55
The cumulative weight loss due to condensable gas, H2, and CH4 release obtained by integrating the instantaneous concentrations of the same components for anode 1 as well as their conversions are shown in Figures 7(a) and (b). Figure 7(c) gives an example for the determination of the kinetic constants. Table 4 summarizes the results of the kinetic analysis. As it can be seen from the weight loss data, the volatile release becomes negligible after 700 ºC for the anodes investigated during this study (Figure 7a). Therefore, the kinetic analysis was carried out only for the non-isothermal part (heating period) of the curve. It excludes the isothermal (soaking period) region. Although this analysis is empirical in nature, the rate expressions obtained can predict the emission of volatile gas components released during baking.
The differences between the baking conditions for anodes 1 to 4 are the maximum temperatures and the soaking times. Therefore, the kinetic parameters of the non-isothermal regions should be the same. This can also be seen from the table. An average is calculated for each component. As it can be seen, the values of the kinetic parameters decrease for H2, and CH4; however, those of the condensable gas increase when heating rate is decreased. It must be noted that the parameters are empirical. Although they are useful to calculate the amount of volatiles released for a particular anode, it is difficult to draw conclusions on their release mechanisms.
Table 4. Summary of kinetic analysis results
Anode Hydrogen Methane Condensable Gas
1 n=2.6 E=102545, k0,app =20452 R2=0.97 n=1.9 E=98014, k0,app =15200 R2=0.99 n=1.5 E=40930, k0,app =1.1 R2=0.96 2 n=2.1 E=95254, k0,app =12900 R2=0.98 n=1.8 E=91454, k0,app =8860 R2=0.94 n=1.3 E=38244, k0,app =0.84 R2=0.95 3 n=2.5 E=94854, k0,app =10900 R2=0.98 n=2.4 E=93084, k0,app =9650 R2=0.98 n=1.5 E=37563, k0,app =0.67 R2=0.96 4 n=2.9 E=92452, k0,app =7930 R2=0.97 n=2.6 E=95195, k0,app =13000 R2=0.98 n=1.7 E=41666, k0,app =1.6 R2=0.97
Average values for anodes 1 to 4 n=2.5 E=96276, k0,app=13046 n=2.2 E=94437, k0,app=24726 n=1.5 E=39600, k0,app=1.1 5
(Lower heating rate)
n=2.7 E=95021, ko,app =6570 R2=0.93 n=2.6 E=66500, ko,app =444 R2=0.96 n=1.7 E=47906, ko,app =4.36 R2=0.95
4. Conclusions
For the same maximum baking temperature, when the total baking time was increased (i.e. the heating rate is decreased), it was observed that there was improvement in baked anode properties for the samples studied.
o The air permeability decreased, and the percentage of CO2 and air reactivity residues increased. o However, the increase in total baking time means increased cost.
For the same total baking time, when the maximum baking temperature was increased, it was found that there was improvement in baked anode properties for the samples studied.
o The air permeability value decreased, and percentage of CO2 and air reactivity residues increased. o Although baking parameters affect the reactivity and permeability of anodes, it seems that they
influence the CO2 reactivity more than the air reactivity. o Permeability was affected most by the baking temperature.
It can be said that the best conditions for the baking were thus found to be the highest possible maximum baking temperature and increased baking time.
The hydrogen, methane, and tar could be utilized as a source of energy during baking by burning them in air within the flue of the anode baking furnace. Thus, the proper combustion of the volatiles can reduce the fuel consumption and the baking cost.
The thermogravimetric analyser is a useful tool for determining the kinetic parameters of the released volatile gas components. Although these parameters are empirical, they can be used to predict the amount of volatile gas components released at different steps of the anode baking process. Such information could help improve the conditions in the furnace for an efficient burning of volatiles.
Acknowledgements
This project was supported financially by NSERC, Guizhou Provincial Research Fund, and China Aluminum Cooperation (Chalco Guizhou branch). Technical support provided by CURAL (University of Quebec at Chicoutimi, Canada) and the School of Materials and Architectural Engineering (Guizhou Normal University (GNU), China) is greatly appreciated.
References
Aanvik, M., & Sorlie, M. (2000). Reactivity and texture of cokes doped with aluminum compounds. Light
Metals, 555-561.
Buttler, F. G. (1975). Studies on the Thermal Decomposition of Electrode Pitch. Thermal Analysis, 3, 567-76. Engvoll, M. A. (2002). Reactivity of Anode Raw Materials and Anodes for Production of Aluminium (Ph.D
thesis). Norwegian University of Science and Technology, Norway.
Engvoll, M. A., Øye, H. A., & Sørlie, M. (2002). Gas reactivity inside industrial anodes. Light Metals, 561-574. Hon, K., Edwards, L., Marino, J., &, Lubin, M. (2012). Improving the precision and productivity of green coke
volatile matter analysis. Light Metals, 1267-1272.
Houston, G. J., & Øye, H. A. (1999). Reactivity testing of anode carbon materials. Light Metals, 885-899.
Hume, S. M. (1999). Anode Reactivity-Influence of Raw Material Properties (2nd ed.). Sierre, Switzerland: R&D Carbon Ltd.
Keller, F. & P. O. Sulger, P. O. (2008). Anode Baking: Baking of Anodes for Aluminum Industry (pp. 185-195, 2nd ed.). Sierre, Switzerland: R & D Carbon Ltd.
Kocaefe, D., Charette, A., & Castonguay, L. (1995). Green coke pyrolysis: investigation of simultaneous changes in gas and solid phases. Fuel, 74(6), 791-799. http://dx.doi.org/10.1016/0016-2361(95)00022-W
Kocaefe, D., Charette, A., Ferland, J., Couderc, P., & Saint-Romain, J. L. (1990). Kinetic Study of Pyrolysis in Pitch Impregnated Electrodes. Can. J. Chem. Eng., 68, 988-996. http://dx.doi.org/10.1002/cjce.5450680614 Lai,Y., Li, J., Liu,Y., Li, Q., Yang, J., & Wang, X. (2001). The effect of aluminum containing additives on the
reactivity of pitch binder in CO2. Light Metals, 669-674.
Levenspiel, O. (1999). Chemical Reaction Engineering (3rd ed.). New York, NY: John Wiley & Sons Inc. Lhuissier, J., Bezamanifary, L., Gendre, M., & Chollier, M. J. (2009). Use of under-calcined coke for the
production of low reactivity anodes. Light Metals, 980-983.
Sima, L., Blanco, C., Santamarı́a, R., Granda, M., Slaghuis, H., & Menéndez, R. (2003). Relationship between chemical composition and pyrolysis behaviour of a medium temperature pitch (or Lurgi-gasifier pitch).
Fuel Processing Technology, 84(1-3), 63-67. http://dx.doi.org/10.1016/S0378-3820(03)00046-8
Tkac, M. (2007). Porosity Development in Composite Carbon Materials during Heat Treatment (Ph.D Thesis). Norwegian University of Science and Technology, Norway.
Tosta, M. R. J., & Inzunza, E. M. (2008). Structural evaluation of coke of petroleum and coal tar pitch for the elaboration of anodes in the industry of the aluminum. Light Metals, 887-892.
Tran, K. (2011). Influence of raw material properties and heat treatment temperature on the reactivity of carbon
anodes (Ph.D Thesis). The University of Queensland, Australia.
Tremblay F., & Charrette, A. (1988). Cinétique de dégagement des matières volatiles lors de la pyrolyse d’électrodes de carbone industrielles. Can. J. Chem. Eng., 66, 86-95. http://dx.doi.org/10.1002/cjce.5450660113
Wallouch, R. W., Murty, H. N., & Heintz, E. A. (1972). Pyrolysis of Coal Tar Pitch Binders. Carbon, 10, 729-35. http://dx.doi.org/10.1016/0008-6223(72)90080-2