Seasoned Equity Offerings by Small and Medium-Sized Enterprises
36
0
0
Texte intégral
(2) CIRANO Le CIRANO est un organisme sans but lucratif constitué en vertu de la Loi des compagnies du Québec. Le financement de son infrastructure et de ses activités de recherche provient des cotisations de ses organisations-membres, d’une subvention d’infrastructure du Ministère du Développement économique et régional et de la Recherche, de même que des subventions et mandats obtenus par ses équipes de recherche. CIRANO is a private non-profit organization incorporated under the Québec Companies Act. Its infrastructure and research activities are funded through fees paid by member organizations, an infrastructure grant from the Ministère du Développement économique et régional et de la Recherche, and grants and research mandates obtained by its research teams. Les partenaires du CIRANO Partenaire majeur Ministère du Développement économique, de l’Innovation et de l’Exportation Partenaires corporatifs Banque de développement du Canada Banque du Canada Banque Laurentienne du Canada Banque Nationale du Canada Banque Royale du Canada Banque Scotia Bell Canada BMO Groupe financier Caisse de dépôt et placement du Québec DMR Fédération des caisses Desjardins du Québec Gaz Métro Hydro-Québec Industrie Canada Investissements PSP Ministère des Finances du Québec Power Corporation du Canada Raymond Chabot Grant Thornton Rio Tinto State Street Global Advisors Transat A.T. Ville de Montréal Partenaires universitaires École Polytechnique de Montréal HEC Montréal McGill University Université Concordia Université de Montréal Université de Sherbrooke Université du Québec Université du Québec à Montréal Université Laval Le CIRANO collabore avec de nombreux centres et chaires de recherche universitaires dont on peut consulter la liste sur son site web. Les cahiers de la série scientifique (CS) visent à rendre accessibles des résultats de recherche effectuée au CIRANO afin de susciter échanges et commentaires. Ces cahiers sont écrits dans le style des publications scientifiques. Les idées et les opinions émises sont sous l’unique responsabilité des auteurs et ne représentent pas nécessairement les positions du CIRANO ou de ses partenaires. This paper presents research carried out at CIRANO and aims at encouraging discussion and comment. The observations and viewpoints expressed are the sole responsibility of the authors. They do not necessarily represent positions of CIRANO or its partners.. ISSN 1198-8177. Partenaire financier.
(3) Seasoned Equity Offerings by Small and Medium-Sized Enterprises * Cécile Carpentier†, Jean-François L’Her ‡, Jean-Marc Suret§. Résumé La plupart des analyses de la décision et des conditions de financement des petites entreprises portent sur des entités privées. Le risque et le rendement que ces entreprises représentent pour les investisseurs sont donc très mal connus. Ce papier tente de combler cette lacune en utilisant le contexte canadien, où les petites et moyennes entreprises (PMEs) sont autorisées à s’introduire en bourse. Nous analysons les financements par fonds propres levés par ces PMEs au cours de la dernière décennie. Ces émetteurs peuvent être considérés comme des entreprises de faible qualité présentant une piètre performance opérationnelle. Les dirigeants émettent des actions juste avant une forte diminution de la performance comptable et boursière. Les investisseurs individuels n’évaluent pas correctement les actions au moment de l’émission et subissent des rendements négatifs significatifs au cours des années postérieures. Ceci est particulièrement vrai pour les émetteurs contraints financièrement. Nous confirmons que le marché du financement externe des PMEs attire des « citrons », et que les investisseurs individuels ne peuvent pas investir de façon avisée dans les entreprises en développement. Conséquence probable d’un manque d’expérience et de rationalité des investisseurs individuels, le coût des fonds propres externes est anormalement bas pour les PMEs inscrites en bourse au Canada. Mots clés : décision de financement, financement par fonds propres, petites entreprises, coût des fonds propres, performance, contrainte financière. *. Jean-Marc Suret and Cécile Carpentier gratefully acknowledge financial support from the Social Sciences and Humanities Research Council of Canada (SSHRC) and from the Autorité des marchés financiers du Québec. The views expressed in this article are those of the authors, and do not necessarily reflect the positions of the Caisse de dépôt et placement du Québec or of the Autorité des marchés financiers du Québec. † Professor, Laval University and CIRANO Fellow, European Center for Corporate Control Studies, Faculty of Administrative Science, Pavilion Palasis-Prince, 2325 de la Terrasse, Laval University, Québec (Québec), Canada, G1V 0A6, phone: 418-656-2131 #6385, email: [email protected] ‡ Senior Vice-President, Research and Investment Policy Research Advising, Caisse de dépôt et placement du Québec, 1000, place Jean-Paul-Riopelle, Montreal, (Quebec) Canada, H2Z 2B3, phone : 514-847-2601, e-mail: [email protected] § Professor, Laval University and CIRANO Fellow, European Center for Corporate Control Studies, Faculty of Administrative Science, Pavilion Palasis-Prince, 2325 de la Terrasse, Laval University, Québec (Québec) Canada G1V 0A6, phone: 418-656-7134, email: [email protected].
(4) Abstract Most of the analyses of small firms’ decision to seek outside equity financing and the conditions thereof have concerned private firms. Knowledge of the risk and return of entrepreneurial ventures for outside investors is consequently limited. This paper attempts to fill this gap by examining the Canadian context, where small and medium-sized enterprises (SMEs) are allowed to list on a stock market. We analyze seasoned equity offerings launched by SMEs over the last decade. These public issuers can be considered low quality firms with poor operating performance. Managers issue equity before a large decrease in operating and stock market performance. Individual investors do not price the stocks correctly around the issue and incur significant negative returns in the years following the issue. This is particularly true for constrained issuers. We confirm that entrepreneurial outside equity attracts lemons, and that individual investors cannot invest wisely in emerging ventures. Probably as a consequence of individual investors’ lack of skill and rationality, the cost of outside equity financing of Canadian public SMEs is abnormally low.. Keywords: financing decision, equity offerings, small business, long-run performance, cost of equity, financial constrain Codes JEL : G14, G32, L26.
(5) 1 INTRODUCTION Accessing outside equity is a crucial problem for most high growth small firms (Chittenden et al. 1996; Becchetti and Trovato 2002). Several factors can exacerbate the difficulties smaller firms encounter when trying to obtain this form of permanent financing. First, firms seeking outside equity are likely to be of poor quality (Vanacker and Manigart 2008). As Cumming and Johan (2009, p. 39) affirm in the field of entrepreneurial finance: “common equity attracts lemons.” Second, small business finance is characterized by large information asymmetry, and managers have an incentive to exploit this asymmetry to sell overvalued equity. This creates the “promoter problem” (Mahoney 1995; Black 2001). These two arguments explain why only specialized investors can provide equity to emerging businesses, a situation that restrains the supply of outside equity and consequently increases its cost. Most of the analyses of small firms’ decision to seek outside equity financing and the conditions thereof have concerned private firms. The direct consequence is that the investors’ perspective has been largely ignored except in the few papers related to business angels (Mason and Harrison 2002), entrepreneurial equity (Moskowitz and Vissing-Jorgensen 2002) and the rate of return of venture capital investments (Cochrane 2005). As Denis (2004, p. 320) notes, knowledge of the risk and return of entrepreneurial ventures remains very limited. This paper attempts to fill this gap by examining the Canadian context, where small and medium-sized enterprises (SMEs) are allowed to list on a public venture market at a pre-revenue stage, with tiny assets and capitalization (Carpentier and Suret 2008; Carpentier et al. 2009). We analyze 958 equity offerings launched by public SMEs in Canada, from 1993 to 2003. These seasoned equity offerings (SEOs) follow the initial public offerings (IPOs) by several months or years. To our knowledge, our study is the first to analyze these SEOs issued by public SMEs.1 Not only has securities regulation limited the listing of SMEs in most countries, but after going public, few firms use external financing extensively (Carpenter and Petersen 2002; Ou and Haynes 2006). The observation of a large sample of SMEs that obtain outside equity financing provides a unique opportunity to study this decision. Our sample comprises public SMEs, which enables us to. 1. Brown et al. (2006 p. 203) study a sample of Australian SEOs including small issuers, but the mean total assets of the firms in their sample are $617.6 million and their study is not dedicated to SMEs exclusively.. 1.
(6) compile stock prices and returns and to estimate the investors’ performance in financing SMEs. This task is generally out of reach of researchers analyzing private SMEs. In addition, we provide a complete picture of several dimensions of equity issue by SMEs including firm characteristics, elements of managers’ decision process, investor rationality and their rate of return. Examining outside equity issues by small public companies allows us to perform more extensive tests of several important propositions formulated in the context of private companies. First, small business finance is characterized by great information asymmetry, which increases the cost of equity. According to the pecking order theory, these firms consequently prefer to finance their growth internally. In this context, outside equity becomes the choice of last resort, used by firms that cannot generate sufficient cash flows or obtain debt financing. The quality of small firms seeking outside equity should thus be low. Second, the timing hypothesis states that opportunistic managers exploit information asymmetry. They decide to issue equity when their stock is overvalued. We should therefore observe a stock price run-up before the announcement of the SEO. Third, investors may also be overoptimistic about the prospects of growth firms: available information about these small capitalization firms is scarce, and they are difficult to value. Further, individual investors are generally considered unable to correctly assess the value of small and emerging firms. We consequently predict poor stock market performance after the SEO. Fourth, this underperformance should be especially apparent for financially constrained firms, characterized by negative cash flows and few tangible assets. Individual investors should be overoptimistic about these issuers, which can provide huge returns in a very limited number of cases. We posit that the stock market performance is poorer for financially constrained SMEs than for other firms. In the next section, we discuss the theoretical background and state our propositions. We present the characteristics of the Canadian stock market and the data sources, and discuss the features of the issues and issuers in section three. We describe the methodology in section four. Section five summarizes our research findings. In section six, we explain the troubling results of this study. The last section reports our conclusions.. 2.
(7) 2 RESEARCH HYPOTHESES 2.1 The quality of outside equity seekers The quality of small business seeking for outside equity is likely to be poor for two reasons. The first is the financing preferences described by the Pecking Order Hypothesis, (POH), which states that outside equity is a financing choice of last resort. The second is the reluctance to reduce the private benefits of control by sharing this control. Empirical evidence generally confirms the poor quality of outside equity seekers. The POH assumes that information asymmetry creates a wedge between the cost of outside and inside sources of funds. Accordingly, the POH asserts that managers prefer to procure business financing internally. When outside financing is required, debt is preferred over equity because the effect of asymmetric information is lower on the cost of debt than the cost of equity. The direct implication of the POH is that outside equity will be a financing choice of last resort, used mainly by firms that cannot generate internal funds or obtain new debt. Given that the POH is based on information asymmetry, the firms with the greatest potential for asymmetric information, such as SMEs, will have the greatest incentive to follow the POH (Shyam-Sunder and Myers 1999). Several studies find that the POH fits the financing pattern of small businesses relatively well (Lopez-Gracia and Aybar-Arias 2000; Watson and Wilson 2002; Vanacker and Manigart 2008; Cosh et al. 2009).2 Cumming and Johan (2009 Part 2) summarize the theory and illustrate that in the area of entrepreneurial finance: “common equity attracts lemons” (p. 39). The wedge between the cost of internal and external equity is not, however, the sole reason that managers of small firms consider outside equity as a last resort choice. They are generally reluctant to share control (Cressy 1995; Berggren et al. 2000), because this generally induces a decrease in the private benefits of control.3 These benefits fall into two categories: pecuniary and non-pecuniary. The pecuniary benefits can be a managerial salary that is higher than the market rate or perks. According to Mueller (2004), the non-pecuniary benefits can outweigh the. 2. Lemmon and Zender (2009) provide a good review of the tests between the POH of financial structure and its challenger, the Static Tradeoff Theory. 3 Public firms’ managers should have already ceded control during the IPOs. In Canada, however, the majority of SMEs go public through a reverse merger (Carpentier et al. 2008). This backdoor listing method does not imply sharing control with the public. By comparison, all SEOs entail sharing of control.. 3.
(8) pecuniary ones, and include the prestige and social status that comes with ownership, the power to decide on the business strategy and independence from superiors. As Cressy (1995) argues, the desire for independence seems to be a very strong factor in the business startup decision. The author mentions that it has become apparent that most small firm owner-managers have either not considered sales of equity or are actively opposed to it (p. 291). Empirical evidence generally confirms that outside equity is a last resort choice. Based on the findings of the US National Survey of Small Business Finances, Ou and Haynes (2006) find that younger, lower quality firms are more likely to acquire additional internal equity capital than other firms. In their study of high-growth Belgium firms, Vanacker and Manigart (2008) obtain empirical evidence that “profitable businesses prefer to finance investments with retained earnings, even if they have unused debt capacity.” These authors argue that “external equity is particularly important for unprofitable businesses with high debt levels, limited cash flows, highrisk of failure or significant investments in intangible assets.” Lemmon and Zender (2009) observe that issuers of equity are smaller, more constrained, and less profitable than non-issuers. Based on the POH, the reluctance to share control and previous empirical results, our first proposition is as follows: Proposition 1: The quality of small public firms seeking outside equity is lower than the quality of similar firms that do not seek such financing. 2.2 Managers’ opportunistic behavior Even if the average quality of issuers is likely to be poor, the timing capacity of managers and the lack of investment skill among individual investors can explain why new issues are more likely to occur when the stock is overpriced. Managers must decide on the type of financing they want, and determine the best time to issue debt or equity. The market timing hypothesis, proposed by Loughran and Ritter (1995), states that stock offerings are motivated primarily by managers’ desire to take advantage of open financing windows to sell overvalued equity (DeAngelo et al. 2007). The operating performance peaks at the time of the equity issue, and the post-announcement stock-price decline reflects over extrapolation by investors of the pre-issue trend in operating performance. This implies that investors can be irrational and do not price issuers’ stocks accurately following the SEO 4.
(9) announcement. The timing proposition is a generally accepted explanation of the poor long-run stock performance following SEOs (Klein et al. 2002; DeAngelo et al. 2007), especially for smaller firms.4 The timing hypothesis predicts that opportunistic managers exploit information asymmetry. Because the asymmetry is larger for SMEs than for large firms, the opportunistic behavior of entrepreneurs can be more pronounced than that of their counterparts at large mature firms. Small business managers can be more prone to opportunistic behavior because of the specificities of their investors’ clientele. Individual investors5 involved in the financing of small firms can be considered less informed, skilled and rational than institutional investors involved in the financing of larger firms. The typical outside investors in new ventures are skilled venture capitalists and business angels, who are able to deal with the asymmetry and its consequences. When an SME launches an SEO, the stock buyers are predominantly individual investors. These investors are generally considered “noisy traders,” as opposed to informed (institutional) traders, mainly because they trade in suboptimal ways (De Bondt 1998). In addition to their lack of rationality, these investors lack the skill to correctly value a new venture (Fenn et al. 1996). They also lack the instruments that specialized intermediaries use to deal with the agency problem associated with asymmetry, such as screening tools, incentive contracts and convertible stocks. Indeed, previous analysis of entrepreneurial firms going public (Locke and Gupta 2008) indicates that returns on the portfolio of entrepreneurial companies are lower than those for other small companies and for the market overall. This implies that IPOs of entrepreneurial companies are overpriced. In the case of SEOs of large firms, the stock price run-up observed before the issue announcement is generally accepted as proof of managers’ timing capacity. Accordingly, our second proposition is:. 4. In the classic universe of the US studies, small firms are those listed on the NASDAQ; they hardly correspond to the conventional definition of SMEs. The Advisory Committee on Smaller Public Companies of the SEC (2006) defined a small cap company as a public company with equity capitalization of approximately US$128 million to US$787 million. Companies with a market capitalization lower than US$128 million are defined as microcap companies. 5 From 1980 to 1996, large institutional investors in the US showed increased demand for the stocks of large companies and decreased demand for those of small companies (Gompers and Metrick 2001). SMEs are generally not capitalized enough to attract institutional investors that invest in SMEs by providing funds to venture capital firms.. 5.
(10) Proposition 2: A significant abnormal positive return is observed before the announcement of equity offerings by SMEs listed on the stock market. 2.3 Investors’ long-run return According to the rational expectations hypothesis, the poor quality of issuers, their future underperformance and the possibility of opportunistic behavior by managers should be fully anticipated by investors. The equilibrium price observed at issue time should be low enough to ensure the investors a fair rate of return, and the post-issue abnormal return should be insignificant. There are two reasons that this situation is unlikely to prevail for SMEs. The first one is the large information asymmetry. The second is investors’ lack of skills and tools, mentioned in the previous section. The small business universe is characterized by strong information asymmetry for two main reasons. First, these firms are too small to attract the attention of financial analysts, financial publications or institutional investors. Consequently, secondary information is very scarce, and according to the proportionate approach to regulation, SME issuers are considered as venture issuers and submitted to smoother disclosure requirements than mature issuers (Sarra 2009). Second, most of the firms are in the development stage, and they do not report the basic data required to support an analysis, such as sales, earnings and cash-flows. Previous evidence related to the pricing of IPOs, private placements and SEOs by large firms indicates that investors are generally overoptimistic, especially about the group of smaller issuers. Chou et al. (2005) find that overoptimism about the prospects of issuing firms prevails only for high growth firms. Eckbo et al. (2000, p. 253) assert that SEO issuers’ underperformance is largely driven by relatively small stocks, i.e. NASDAQ issuers. Brav and Gompers (1997) argue that the underperformance is not an IPO effect, but a characteristic of small, low book-to-market (high-growth) firms. Chou et al. (2005) conclude that overall, investors may be overly optimistic about the prospects of growth firms. If this hypothesis is true, we should observe abnormally low market returns following the SEOs of entrepreneurial ventures. This leads to our third proposition: Proposition 3: Stock market performance following SEOs by small public firms is abnormally poor.. 6.
(11) 2.4 Long-run returns and financial constraints SEOs can occur in very different situations. Some firms have enough liquidity or cash flows to survive, while others are financially constrained. Financially constrained firms cannot generate sufficient funds to finance their growth, and cannot borrow because they do not own the tangible assets required by the lenders. They exhibit zero or negative cash-flows, and thus cannot assume debt repayment. These firms have no alternative but to issue equity. The reasons that such firms will provide lower returns to the investors than unconstrained firms are twofold. First, their quality should be lower; second, investors should be more irrational and overoptimistic when the issuers are financially constrained. For financially constrained firms, SEOs are clearly a last resort choice (Lemmon and Zender 2009). Such firms cannot borrow because their credit risk is huge and they cannot provide tangible assets to secure a loan. They do not generate internal funds. Indeed, Vanacker and Manigart (2008) report that high-growth companies with limited debt capacity are more likely to issue additional equity financing. They are also the least profitable firms, with a high probability of delisting. The classic assumption is that rational investors will attribute a very low price to such firms. The lemon discount applied to the price can compensate investors for the high risk of adverse selection such issues bear. If correctly priced, the stocks will provide investors with a fair rate of return. Two streams of research argue for irrational pricing of stocks of constrained firms. First, studies of IPO pricing evidence that firms with more negative earnings have higher valuations than firms with less negative earnings (Aggarwal et al. 2009). This result can be partially explained by the association between negative earnings and growth opportunities. A second stream of research, summarized by Green and Hwang (2009), indicates that investors price distressed stocks too high because they can be considered lottery stocks. The explanation provided by Barberis and Huang (2009) or Kumar (2009) is that in contrast to the prediction of a standard expected utility model, a positively skewed security can be overpriced. Positive skewness of the distribution of returns means that in a few cases, the shareholders can obtain very high rates of return even if, on average, the expected return is low. Barberis and Huang present their theory as a potential explanation for several seemingly unrelated financial phenomena, such as the low average return on IPOs and private equity. Kumar (2009) hypothesizes that compared with institutions, 7.
(12) individual investors exhibit stronger aggregate preference for lottery-type stocks. He defines lottery-type stocks as having the following characteristics: 1) high stock-specific or idiosyncratic volatility, 2) large idiosyncratic skewness and 3) low stock price. In a recent work, Green and Hwang (2009) show that IPOs with high expected skewness experience substantially greater negative abnormal returns over the following one to five years. They also observe more underpricing for this category of stocks and a greater shift from institutional investors to individuals on the first day of trading. They conclude that their findings are consistent with the notion that price pressure by skewness-preferring individual investors can be linked to the poor long-run performance of lottery stocks. We consider that a firm is financially constrained if it generates a loss and if its cash provision is not great enough to cover one year of operating expenses. Such firms have a high risk of failure, but, in rare cases, they can yield a very high rate of return, owing to very low initial prices. As proposition 2 states, individual investors cannot correctly value SMEs that issue new shares, especially heavily constrained firms whose shares are penny stocks. Investors can also be influenced by their preference for skewness. This leads to our fourth proposition: Proposition 4: Stock market performance following SEOs of small public firms that are financially constrained is poorer than the performance of similar but unconstrained firms. 3 DATA 3.1 The Canadian stock market The Canadian stock market includes a venture section, the TSX Venture exchange (TSXV), where SMEs are allowed to list at a very early stage of development (Carpentier et al. 2009). For a listing on Tier 2 of TSXV, a firm must meet the following conditions: stock price over CAN$ 0.15 and post-IPO net tangible assets and market capitalization higher than CAN$500,000. TSXV has no requirements for issuer profitability; it simply stipulates sufficient working capital for 12 months of operations. Firms that list on the Canadian market tend to be significantly smaller in size and capitalization, and are at an earlier developmental stage than those that list on the junior markets around the world (Carpentier and Suret 2008). Most of these firms can be considered SMEs according to the classic definitions.. 8.
(13) 3.2 Data sources, population and sample Through the Financial Post database, we identify 2,862 Canadian SEOs of primary shares or units that are neither funds nor trusts.6 Our data span the 1993-2003 period. We restrict the population to the subsample of SMEs, using the definition proposed by the European Union. The European Union proposes the following limits for medium-sized, small and microenterprises.7 The total balance sheet should not exceed €43 million, €10 million and €2 million, respectively, in 2003. By converting the first value to Canadian dollars using the exchange rate at the end of 2003, we get a maximum limit of CAN$70 million in 2003. We express this limit in current dollars, using the Canadian consumer price index. Each firm exceeding this limit, adjusted for inflation at the SEO time, is excluded from the sample. To obtain the accounting and stock price data of equity issuers, we match our sample of issues with the Datastream (market data) and Cancorp Financials databases (accounting data), using CUSIP and names. We analyze each case of missing data to track the various changes (in name, ticker or exchange) that might explain the unavailability of data around the issue date. This left us with 958 SMEs that launched SEOs between 1993 and 2003. The reasons for the delisting were determined using stock exchange and securities exchange commission bulletins, SEDAR (the Canadian equivalent of EDGAR in the US) and several news services (Factiva and Eureka) reports. The last reported returns have been adjusted based on the delisting reasons and data, using 0 as the terminal price if the company delisted because of financial problems, and using the acquisition price in the case of continuation after a merger or an acquisition. 3.3 Characteristics of issues and issuers Table 1 presents the main characteristics of SEOs according to several significant dimensions, estimated at the end of the fiscal year before the SEO, together with the data related to the issue.. 6. In the US, these issues are relatively rare corporate financing events, according to Eckbo et al. (2007 p.359). The authors report an average number of 552 SEOs per year during the 1993-2003 period. We estimate an average of 260 SEOs per year in Canada, a market whose size is generally considered to be one-tenth of the size of the US market. In Canada, SEOs are relatively more frequent events than in the US. 7 The definitions are on line at: http://ec.europa.eu/enterprise/enterprise_policy/sme_definition/index_en.htm. 9.
(14) Panel A shows that the mean and median total assets are CAN$21.49 million and CAN$9.45 million respectively. Most of the sample comprises small and microenterprises as defined by the European Union. In Canada, the SEOs are small financing operations, half of which involve gross proceeds of less than CAN$5 million. However, these issues represent a significant proportion of the shareholders’ equity, which make them very significant for Canadian issuers. The low debt level of the issuers can be traced to their industry. Panel B of Table 1 indicates that more than 57.41% of the issues are launched by resources or oil & gas firms, and 30.17% by high technology firms. Given that these companies are mainly involved in the natural resources and high technology sectors, they can hardly provide the guarantees required to obtain bank loans. The low level of profitability, illustrated by the negative median return on assets (ROA) and return on equity (ROE) can also explain why these firms have little debt in their financial structure. Carpentier et al. (2009 Table 1) report that, from 1986 to 2006, 48.14% of firms newly listed in Canada belong to the natural resources sectors. Sample characteristics are thus in line with the specific features of the Canadian market. We analyze the use of proceeds in Panel C.8 In our sample, the proportion of SEO gross proceeds devoted to new investment projects is 33.52%, and 24.54% of funds are devoted to exploration, which can be considered an equivalent to investment for natural resources firms. The bulk of the funds are for “corporate” use, including working capital, general corporate expenses, financing and marketing, in most issues. Our sample consists largely of unprofitable SMEs belonging to sectors characterized by considerable intangible assets, which are seeking external financing to cover short-term liquidity needs. **Insert Table 1 about here** Given that we distinguish constrained from unconstrained firms in the conceptual part (Proposition 4) and in the tests, we summarize the characteristics of the two subsamples in Table 2. We consider that a firm is financially constrained if it meets two conditions. First, the firm must not be profitable. Second, the firm must not have the cash required to cover one year of operating expenses. Although the limit of one year is arbitrary, it allows us to split the sample. 8. The use of the gross proceeds is provided by the Financial Post-database for approximately 33% of issues. We conducted an in-depth analysis of the prospectuses, notices and financial statements to fill the gaps. However, most of the information on the issues launched before the inception of SEDAR, in 1997, cannot be obtained, and the use of gross proceeds is not available for 12.42% of the issues.. 10.
(15) into two groups of similar size. We consider that a firm with more than one year of cash available has the time to plan a private or a public placement. This is not the case when the available cash represents a few months of operating expenses. We implicitly consider that constrained firms cannot borrow, because they cannot repay the loan or pay interest on it. Table 2 shows that constrained firms are smaller and less profitable than unconstrained firms. Indeed, both groups differ statistically on each of the dimensions considered at the 0.001 threshold. We observe only one exception when we use a test on medians for the debt level, for which the significance level is only 7%. For constrained issuers the median ROE is -63%, indicating that the annual loss represents at least 63% of shareholders’ equity for half of the subsample. Given that the cash represents a median of 2.57 months of operating expenses, these firms can be considered distressed. They issue penny stocks: the median price is CAN$0.90 compared with CAN$2.75 for unconstrained firms. **Insert Table 2 about here** 4 METHODOLOGY 4.1 Quality of issuers The quality of the issuers is estimated using accounting data. Classically, firm quality is measured at a given point in time, by comparison with firms with similar characteristics. This approach is incomplete for firms in the early stages of development, whose operating performance figures change rapidly. Accordingly, we assess the quality based on past, current and future performance. In good-quality firms, we expect to observe an increase in revenues, earnings and profitability ratios. Conversely, poor-quality firms should exhibit a decrease in these characteristics relative to comparable firms. We estimate sales, operating income before depreciation (OIBD), which is an estimation of cash-flows, and ROA for each firm. We use abnormal ROA to assess the quality of firms relative to firms with comparable sector and size characteristics. First, we purged the Canadian universe by omitting issuing firms for the three years surrounding the equity issue. From this sample, we estimated the median of the ratio for six groups of sizes (estimated by the book value of equity) and by sector (3 digits or 2 if the number of observations is lower than six). The abnormal performance of a firm is estimated by its raw return minus the median ratio of its size and sector matching group.. 11.
(16) 4.2 Abnormal returns of SEO issuers We estimate abnormal returns using the buy-and-hold abnormal return (BHAR) method, which provides the estimated return of investors involved in each offering. This empirical approach is the one most commonly used in analyses of IPOs (Boutron et al. 2007;Table 2) and SEOs (Eckbo et al. 2007;Table 18). It is also used to study the performance of small capitalization stocks (Gleason et al. 2006; Locke and Gupta 2008). The BHARs are estimated relative to returns of reference portfolios composed of companies of comparable size and book-to-market ratio. This method is required because SME returns cannot be compared with those of blue chip stocks that comprise the S&P/TSX indices or with the small cap index.9 To construct the reference portfolios, we extract Canadian firms’ book-equity from the accounting database and estimate the book-to-market ratios after matching the stock market and accounting databases. To construct the size control portfolio, all Canadian stocks are ranked each month according to their market capitalization, and three portfolios are formed. Independently, all Canadian stocks are also ranked according to their book-to-market ratios, and three portfolios are formed. The returns of the nine monthly rebalanced portfolios are calculated as the value-weighted average of the individual-firm monthly returns in each of the size/book-to-market intersections. Each issuer firm is then assigned a control portfolio based on its market capitalization and book-to-market ratio over the performance test period examined. BHAR is based on the calculation of the average abnormal return from a buy-and-hold strategy (. BHAR1 to q ) from the beginning of the post-announcement month (1) to the month q (36): BHAR 1 to q = ∑i =1 w i*,q BHAR i ,1 to q Nq. q. q. s =1. s =1. where BHAR i, 1 to q = ∏ (1 + Ri , s ) -∏ (1 + Rbi , s ). (2). Thus, BHARs measure the average multiyear returns from a strategy of investing in all issuing firms, and selling at the end of a particular holding period, versus a comparable strategy using a. 9. The S&P/TSX SmallCap Index considers only the firms not included in the main index, with a market capitalization in excess of CAN$100 million. The median market capitalization before the SEO in our sample is CAN$22.26 million.. 12.
(17) benchmark (Rbi). BHARs are similarly estimated for the [-12, -1] months before the announcement date. We estimate equally-weighted (EW) portfolio returns, where an equal weight is given to each firm, and value-weighted (VW) portfolio returns, where weights are proportional to the market capitalization, estimated 12 months before the announcement. We use both weighting schemes to override the problem induced by the distribution of market capitalizations: namely that the VW results could be influenced by a small subsample of larger companies. 5 RESULTS 5.1 The quality of outside equity seekers The proposition that issuers are, on average, low quality firms is tested using the change in operating performance indicators, for the years surrounding the announcement. We present the results in Table 3. To limit the effect of survival bias, this table presents only the data for a subsample of 513 firms for which we can collect sales, earnings and total assets from year -3 to year +2, where year 0 is the issuing year.10 We also report the results for the surviving firms at year +3. Panel A is devoted to sales. The proportion of firms that report no revenues decreases from 46.09% to 41.60% at the end of the fiscal year preceding the announcement. More than four out of every ten issuers report no revenues at year -1. These issuers generally operate in the resources or technology sectors. However, we observe a strong increase in the median revenues, from $25,000 at year -3 to $236,000 at year -1. This result confirms the tiny size of the public SME in our sample. The increase in revenues is also consistent with the idea that managers time the announcement with some positive event. In this case, for a proportion of about 60% of the sample, the positive event can be an increase in revenues. The median revenues continue to increase after the SEO, but the proportion of firms reporting revenues at year +3 is very close to the one reported in year 0. Firms without revenues at the announcement time generally do not report revenues three years later. Further, profitability does not follow the sale increase.. 10. Several firms delist in the years following the SEO: some delist following a merger, while others do so for negative reasons. The performance statistics for the whole sample reflect this reduction in the sample size. Even if we get the main accounting data, operating income before depreciation is not available in each case, explaining the small sample variation in Panel B. In some cases, we cannot estimate the ROA of comparable firms. This explains the small variation in the sample in Panel D.. 13.
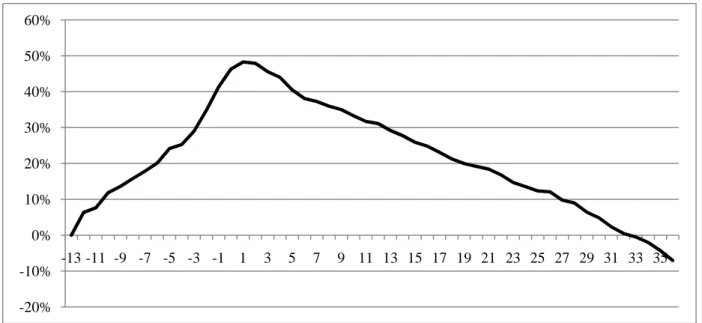
(18) In Panel B, we report the median OIBD and the proportion of negative values of this variable. The median OIBD is largely negative before the announcement. Reported values illustrate that most SME issuers are in the early stages of development, and can be considered entrepreneurial ventures. We note a decrease in the median OIBD from -$239,500 at year -3 to -$296,000 at year -1, and -$454,500 at year +3. Earning numbers are easier to interpret when expressed as ratios; we present the medians of the distributions of the raw ROA ratios (estimated after depreciation) in Panel C. This ratio increases from -18.78% to -14.56% before the issue, but it decreases sharply after the issue. As a negative ROA is not uncommon amongst emerging firms, we also provide the size- and industry-adjusted performance ratios in Panel D, together with statistical tests. Two features are worth noting. First, before the announcement, the issuers exhibit a lower ROA than their peers, but the difference is not significant at the conventional level except in year -2. Second, the relative performance decreases sharply after the issue, then becomes significantly poorer than that of similar companies. The relative ROA is low before the announcement, and declines sharply after the issue. For years 1 and 3, the median of size- and industry-adjusted ROAs differs significantly from 0, at the threshold level of 1%. The level of significance of the test is 5% at years 0 and 2, as it was at year -2. This indicates that performance of issuers is significantly poorer than the performance of comparable firms. The implication of this finding is twofold. First, despite equity injections, the relative operating performance is worse three years after the issue than in the year of the issue. This observation is consistent with the proposition that the quality of small public firms seeking outside equity is lower than the quality of similar firms that are not seeking such financing (Proposition 1). Second, the issue occurs just before a significant decrease in operating profitability and operating income. This is consistent with the proposition of opportunistic behavior by managers, who seek equity before a decrease in stock prices. **Insert Table 3 about here** 5.2 Managers’ opportunistic behavior We illustrate the results related to the second propositions in Figure 1 and summarize the results in Panel A of Table 4. Return patterns are based on monthly data, with 0 indicating the SEO. 14.
(19) announcement month. Figure 1 illustrates the return pattern surrounding the announcement of SEOs. We observe a sharp rally before the announcement. The abnormal return during the 12 months before the announcement is 41.33% or 40.82% depending on the weighting scheme used to form the portfolio (Panel A, Table 4). The significant abnormal positive return before the announcement of equity offerings by SMEs listed on the stock market is consistent with the timing proposition (Proposition 2), which indicates that managers attempt to issue stocks when their price is abnormally high. In the particular context of the unprofitable SMEs of our sample, two caveats are worth noting. First, as Lemmon and Zender (2009) assert, small, high growth firms should have less flexibility to time the market, simply because they need cash to continue their operations. We analyze this proposition in detail in Section 5.4, by splitting our sample according to the level of constraints or flexibility faced by the issuers. Second, the very poor operating performance that we observe before the announcement can hardly have triggered a significant market rally. The exact cause of this rally is enigmatic. We cannot rule out the possibility that the rally before the announcement is linked to the expectation of the offering. Even if securities regulations prevent the release of information before the SEO announcement, such an announcement can hardly be considered an unexpected event, and several observations point to leakage of information several months before the announcement: both the abnormal returns and abnormal trade volume are observed in the three months just before the announcement, when the issuing decisions have already been made. For constrained firms, the rumor of a financing round can be interpreted by investors both as the relaxation of the constraint and as an indication that outside investors have positive expectations regarding the firm. We have left the explanation of the rally before the SEO announcement by small and generally distressed firms for further research. **Insert Table 4 and Figure 1** 5.3 Investors’ long-run returns Investors’ perspective The abnormal return for the 36 months following the SEO is depicted in Figure 1, and we report values and statistical tests in Panel B of Table 4. We estimate average abnormal returns at -53.33% when each issuer receives an equal weight. The abnormal return over the three years 15.
(20) following the issue is -33.05% when the portfolio is VW.11 This indicates that larger issuers perform better, on average, than smaller issuers. This supports proposition 3, which states that investors cannot price the issuers’ shares correctly. Investing in SMEs that issue shares publicly thus exposes the investors to significant losses. The pattern of returns in Figure 1 indicates that the loss following the issue is higher than the gain observed before the issue. Overall, the passive shareholders that own the stock at month -12 and keeps it until month 36 obtain negative returns for the four years surrounding the SEO, on an equally-weighted basis. By comparison, new shareholders that invest in the SEO at time 0 are strongly negatively affected. They get a significant abnormal negative return during the three years following the issue. Firm managers’ perspective During the three years following the issue, the investors’ rate of return, adjusted for the return of similar non-issuing firms, is negative, and economically and statistically significant. In theory, the cost of capital is the rate of return required by the investors. When a large number of events are considered, the average of the ex-post return is equal to the expected return (Errunza and Miller 2000, p. 579), and it can be used as a proxy for the expected rate of return. Accordingly, the cost of equity of Canadian SMEs on the public market appears abnormally low. These firms were able to sell significantly overvalued stocks for a long period. This result contradicts the notion of rational investing. Canadian investors fail to adjust the stock price downward, to get a reasonable and positive rate of return. The lemon discount does not apply in our sample. Our result is not totally new. Moskowitz and Vissing-Jorgensen (2002) evidence that entrepreneurial equity does not provide a high enough return to adequately compensate for risk. As Hege et al. (2006) conclude, studies of the returns on private equity and venture capital show that private equity returns contain considerable systematic and idiosyncratic risk, and riskadjusted returns do not outperform public equity investments. The analysis of returns following. 11. A large body of literature is devoted to the estimation of long-run performance (see Eckbo et al, 2007, for a review); this is a complex problem we cannot address extensively here. We simply assess whether similar results are obtained when the calendar-time method with Fama-French risk factors is used. This is the case, but we present neither the methodology nor the results, to keep the article at a manageable length.. 16.
(21) IPOs, SEOs and private placements in the universe of large companies indicates negative abnormal returns for the groups comprising smaller firms. The preference for lottery stocks and skewness is a plausible explanation for this phenomenon. Investors do not consider the average returns of the category of stocks, but they are attracted by the high rate of return observed following a very limited number of issues. Accordingly, they overprice the shares of emerging and loss-making companies just as lottery tickets are overpriced compared with their expected returns. If this explanation is correct, one should observe a link between overpricing and the lottery characteristics of issued shares. 5.4 Stock price performance and constraint Figure 2 depicts the cumulative BHAR of issuers when the sample is split between constrained and unconstrained issuers. This figure illustrates the strong difference between the two groups. We report values and tests for the preannouncement period in Panel A of Table 5. We provide similar data for the post-announcement period in Panel B. The preannouncement rally is larger in the unconstrained group than in the constrained group: 57.77% compared with 25.30%. (Panel A of Table 5). Both abnormal returns differ from 0 at the 1% level. This statistically significant difference can probably be traced to the better operating performance we observe in the unconstrained group. The median ROE is close to 0 in this group but reaches -63% for the constrained firms. The preannouncement rally observed in the constrained group cannot be justified by operating performance. The sole plausible explanation is the leakage of information regarding the offering. The post-offering performance (Panel B) is worse for constrained firms (-67.88%) than for unconstrained firms (-38.07%) when an equal weight is given to each firm. The difference is statistically significant but it disappears when we use VW portfolios. This is due to the considerable influence of larger SMEs, whose post-issue performance is generally less dramatic than that of smaller issuers. These observations confirm proposition 4. Small constrained issuers exhibit worse post-issue performance than unconstrained issuers. They tend to be of lower quality than unconstrained issuers. The bottom line is that poor-quality, constrained and generally unprofitable SMEs can sell shares to the public at a price that far exceeds their true value. They benefit from an abnormally low cost of equity. Both at the operational and at the stock market. 17.
(22) levels, constrained issuers can be considered of lower quality than unconstrained issuers, in line with the propositions of Vanacker and Manigart (2008) and Lemmon and Zender (2009). **Insert Figure 2 and Table 5 about here** 6 EXPLANATIONS We evidence that most of the investors that buy new shares issued in SEOs by SMEs sustain, on average, huge abnormal negative returns. Our analysis covers a period of ten years, long enough to allow learning by rational investors. Accordingly, this situation raises important questions. First, is the abnormal return following SEOs specific to this category of issues? Second, why do investors fail to learn about this problem? Third, why do investors continue to purchase these SEOs? To answer to the first question, we analyze the abnormal returns of IPOs of similar size to our sample of SEOs, issued during the same period. We estimate the BHAR for the three years following the IPO, using the models described in section 4.2. We use the first market price as a starting point. Accordingly, our abnormal returns do not include the initial underpricing and they can be compared with post-SEO abnormal returns.12 We get an abnormal return of -55.99% on an equally-weighted basis, during the 36 months following the IPOs. The corresponding number is -54.55% when the returns are value-weighted. As expected, abnormal returns following IPOs of SMEs are lower than those observed after SEOs, but overall, investing in equity of public small businesses in Canada is a poor investment decision. Why investors fail to learn about this situation is thus an important question. One explanation can be the lack of empirical evidence about this market. Most previous studies of Canadian IPOs focus on the main segment of the market (TSX) and exclude the TSXV where SME can list. When both markets are considered, the use of value-weighted portfolios can hide the considerable underperformance of the smaller issuers. Data related to small issuers are not easily accessible, and most of the empirical work relative to these issuers has been published since 2006 or is forthcoming (Carpentier and Suret 2006; Carpentier and Suret 2008; Carpentier et al. 2009; Carpentier and Suret 2010). As Sarra (2009, p. 11) assesses, in Canada “There. 12. When we estimate the abnormal return following SEOs, we do not consider the discount attached to the new shares. The return is thus estimated from the point of view of existing shareholders.. 18.
(23) appears to be little data to support or negate the extent of risks unique to junior issuers.” Even if recent works partially fill this gap, to a large extent the abnormally low performance of listed SME was not documented during the years analyzed in this study. The lack of sufficient information to assess the true quality of issuers can also be a part of the explanation for investors’ interest in these stocks. In Canada, disclosure rules are similar to those prevailing in the US, and Canadian firms can list in this country using their Canadian filings. However, several elements of proportionate securities regulation have been implemented to ease the financing of junior issuers. Proportionate regulation “is the notion that securities regulation should recognize the different risks and benefits of issuers by their size, experience in the market, resources or capacity to act” (Sarra 2009, p. 12). There are two underlying premises for the implementation of proportionate regulation in Canada: 1) junior issuers often do not have the resources or employees to comply with the full range of disclosure and other regulatory requirements and 2) small or junior issuers pose a lower risk to the market, and should be subject to different or less onerous requirements. Proportionate requirements apply in two main areas of regulation: new listing, and disclosure. For many years, junior issuers have benefited from very low listing requirements, and from the Capital Pool Company program that allowed a firm to list without having to comply with the prospectus and registration requirements. It thus bypassed the conventional IPO process. More recently, junior issuers have been exempted from particular disclosure requirements like the annual information form, and the critical accounting estimates of the management’s discussion and analysis. These issuers now have more time to comply with periodic disclosure requirements and benefit from modified requirements in terms of details to disclose.13 The bottom line is that junior issuers are considered to pose lower risks than large issuers, and they are exempted from several disclosure requirements. This is a possible explanation for the incapacity of investors to correctly assess the value of the stocks issued by. 13. Venture issuers must file a business acquisition report if the size of the acquired business exceeds 40% of the size of the acquiring company (20% for non-ventures), and a venture issuer needs only to disclose one year of audited financial statements of the acquired firm. Non-venture issuers should disclose three years of financial statements. Venture issuers listed in British Columbia are not required to file such a report. Sarra (2009) provides an analysis of the treatment of junior issuers in Canada, and a list of the regulatory differences between venture and non-venture issuers can be consulted on the Canadian Securities Administrators website, at: http://www.gov.ns.ca/nssc/docs/cdbrochure.pdf.. 19.
(24) these firms. However, the costs and benefits of proportionate regulation remain an unexplored field of research. The last explanation for the observation that investors continue to contribute new financing to junior companies in Canada is the lack of rationality. The stocks issued by SMEs, and mainly by constrained firms, are penny stocks, with a median price around CAN$0.90. It seems that investors consider these shares to be similar to lottery tickets, and accept a negative average return because some of these shares can produce huge gains. Figure 3 depicts the frequency distributions of individual three-year BHAR, for constrained and unconstrained issuers. For both groups, we observe a large number of very negative (lower than -50%) and negative returns. The proportion of very negative returns is higher for constrained issuers (47.29%) than for unconstrained issuers (40.26%). At the other end of the distribution, we note a small number of very high returns, The proportions of abnormal returns over 100% (1000%) are 9.17% (0.63%) for constrained issuers and 8.23% (0%) for unconstrained issuers. Positive skewness is present in both subsamples, but seems slightly stronger for constrained issuers. In a limited number of cases, SEO issuers provide investors with exceptional returns. We study the right tail of the BHAR distribution. The maximum abnormal return we observe is 6,062% for three years. The second highest return is 2,300%: the stock price jumped from $0.50 to $12. The three higher returns (including the third at 1,921%) have been provided by firms in the area of mining and oil and gas exploration. The lucky investors who bought $100,000 worth of these stocks at the issue time held several million dollars in stock after three years. In addition, we observe eleven abnormal returns between 500% and 1,200%, and four between 300% and 500%. Mineral and oil and gas firms provide 13 of the 18 very high returns we analyzed, the five others come from high-tech firms. Such stocks are similar to winning lottery tickets. Indeed, the TSXV trumpets the success stories in its publications, indicating for example that several companies have exhibited huge annual returns reaching 6,100%, for the year 2006.14 The TSXV reports that two firms have generated returns in excess of 1,200%, seven exhibit returns ranging from 500 to. 14. See Take your business to the next level: Inside Success, TSXV brochure, on line at http://www.tmx.com/en/pdf/TSXVentureSuccessStories.pdf. Boosted by resources prices, the Venture market provides a total return of 33.5% in 2006. The index return for this market was -4.9% in 2007 and -71.9% in 2008.. 20.
(25) 100%, and 13 between 200 and 500%. Such information can reinforce the idea that venture stocks can easily provide huge gains, even if the picture offered to the investors is very partial. However, this situation can explain why investors with a preference for positive skewness continue to invest in this category of issues, even if the average expected return is negative. The three elements presented above are not exclusive. They can provide a partial explanation for the continuous involvement of individual investors in the equity offering of public SMEs. However, more research is needed; we presently cannot provide a fully satisfactory explanation for the phenomena that we evidence. **Insert Figure 3 about here** 7 CONCLUSION We analyzed public equity offerings by SMEs listed on a stock exchange. The firms in our sample are mainly in the development stage, and half of them are strongly financially constrained. Despite their poor operating conditions, they manage to carry out an equity offering. This observation hardly fits the classic argument of an equity gap. It can perhaps be traced to the exceptionally generous access Canadian exchanges offer emerging companies. However, the general observations we present in this paper are inconsistent with the hypothesis of investor rationality. We observe that issuers are of lower quality than non-issuers, when the quality is estimated by the post-issue operating results. The operating results of issuers decrease sharply after the issue, relative to those of comparable firms. This is consistent with opportunistic behavior by managers, who expect the decrease in performance. The return pattern observed before the announcement is also consistent with such opportunistic behavior. The issue is announced when the stock price reaches a summit. The reasons for the pre-issue rally, which cannot be attributed to positive operating results, are an open question we have left for further research. One important insight ensuing from our analysis is that individual investors appear unable to correctly assess the true value of the stocks issued by SMEs. They incur an abnormally low return in the three years following the issue. Further, the realized rate of return is lower for constrained issuers. This result is consistent with the proposition that the quality of constrained issuers is lower than that of unconstrained issuers. 21.
(26) Due to the high level of information asymmetry, small and high growth firms should incur a very high cost of equity. However, if optimistic and irrational investors price the stocks issued by these firms too high, as our results suggest, equity financing can be a low cost source of funds for small and high growth companies. Opening the stock exchanges to emerging companies can be a way to reduce their cost of equity, but it can also be damaging for individual investors, who appear overoptimistic and influenced by the positive skewness in the return distribution when they price the stocks of public SMEs that issue new shares.. 22.
(27) Table 1: Sample Characteristics of Seasoned Equity Offerings by Small and Medium-sized Enterprises Panel A: Sample characteristics Total assets year -1 Gross proceeds Proceeds-to-size Shareholders’ equity year -1 Market capitalization Debt to assets year -1 ROA year -1 ROE year -1 Issue Price Panel B: Industrial distribution Gross proceeds Number of issues Panel C: Use of gross proceeds Exploration Investment Corporate Not available. # 958 958 958 958 942 958 958 958 958. Mean 21.49 12.15 0.45 13.92 68.76 0.37 -0.28 -0.34 3.56. Median 9.45 5.00 0.21 5.72 22.26 0.29 -0.15 -0.20 1.45. Total 11,612.83 -. Res., % 23.40 32.25. Oil, % 21.81 25.16. HT, % 42.85 30.17. Other, % 11.94 12.42. # 342 158 339 119. #, % 40.76 18.83 40.41 -. TGP, $ 2,584.55 3,530.53 4,417.64 1,080.11. TGP, % 24.54 33.52 41.94 -. Panel A reports sample characteristics. The mean and median are based on the number of issues (#). Gross proceeds, total assets, shareholders’ equity and market capitalization are expressed in millions of Canadian dollars. Proceeds-to-size is equal to the gross proceeds divided by the pre-money market value of equity. Year -1 stands for the end of the year prior to the issue. Total assets, shareholders’ equity and debt ratios are estimated on a pre-money basis. Market capitalization is measured at the end of the month preceding the announcement of the SEO. ROA stands for return on assets (net income divided by total assets). ROE stands for return on equity (net income divided by shareholders’ equity). Issue price is expressed in Canadian dollars. Panel B reports the industrial distribution. Res., Oil, HT and Other are the percentages of the total gross proceeds (number of issues) by resources, oil and gas, high tech-biotech and other companies, respectively. Panel C reports the distribution of issues according to the use of gross proceeds. Total gross proceeds (TGP) are expressed in millions of Canadian dollars.. 23.
(28) Table 2: Sample Characteristics of Seasoned Equity Offerings by Small and Medium-sized Enterprises by Group of Constraints Unconstrained firms. Gross proceeds Proceeds-to-size Total assets year -1 Shareholders' equity year -1 Debt to assets year -1 ROA year -1 ROE year -1 Months to cash deplete year -1 Cash to assets year -1 Issue price. # 462 462 462 462 462 462 462 237 462 462. Mean Median 18.03 10.00 0.35 0.19 34.04 20.77 22.25 13.83 0.31 0.29 -0.06 -0.01 -0.07 -0.01 336.18 30.67 0.28 0.20 5.37 2.75. Constrained firms. # 480 480 480 480 480 480 480 480 480 480. Mean 6.82 0.52 10.12 6.37 0.42 -0.48 -0.60 3.71 0.19 1.85. mean median difference difference t test p value Median p value (sign rank) 2.50 <0.0001 <0.0001 0.25 <0.0001 <0.0001 3.64 <0.0001 <0.0001 2.43 <0.0001 <0.0001 0.28 <0.0001 0.0722 -0.39 <0.0001 <0.0001 -0.63 <0.0001 <0.0001 2.57 <0.0001 <0.0001 0.08 <0.0001 <0.0001 0.90 <0.0001 <0.0001. The mean and median are based on the number of issues (#). Gross proceeds, total assets and shareholders’ equity are expressed in millions of Canadian dollars. Proceeds-to-size is equal to the gross proceeds divided by the pre-money market value of equity. Year -1 stands for the end of the year prior to the issue (Total assets, shareholder equity and debt ratios are estimated on a pre-money basis). ROA stands for return on assets (net income divided by total assets). ROE stands for return on equity (net income divided by shareholders’ equity). Number of months to cash deplete is the cash, deposit and short-term investment in year -1 divided by the absolute value of EBITDA in year -1 and multiplied by 12. Cash to assets is the cash, deposit and short-term investment divided by total assets in year -1. Issue price is expressed in Canadian dollars. The final two columns test whether the difference between the mean (median) summary statistics of constrained and unconstrained firms is statistically significant.. 24.
(29) Table 3: Evolution of Operating Performance of Small and Medium-sized Issuers of Seasoned Equity Offerings Panel A Year -3 Year -2 Year -1 Year 0 Year 1 Year 2 Year 3 Panel B Year -3 Year -2 Year -1 Year 0 Year 1 Year 2 Year 3 Panel C Year -3 Year -2 Year -1 Year 0 Year 1 Year 2 Year 3 Panel D Year -3 Year -2 Year -1 Year 0 Year 1 Year 2 Year 3. Median Sales, K$ Percent with 0 sales, % 25.00 46.09 83.00 44.14 236.00 41.60 398.91 38.25 988.00 35.46 1768.00 36.06 1439.92 39.23 Median OIBD, K$ Percent with OIBD<=0, % -239.50 75.00 -247.00 74.09 -296.00 72.95 -453.00 71.68 -549.65 72.39 -444.74 70.81 -454.50 58.58 Median ROA, % -18.78 -21.08 -14.56 -11.85 -15.88 -16.47 -17.12 Median of size-industry-adjusted ROA, % -0.02 -2.32 ** -0.50 -1.79 ** -3.33 *** -1.74 ** -2.91 ***. # 513 513 513 513 513 513 481 428 467 499 505 507 507 478 513 513 513 513 513 513 481 509 510 511 511 500 501 464. The median is based on the number of issues (#). Year 0 stands for the fiscal year closed after the issue; year -1 is the fiscal year closed before the issue; Year 1 (2, 3) stands for the fiscal years closed one (2, 3) year after the issue year. Sales (Panel A) and operating income before depreciation (OIBD, Panel B) are expressed in millions of Canadian dollars. Number stands for the number of issues. Panel C reports the return on asset ratios (ROA). ROA is measured as the net income divided by total assets. Panel D reports the size- and industry-adjusted ROA and the p-Values from the Wilcoxon Signed-Rank test:* means significant at 10%, ** means significant at 5%, and *** means significant at 1%.. 25.
(30) Table 4: Buy-and-hold abnormal return (BHAR) of Seasoned Equity Offerings by Small and Medium-sized Enterprises Panel A: Whole sample, 12 months before the announcement EW EW, annual VW, % % % Return 41.33 41.33 40.82 Student's t 14.06 15.23 Panel B: Whole sample, 36 months after the announcement EW EW, annual VW % % % Return -53.33 -22.43 -33.05 Student's t -12.88 -9.39. VW, annual % 40.82. VW, annual % -12.52. The benchmark is a reference portfolio of companies of comparable size and book-to-market ratio. Panel A reports the returns for the whole sample, for the year prior to the issue. Panel B reports the returns for the whole sample for the 3 years after the issue. EW means equally-weighted. VW means value-weighted.. 26.
(31) Table 5: Buy-and-hold abnormal return (BHAR) of Seasoned Equity Offerings by Unconstrained and Constrained Small and Medium-sized Enterprises Panel A: By group of constraints, 12 months before the announcement EW EW, annual VW % % % Unconstrained issuers Return 57.77 57.77 52.52 Student's t 15.26 14.17 Constrained issuers Return 25.30 25.30 19.78 Student's t 5.80 5.26 p-value 0.00 Panel B: By group of constraints, 36 months after the announcement EW EW, annual VW % % % Unconstrained issuers Return -38.07 -14.76 -32.95 Student's t -7.30 -7.05 Constrained issuers Return -67.88 -31.52 -33.23 Student's t -10.79 -6.03 p-value 0.00. VW, annual % 52.52. 19.78. VW, annual % -12.47. -12.60. The benchmark is a reference portfolio of companies of comparable size and book-to-market ratio. Panel A reports the returns by group of constraints, for the year prior to the issue. Panel B reports the returns by group of constraints for the 3 years after the issue. EW means equally-weighted. VW means value-weighted. P-value means p-value of a test of difference between the returns of the two groups of constraints.. 27.
(32) Figure 1 Cumulative Buy-and-Hold Abnormal Return (BHAR) for the Whole Sample of Seasoned Equity Offerings by Small and Medium-sized Issuers. 60% 50% 40% 30% 20% 10% 0% -10%. -13 -11 -9 -7 -5 -3 -1 1. 3. 5. 7. 9 11 13 15 17 19 21 23 25 27 29 31 33 35. -20%. Figure 2 Cumulative Buy-and-Hold Abnormal Return (BHAR) of Seasoned Equity Offerings by Group of Constraints. 80% 60% 40% 20% 0% -13 -11 -9 -7 -5 -3 -1 1. 3. 5. 7. 9 11 13 15 17 19 21 23 25 27 29 31 33 35. -20% -40% unconstrained firms. constrained firms. 28.
(33) Figure 3 Distribution by Groups of Constraints of the Individual Buy-and-Hold Abnormal Returns (BHAR) 36 months after the Announcement of Seasoned Equity Offerings by Small and Medium-sized Enterprises 250 200 150 100 50 0. unconstrained. constrained firms. 29.
(34) REFERENCES Aggarwal, R. K., S. Bhagat and S. P. Rangan (2009). The Impact of Fundamentals on IPO Valuation. Financial Management 38(2): 253-284. Barberis, N. and M. Huang (2009). The Implications of Probability Weighting for Security Prices. American Economic Review Forthcoming. Becchetti, L. and G. Trovato (2002). The Determinants of Growth for Small and Medium Sized Firms : the Role of the Availability of External Finance. Small Business Economics 19(4): 291-306. Berggren, B., C. Olofsson and L. Silver (2000). Control Aversion and the Search for External Financing in Swedish SMEs. Small Business Economics 15(3): 233-242. Black, B. S. (2001). The Legal and Institutional Preconditions for Strong Securities Markets. UCLA Law Review 48: 781-858. Boutron, E., J. Gajewski, C. Gresse and F. Labégorre (2007). Are IPOs Still a Puzzle? A Survey of the Empirical Evidence from Europe. Finance 28(2): 5-41. Brav, A. and P. A. Gompers (1997). Myth or Reality? The Long-Run Performance of Initial Public Offerings: Evidence from Venture and Nonventure Capital Backed Companies. The Journal of Finance 52(5): 1791-1821. Brown, P., G. Gallery and O. Goei (2006). Does Market Misvaluation Help Explain Share Market Long-run Underperformance Following a Seasoned Equity Issue? Accounting and Finance 46(2): 191-219. Carpenter, R. E. and B. C. Petersen (2002). Capital Market Imperfections, High-Tech Investment, and New Equity Financing. The Economic Journal 112(477): F54-F72. Carpentier, C., D. J. Cumming and J.-M. Suret (2008). The Value of Capital Market Regulation and Certification: IPOs Versus Reverse Mergers. 3rd Annual Conference on Empirical Legal Studies Papers, Available at SSRN Carpentier, C., J.-F. L'Her and J.-M. Suret (2009). Stock Exchange Markets for New Ventures, Available at SSRN Journal of Business Venturing Forthcoming. Carpentier, C. and J.-M. Suret (2006). Bypassing the Financial Growth Cycle: Evidence from Capital Pool Companies. Journal of Business Venturing 21(1): 45-73. Carpentier, C. and J.-M. Suret (2008). The Economic Effects of Low Listing Requirements: An Analysis of Reverse Merger Listings. Working Paper Available at SSRN Carpentier, C. and J.-M. Suret (2008). The Survival and Success of Canadian Penny Stock IPOs. Small Business Economics Forthcoming Carpentier, C. and J.-M. Suret (2010). Private Placements by Small Public Entities: Canadian Experience. In Private Equity: Fund Types, Risks and Returns, and Regulation. D. Cumming ed, Wiley 129-152. Chittenden, F., G. Hall and P. Hutchinson (1996). Small Firm Growth, Access to Capital Markets and Financial Structure: Review of Issues and an Empirical Investigation. Small Business Economics 8(1): 59-67. 30.
(35) Chou, D.-W., M. Gombola and F.-Y. Liu (2005). The Long-Run Underperformance Following Private Placements of Equity: The Role of Growth Opportunities. Working Paper, FMA Meeting 2005 Cochrane, J. H. (2005). The Risk and Return of Venture Capital. Journal of Financial Economics 75(1): 3-52. Cosh, A., D. Cumming and A. Hughes (2009). Outside Entrepreneurial Capital. Economic Journal 119(540): 1494-1533. Cressy, R. (1995). Business Borrowing and Control: A Theory of Entrepreneurial Types. Small Business Economics 7(4): 291-300. Cumming, D. and S. Johan (2009). Venture Capital and Private Equity Contracting: An International Perspective. Burlington, Academic Press. De Bondt, W. F. M. (1998). A Portrait of the Individual Investor. European Economic Review 42(3-5): 831-844. DeAngelo, H., L. DeAngelo and R. Stulz (2007). Fundamentals, Market Timing, and Seasoned Equity Offerings. NBER Working Paper No. W13285 Denis, D. J. (2004). Entrepreneurial Finance: an Overview of the Issues and Evidence. Journal of Corporate Finance 10(2): 301-326. Eckbo, B., R. Masulis and O. Norli (2007). Security Offerings: A Survey. Handbook of Corporate Finance: Empirical Corporate Finance, Volume 1. B Eckbo (ed.), NorthHolland: 233-373. Eckbo, E., R. W. Masulis and O. Norli (2000). Seasoned Public Offerings: Resolution of the 'New Issues Puzzle'. Journal of Financial Economics 56(2): 251-291. Errunza, V. R. and D. P. Miller (2000). Market Segmentation and the Cost of Capital in International Equity Markets. Journal of Financial and Quantitative Analysis 35(4): 577600. Fenn, G.-W., N. Liang and S. Prowse (1996). The Economics of the Private Equity Market. Federal Reserve Bulletin January: 1-69. Gleason, K. C., R. Jain and L. Rosenthal (2006). Alternatives for Going Public: Evidence from Reverse Takeovers, Self-Underwritten IPOs, and Traditional IPOs. Working Paper, Available at SSRN. Gompers, P. A. and A. Metrick (2001). Institutional Investors and Equity Prices. Quarterly Journal of Economics 116(1): 229-259. Green, T. C. and B.-H. Hwang (2009). IPOs as Lotteries: Expected Skewness and First-Day Returns. Working Paper, Available at SSRN Hege, U., F. Palomino and A. Schwienbacher (2006). Venture Capital Performance in Europe and the United States: A Comparative Analysis. HEC Working Paper Klein, L. S., T. J. O'Brien and S. R. Peters (2002). Debt vs. Equity and Asymmetric Information: A Review. The Financial Review 37(3): 317-349. Kumar, A. (2009). Who Gambles in the Stock Market. The Journal of Finance Forthcoming 31.
Figure
Documents relatifs
Small and Medium Enterprises in developing countries (the case of Macedonia) lack on e-commerce implementation, specifically B2B e-commerce7. Senior managers don’t
Pre-IPO Dividend Payer is a company paying a cash dividend one year repectively three years prior up to the offering date, as reported in CRSP. Total
Abstract: We use a disequilibrium model to estimate credit rationing to Small and Medium- sized Enterprises on the Tunisian bank credit market.. Based on a panel dataset of 1,275 SMEs
20 See supra notes 6−7 and accompanying text (discussing briefly the impact of the 2005 Reforms on disclosure requirements of the securities laws).. did the SEC state how the
To illustrate this hypothesis, our paper analyses the existing case of an institutional initiative (the “Design Concept” contest) that aims to legitimize
Consequently, we analyze the generalized model with single and hybrid of degree informa- tion on the process of random walk in bipartite networks, and the effect of degree
This work focus on key issues for implementing the I4.0 solutions in SMEs by using a specific case example as a test bench of an Italian small manufacturing
We listed and tested the financial causes which can explain this positive reaction: the informational content of the operation, the decrease in the systematic risk, the
