SAFIR: A Simple API for Financial Information Requests
38
0
0
Texte intégral
(2) CIRANO Le CIRANO est un organisme sans but lucratif constitué en vertu de la Loi des compagnies du Québec. Le financement de son infrastructure et de ses activités de recherche provient des cotisations de ses organisationsmembres, d’une subvention d’infrastructure du ministère de la Recherche, de la Science et de la Technologie, de même que des subventions et mandats obtenus par ses équipes de recherche. CIRANO is a private non-profit organization incorporated under the Québec Companies Act. Its infrastructure and research activities are funded through fees paid by member organizations, an infrastructure grant from the Ministère de la Recherche, de la Science et de la Technologie, and grants and research mandates obtained by its research teams. Les organisations-partenaires / The Partner Organizations PARTENAIRE MAJEUR . Ministère des Finances, de l’Économie et de la Recherche [MFER] PARTENAIRES . Alcan inc. . Axa Canada . Banque du Canada . Banque Laurentienne du Canada . Banque Nationale du Canada . Banque Royale du Canada . Bell Canada . Bombardier . Bourse de Montréal . Développement des ressources humaines Canada [DRHC] . Fédération des caisses Desjardins du Québec . Gaz Métropolitain . Hydro-Québec . Industrie Canada . Pratt & Whitney Canada Inc. . Raymond Chabot Grant Thornton . Ville de Montréal . École Polytechnique de Montréal . HEC Montréal . Université Concordia . Université de Montréal . Université du Québec à Montréal . Université Laval . Université McGill ASSOCIÉ AU : . Institut de Finance Mathématique de Montréal (IFM2) . Laboratoires universitaires Bell Canada . Réseau de calcul et de modélisation mathématique [RCM2] . Réseau de centres d’excellence MITACS (Les mathématiques des technologies de l’information et des systèmes complexes). Les cahiers de la série scientifique (CS) visent à rendre accessibles des résultats de recherche effectuée au CIRANO afin de susciter échanges et commentaires. Ces cahiers sont écrits dans le style des publications scientifiques. Les idées et les opinions émises sont sous l’unique responsabilité des auteurs et ne représentent pas nécessairement les positions du CIRANO ou de ses partenaires. This paper presents research carried out at CIRANO and aims at encouraging discussion and comment. The observations and viewpoints expressed are the sole responsibility of the authors. They do not necessarily represent positions of CIRANO or its partners.. ISSN 1198-8177.
(3) SAFIR: A Simple API for Financial Information Requests Nicolas Chapados*. Résumé / Abstract. Nous décrivons une structure générale permettant de représenter de manière régulière et extensible toutes les données financières disponibles dans un laboratoire de recherche (présentement, le Laboratoire d'informatique des systèmes adaptatifs de l'Université de Montréal). Après une analyse de domaine, nous explicitons la représentation XML de l'information et introduisons une interface C++ permettant d'y accéder par un mécanisme de requêtes puissant. Nous décrivons en appendice une méthodologie permettant de retrouver les prix d'exercice (strikes) d'options depuis des bases de données contenant seulement des prix et les "ticker symbols"; cette méthodologie est robuste en présence de prix d'exercice irréguliers (qui ne correspondent pas aux tickers). Mots clés : Base de données financières, XML, DTD, C++, redécouverte de prix d'exercice d'options, prix d'exercice irréguliers.. We describe a general structure allowing to represent in a regular and extensible way all the financial data available in a research laboratory (at present, the Adaptive Computer Systems Laboratory of the Université de Montréal). After an analysis of field, we clarify the XML representation of information and introduce a C++ interface allowing to reach it by a powerful mechanism of requests. We describe in appendix a methodology allowing to find the option strike prices from databases containing only the prices and the ticker symbols; this methodology is robust in the presence of irregular strike prices (not corresponding to the tickers). Keywords: Financial database, XML, DTD, C++, option strike price discovery, irregular strike prices.. *. Département d’informatique et recherche opérationnelle, Université de Montréal, Montréal, Québec, Canada, H3C 3J7. Email: [email protected]..
(4) Contents Table of Contents. ii. 1. Introduction. 1. 2. Considerations and desiderata 2.1 Financial Quantities to be Represented . 2.2 Random Points to Note . . . . . . . . . . 2.3 Exploration of the Design Space . . . . . 2.3.1 Hierarchical Approach . . . . . . 2.3.2 Relational (Semi-Flat) Approach 2.3.3 Summing it up . . . . . . . . . .. . . . . . .. . . . . . .. . . . . . .. . . . . . .. . . . . . .. . . . . . .. . . . . . .. . . . . . .. . . . . . .. . . . . . .. . . . . . .. . . . . . .. 3 3 4 4 4 6 6. Meta-information: XML description 3.1 Illustrative Example . . . . . . . . . 3.2 Formal DTD Definitions (Annotated) 3.2.1 XML Jargon Demystified . . 3.2.2 Some Basic Definition . . . . 3.2.3 Document Elements . . . . . 3.2.4 Element: <option-class> . . 3.2.5 Element: <option-series> .. . . . . . . .. . . . . . . .. . . . . . . .. . . . . . . .. . . . . . . .. . . . . . . .. . . . . . . .. . . . . . . .. . . . . . . .. . . . . . . .. . . . . . . .. . . . . . . .. 7 7 10 10 11 15 19 20. Financial Database Access From C++ 4.1 Basic Access Code . . . . . . . . . . . . . . . 4.1.1 What is a SAFIR::TimeSeries Object? 4.1.2 Allowable Queries . . . . . . . . . . 4.2 Marginalization Across Time Series . . . . . 4.2.1 Marginalization Example . . . . . .. . . . . .. . . . . .. . . . . .. . . . . .. . . . . .. . . . . .. . . . . .. . . . . .. . . . . .. . . . . .. 23 23 24 25 25 26. 3. 4. 5. . . . . . . .. . . . . . . .. Future Work. A Recovering Option Strikes from the Ticker Symbol Alone. 29 31.
(5) 1 Introduction This document introduces the elements of a financial database—named SAFIR ∗ —which has been developed over the past year within the LISA † laboratory. The need for this piece of infrastructure arose clearly from our many-year practical work in applying statistical learning algorithms to problems in financial decision-making: in experimenting with several learning architectures, we have been finding ourselves constantly troubled by data management problems that seem endemic in finance. Some of these problems include:. ∗. Simple API for Financial Information Requests. †. Laboratoire d’informatique des systèmes adaptatifs, at University of Montréal.. Heterogeneous series types We have to deal with many different types of financial series data: stock quotes, option quotes, bond prices, interest rates, macroeconomic indicators, and so forth. These series are not all available at the same frequency (e.g. daily for stock prices, but quaterly for unemployment data). Heterogeneous data formats Some series are available in text form, others in binary; the column order varies from data source to data source, etc. Inconsistent preprocessing Some stock price series are dividend-adjusted‡ , others are split-adjusted§ , others still are both. The computation of the total security return differ in all cases. The key problem words here are heterogeneity and inconsistency of the available data. What we instead require is: Our Elementary Requirements We need a consistent and flexible interface for accessing financial data of all types for machine learning experiments, primarily within a C++ framework. In spite (or perhaps because) of the consistency requirement, the database must be sufficiently rich to express all the real-world subtleties found in observed data; in particular it must not suffer from the defect of imposing a fixed a priori structure with no room for extension, or of assuming an academic simplicity that bears no relationship to the messiness found in the wild. In addition, it must be suited to the specifics of financial data, which most often take the form of time series.. ‡. See p. 18.. §. See p. 18..
(6) 2. ∗. Extensible Markup Language.. These considerations led us to posit a data/meta-data representation for a major part of the database. The data elements are the time series themselves, i.e. physical observations (or even measurements) made at given time points about a specific financial quantity. The meta-data expresses all that is known about the financial process yielding the data, and its relationship to other relevant processes. More details about this separation of concerns are given in section 3. This document is organized as follows: we first review (section 2) a detailed list of desiderata that an ideal database architecture would satisfy, and examine the pro and cons of several candidate architectures. We next (section 3) describe the details of the XML∗ representation that was chosen to express the meta-data. We then (section 4) give an overview of the set of C++ classes that make SAFIR easy to access and suitable for learning algorithms experiments. We conclude (section 5) with a list of plausible future extensions. An appendix (p. 31) gives a solution to a nagging problem facing a customer of many third-party databases of option prices..
(7) Considerations and 2 desiderata This section makes an inventory of all the factors that must be accounted for in designing a repository for financial data. It is hoped that it should help the reader gain an appreciation for some design decisions, and the intrinsic tradeoffs that inevitably arise in the implementation of any such large system.. 2.1. F INANCIAL Q UANTITIES TO BE R EPRESENTED. To start with, SAFIR must represent quotes for several different markets, in more than one country: • options quotes • stock quotes • interest rates • government and corporate bonds, etc. • other products (interest rate derivatives, etc.) • macroeconomic indicators • commodities • foreign exchange • mutual funds Several of those series may be interlinked: for instance, options quotes do not make sense in isolation of corresponding stock quotes and a discount rate (risk-free). Moreover, the discount rate always exists in relation to a given country. In addition, we may want to represent news sources (i.e. dated plain text attachments) associated with each series, and more generally, each financial entity. This is necessary for enabling eventual text-mining applications and event-study analyses..
(8) 4. Important Remark It is necessary up front to make a distinction between quote and transactions data. Quote data record prices at which securities are theoretically available (with a separate "bid price" and "ask price"); transaction data, on the other hand, record actual prices at which real transactions have been made. It is necessary to preserve this distinction between those types of data across the database.. 2.2. R ANDOM P OINTS TO N OTE. • Some corporations may have more than one stock series, e.g. common stocks and preferred stocks; however, these are all related: they belong to the same “corporation”. • There may be multiple data sources for a single series, e.g. quotes from Reuters and Bloomberg.. ∗. For instance, the S&P500 index is “recomposed” every once in a while; so is the Dow Jones Industrials Average.. • The economy is not a static construction: public corporations are created, sold, merged, go bankrupt. To reflect this, stock indexes evolve with time.∗ The database must accomodate, and if necessary record, such structural evolution. • Stocks do split, and option strikes are re-adjusted after splits. For a stock, we may have three associated series: 1. The price series itself 2. The dividend series 3. The stock-split history. 2.3. E XPLORATION OF THE D ESIGN S PACE. There are two basic design options for expressing the sort of heterogeneous data requirements we seek to represent: the hierarchical approach, and the relational approach. Let us consider them in turn.. 2.3.1. Hierarchical Approach. This first method places each financial datum at a well-defined point in a tree of financial elements, organized hierarchically. For example, daily quotes for IBM common stocks would conceptually be located along the path Country = USA =⇒ Financial entity type = Public Corporation =⇒ Corporation Name = IBM.
(9) 5. =⇒ Series type = Common stock quotes =⇒ Frequency = Daily As would be expected, all information pertaining to IBM-USA branches out from a single point (e.g. option series, bonds, news sources) and organizes itself naturally. It is understoood that a higher level in the hierarchy contains an explicit list of the available items in the immediately lower levels. Transnational corporations, whose activities and series are likely to be fairly cointegrated, would need to be addressed more thoroughly than this scheme currently suggests; they are perhaps best handled through direct pointers across the individual (national) constituents. Related entities (for example the stock quotes associated with an options series) can either be located implicitly (from options to stock quotes, for example, we go up the hierarchy until we find the enclosing public corporation (or other financial entity), then down along the common stock path; or explicitly by having a direct pointer from the options resource (XML object) to the stocks resource. Advantages of the Hierarchical Approach • The method is scalable within the provisions allowed by the initial structure. It easily allows new kinds of series to be represented, as long as they can be inserted at a natural point in the hierarchy. • The method maintains an explicit directory of all the series associated with a specific financial entity. As such, it makes it easy for a human to visualize and understand the available data at a glance (more or less). Disadvantages of the Hierarchical Approach • All code written to a specific hierarchy becomes tied to that hierarchy, to a certain extent. Although it is desirable to minimize the coupling between the physical data representation and the code accessing it, an insufficient initial design increases the likelihood of an eventual representation breakdown. • All series have to insert themselves at exactly one point within the hierarchy. This can be alleviated by a judicious use of pointers. • The collection of, say, all options quotes related to U.S. corporations requires a complete traversal of the tree; resources by type are not immediately available through a direct (SQL-like) query..
(10) 6. 2.3.2. Relational (Semi-Flat) Approach. This second method assigns a unique identification string (“key”, or for our purposes, “ticker”) to every data item that is stored in the system. Data items of a specific type are stored together in a single table for that type. No explicit directory or hierarchy of resources is maintained, or need to be traversed; a datum’s type and unique key are necessary and sufficient to access it. Reference between data items are made strictly with the keys. Advantages of the Relational Approach • The individual data items become resilient to changes in the data organization, since there is no little or no organization to start with. A new type of data item simply results in the addition of a new table. Put differently, the meaning of pointers between data items are not dependent upon an a-priori hierarchy. • An odd series, one that does not easily fit within a specific a-priori hierarchy, can be easily accomodated, as long as its address is known. Disadvantages of the Relational Approach • The code accessing the data becomes tied to the database schema (the interrelations between the tables). The schema is hard to evolve beyond its initial design. • The contents of the database are hard to grasp at a glance, since there is no overall picture (decomposition) of the available data; the data related to a given financial entity is scattered across many tables. ∗. Database Management System.. • A traditional DBMS∗ is more suited than XML for the management of a relational database. The cost of a database infrastructure must be taken into account and justified.. 2.3.3. Summing it up. An objective of this database is to be easily modifiable by human hands, as well as by machine access. This requirement, which goes hand in hand with the choice of XML as a representation language, makes the choice of a relational approach an untenable proposition: the integrity of a relational database can hardly be guaranteed after a series of hand modifications that include changing several tables. In contrast, the hierarchical approach, albeit perhaps less “elegant” from a formal standpoint, appears more suited to the set of requirements that must be satisfied..
(11) Meta-information: XML 3 description This section explains the XML structure of the financial database behind SAFIR . Recall that XML is used as the storage medium for meta-information; it does not store that meat of the database—the actual time series—but only descriptions of those time series, and how different time series are interrelated.. 3.1. I LLUSTRATIVE E XAMPLE. We start by illustrating a simple case (see sidebar 3.1) of how XML is used to describe the meaning of various time series, along with the relationships between them. The Tags <?xml> and <!DOCTYPE> These tags serve, respectively, to mark the file as an XML document, and to associate a DTD∗ with the file. The contents of the finance.dtd file are detailed in section 3.2.. ∗. Document Type Description: a type of “formal grammar” for an XML file.. The <financial-data> Element Every XML document must be contained within a single “master” element,† which is called, for SAFIR, <financial-data>.. †. See section 3.2.1 for an explanation of this word and other associated XML jargon.. The <country> Element The financial information in SAFIR is organized hierarchically, starting with countries. In this example, we introduce a definition for the USA, which encloses all the financial entities found in that country. The globally unique identifier is us. We further specify the prevailing risk-free rate, as a reference to another series whose id is us-tbills. The name attribute gives the complete (free-form) text name, and the currency attribute specifies the currency code, for storing FX‡ information.. ‡. Foreign Exchange..
(12) 8. Sidebar 3.1. Example XML Meta-Information for SAFIR. <?xml version="1.0" ?> <!DOCTYPE financial-data SYSTEM "finance.dtd"> <financial-data> <!-- A country is defined by a currency and a risk-free interest rate --> <country id="us" name="United States of America" currency="usd" risk-free-rate="us-tbills"> <!-- US Government Information --> <financial-entity id="us-government" name="Government of the USA" type="government"> <bond id="us-tbills" name="US Government Treasury Bills" maturity="3 month"> <time-series series-type="bond yield" observation-type="quote" frequency="daily" column-format="&default-column-bond-daily-basic;" uri="file://usa/government/us_tbill_3m.amat" /> </bond> </financial-entity> <!-- Stock index SP500 --> <financial-entity name="Standard & Poors 500" type="stock-index"> <stock id="us-spx" ticker="spx" flavor="source:dialdata frequency:daily" dividend-adjusted="yes" split-adjusted="yes"> <time-series series-type="stock price" observation-type="quote" frequency="daily" column-format="&default-column-stockindex-daily;" uri="file://usa/stock-index/spx/index_daily.amat" /> </stock> </financial-entity> <!-- Public Corporation IBM --> <financial-entity id="us-ibm" name="International Business Machines" type="public-corporation"> <description> International Business Machines Corporation </description> <!-- IBM Series related to stocks --> <stock stock-type="common" id="us-ibm-stock" exchange="NYSE" ticker="IBM" flavor="source:dialdata frequency:daily" dividend-adjusted="no" split-adjusted="no"> <time-series series-type="stock price" observation-type="quote" frequency="daily" column-format="&default-column-stock-daily;" uri="file://usa/corporations/ibm/stock_daily.amat" /> </stock> </financial-entity> </country> </financial-data>.
(13) 9. Describing the Risk-Free Rate The risk-free rate for the USA is described by three nested elements:∗ 1. We start by introducing an element <financial-entity> (as a subelement within the USA <country>), with an attribute indicating the type government. This element houses all government-related information within the enclosing <country>.. ∗. Complete explanations for all the possible attributes within each element are given in section 3.2.3 and following.. 2. Within the <financial-entity>, we introduce a 3-month-maturity bond, whose globally-unique id is us-tbills. Recall that a reference to this id had already been made previously within the enclosing <country> element: such forward-references are completely permissible. This bond declaration serves as the risk-free rate for the country. 3. Finally, we use a <time-series> element to point to a physical data file containing the actual time series data. The element’s other attributes indicate the column meaning, and the general sampling conditions for the series. As explained below, the string &default-column-bond-daily-basic; is a shorhand way of representing a series having four columns: the date of the observation over three columns (YYYY MM DD), followed by the bond yield on that day. Since the <time-series> element does not itself contain any other sub-elements, we close it right away—as per the XML specification—by preceding the closing angle bracket by a single slash: <time-series ... />. Representing the S&P 500 Index Similarly to the above way of representing the risk-free rate for the USA, the S&P 500 index is described in a threefold sequence: 1. A <financial-entity> element is introduced, naming the index and declaring it to be of type stock-index. 2. Next, a <stock> element is declared, which encloses the price series for the index itself (as opposed to any options or futures on the index). This element specifies the additional following information through attributes: id The globally-unique id for this series is us-spx. For securities that have derivative products associated with them (like the S&P500), it is quite essential to specify an id for the stock price series, as it allows the derivative to directly refer to the underlying security, in this instance the stock-index price. ticker This is the standard stock-exchange ticker associated with the security..
(14) 10. flavor As explained in section 3.2.2, the flavor permits to track the source of a data series, and allows to distinguish between two otherwise-identical series. The flavor in the current example indicates that the data was obtained from the service Dialdata, and is sampled daily. *-adjusted Various adjustments that can be made to a series; see the explanation in section 3.2.3. 3. Finally, the <time-series> element records the pointer to the physical data file containing the time-series data. Options and other series associated with the S&P 500 would likewise be added under the same <financial-entity> (using, for instance, <option-class> elements). Representing a Public Corporation The mechanisms for representing a public corporation (in this example, IBM ) are very much the same as for the S&P 500 index. The only difference lies in the attributes given to the <financial-entity> element. The example also illustrates that a <financial-entity> can contain a free-form text <description>.. 3.2. F ORMAL DTD D EFINITIONS (A NNOTATED ). This section reviews the formal definition of a SAFIR XML database, by explaining the constructions allowed by the DTD file finance.dtd.. 3.2.1. XML Jargon Demystified. For readers that are not conversant with the subtleties of the XML standard, we give here some informal definitions that are useful for understanding the following descriptions. For further details, please refer to the official W3C Recommendation for the XML Specification, available at www.w3c.org/TR/REC-xml. Entity An XML entity is an abbreviation for a replacement string that is substituted in-place when the entity is referenced. In the DTD, entities are introduced by the <!ENTITY entity-name value > construct. They are referenced (and thereby expanded) in the XML file using the &entityname ; construct (the semi-colon is important!). They can be thought of as macros in the C programming language, but cannot be parameterized..
(15) 11. Element An XML element is a nesting construct taking the form <element > ...</element >. The opening element tag can specify a set of attributes (see below). Enclosed between the opening and closing tags can be included (properly nested) sub-elements, as well as unstructured text data (also called #PCDATA in XML-speak). In the DTD, elements are introduced by the <!ELEMENT ...> construct, which permits the specification of the allowable enclosed sub-elements Attribute An XML attribute is a parameter that can be specified when opening an element. It takes the form <element param="value" >, where param is the formal attribute name, and "value " is the user-supplied value for the attribute. In the DTD, attributes associated with a given element are introduced with theATTLIST elem-name attr-list construct, which, for each attributes, specifies the set of allowable values, and whether the attribute is i) required (#REQUIRED), or ii) optional with no default value (#IMPLIED), or iii) optional with provided default value (default value specified between double quotes). Attribute Type CDATA An attribute with this type can have any character data as values (no format restriction).∗ Attribute Type NMTOKENS An attribute with this type can have values that are white-space-separated lists of tokens. For practical purposes, a token can contain letters, digits, dashes, and colons (plus a small set of other characters). Attribute Type ID and IDREF An attribute with type ID (see p. 12 for the practical implications within SAFIR) declares a globally-unique identification character string within the XML file. An attribute with type IDREF refers to a declared element having the specified ID attribute (forward references are allowed).. 3.2.2 Some Basic Definition The following DTD definitions specify entities that can act as shortcuts when writing the XML file.. Entities for Characters and Symbols (lifted from XML spec) <!ENTITY <!ENTITY <!ENTITY <!ENTITY <!ENTITY <!ENTITY <!ENTITY <!ENTITY <!ENTITY. lt gt amp apos quot nbsp mdash ldquo rdquo. "&#60;"> ">"> "&#38;"> "'"> """> " "> "&#x2014;"> "&#x201C;"> "&#x201D;">. ∗. However, in XML, attribute values must always be enclosed in double quotes..
(16) 12. These entities are usually standard for most XML files (and HTML files too), and their definitions is extracted directly from the XML specification.. Entities for Common (Parameter) Attributes <!-- id attribute: Provide a means to uniquely identify an element in --> <!-- order to refer to it later --> <!ENTITY % id.att ’id ID #IMPLIED’> <!-- common attributes: attributes that all entities support --> <!ENTITY % common.att ’%id.att;’> <!-- flavor attribute: Permits specification of identifying features --> <!-- in order to distinguish two otherwise-identical series --> <!ENTITY % flavor.att ’flavor NMTOKENS #IMPLIED’>. Entity: id.att ∗. “Globally” means across the SAFIR XML database.. This specifies an id attribute that can be specified for all SAFIR elements. This attribute specifies a globally unique character string∗ that can be used as a target for object references. In other words, if you need to refer to a given XML element from somewhere else, mark this element with a unique id attribute. Entity: common.att This specifies the attributes that are common to all moment, this is restricted to the id attribute.. SAFIR. elements; at the. Entity: flavor.att. †. With the default flavor being, of course, vanilla. ‡. In keeping with the American domination of the world, we shall use the American spelling of the word.. This specifies a flavor attribute that can be added to time-series elements. A flavor permits to track the source of a data series, and allows the distinction to be made between two otherwise-identical series. For example, suppose that we have intraday data for a stock over a certain period, and daily data for the same stock, over a much longer range. Both of those series are, indeed, “stock data” for the company, and yet both need to be kept separate since they do not obey any strict inclusion relationship. The same can be said, for instance, of transaction data versus quote data for a given security, or multiple data providers. Each of those variations is termed a flavor.† Flavors are entirely specified with a flavor="xxx" attribute that can be added to stock, bond, and option class elements (see below).‡§ We are not, for now, going to impose any definite structure on the flavors (except they §. Especially astute readers may recall that “Flavors” was the name of an early object system for Lisp, where a class was named a flavor, the mother class of all was named Vanilla, and every flavor was ultimately a subclass of Vanilla..
(17) 13. are XML NMTOKENS); we consider them simply as character strings, and a naïve string comparison serves to establish the identity of two flavors. Note that it is not the purpose of a flavor to make substantive change about the identity of a series. For instance, the maturity of a bond has no business being specified with a flavor. The sole purpose of the flavor is to record, in a sense, the experimental conditions that led to the particular time series being recorded, for a given financial quantity. Entities for Common Document-Level Specifications <!-- Default stock index daily column format --> <!ENTITY default-column-stockindex-daily "year month day open:level high:level low:level close:level"> <!-- Default common stock daily column format --> <!ENTITY default-column-stock-daily "year month day open:level high:level low:level close:level volume:level"> <!-- Default daily bond column format (basic form) --> <!ENTITY default-column-bond-daily-basic "year month day yield:return"> <!-- Default option series column format (implied form) --> <!ENTITY default-column-option-daily-implicit "year month day open:level high:level low:level close:level volume:level open-interest:level"> <!-- Default option series column format for Yahoo! Intraday data --> <!ENTITY default-column-option-intraday-yahoo "year month day hour minute second last-price:level bid:level ask:level volume:level open-interest:level"> <!-- Default BAX transaction data column format --> <!ENTITY default-column-baxhq-transaction "year month day hour minute second last-price:level volume:level"> <!-- Default exchange rate data column intraday format --> <!ENTITY default-column-fx-intraday "year month day hour minute second fx:level"> <!-- Default exchange rate data column daily format --> <!ENTITY default-column-fx-daily "year month day close:level"> <!-- Short-term (12-month) term structure of interest rates/ intraday --> <!ENTITY default-column-term-structure-short-intraday "year month day hour minute second one-month:level two-month:level three-month:level six-month:level twelve-month:level"> <!-- Short-term (12-month) term structure of interest rates/ daily --> <!ENTITY default-column-term-structure-short-daily "year month day one-month:level two-month:level three-month:level six-month:level twelve-month:level">. These entities declare abbreviations for standard column format description in time series elements. Time series always start with three columns representing the date of the observation (YYYY MM DD). Intraday time series follow with three additional columns representing the time of the observation (HH MM SS)..
(18) 14. Other columns are listed by their names, which can be an arbitrary sequence of letters and digits separated by spaces (respecting the NMTOKEN of XML). Following the name is an optional sequence of modifiers, separated by colons, that qualifies the contents. The first kind of modifier gives an indication of the rough data type, which can be either a level (e.g. a stock price), or a return. The return, by default, is computed as a simple return with respect to the level at the previous time-step: rt = ∗. Specified as attributes for the stock series data, for instance.. pt − pt−1 . pt−1. Depending on the enclosing context,∗ it is sometimes assumed that the return is adjusted to account for stock splits and dividend distributions (i.e. the return is given as a total return, and not solely based on price computation.) The standard column headings are: year observation year (integer YYYY) month observation month (integer 1 to 12) day observation day (integer 1 to 31) hour observation hour (integer 0 to 23) minute observation minute (integer 0 to 59). †. Permitting leap seconds, if necessary.. second observation second (integer 0 to 61† ) yield:return annualized yield on bond open:level opening price for a daily series (usually a bid quote) high:level maximum price for a daily series (usually an ask quote) low:level minimum price for a daily series (usually a bid quote) close:level closing price for a daily series (usually a bid quote) volume:level transactions volume during the whole day for daily data, or up to the present time for intraday data open-interest:level for options and futures data series, the number of active contracts (at the end of the day for daily data, or up to the present time for intraday data) bid:level instantaneous bid price for intraday series ask:level instantaneous ask price for intraday series.
(19) 15. 3.2.3. Document Elements. The following DTD definitions specify the various elements making up the core of a SAFIR XML database.. High-Level Elements <!-- financial-data: this is the root of the XML document --> <!-- No attributes --> <!ELEMENT financial-data ( country | exchange-rate )* > <!-- country: information specific to within a given country --> <!ELEMENT country (financial-entity)*> <!ATTLIST country %common.att; name CDATA #REQUIRED currency NMTOKEN #REQUIRED risk-free-rate IDREF #REQUIRED> <!-- exchange rate: specifies exchange-rate information between countries --> <!-- How much of currency 2 do we need to buy 1 unit of currency 1 --> <!ELEMENT exchange-rate (time-series)> <!ATTLIST exchange-rate %common.att; %flavor.att; ticker CDATA #IMPLIED exchange CDATA currency1 NMTOKEN #REQUIRED currency2 NMTOKEN #REQUIRED> <!-- financial-entity: a source of financial innovations --> <!-- ‘‘innovations’’ taken in the sense of Wold (1941) --> <!ELEMENT financial-entity ( description | stock | bond | option-class )* > <!ATTLIST financial-entity %common.att; name CDATA #REQUIRED type ( public-corporation | stock-index | government ) #REQUIRED> <!-- description: describes the contents of something (!) --> <!ELEMENT description (#PCDATA)>. Element: <financial-data> This is the “master” element englobing the entire SAFIR XML database. It currently defines no attributes. It can contain zero or more instances of <country> or <exchange-rate> elements. Element: <country> A country houses all the information pertaining to a given country. It can contain zero or more instances of <financial-entity> elements. In addi-.
(20) 16. tion to the common attributes, the allowable attributes are: name The free-form text name of the country. currency An XML token identifying the currency code for that country. A country cannot have more than one currency∗ , but several countries may share the same currency. risk-free-rate An XML id pointing to the bond series representing the riskfree rate for that country.. Element: <exchange-rate> An exchange-rate element contains exchange rate data between two currencies within an enclosed <time-series> element. The interpretation is “how many units of currency2 do we need to buy one unit of currency1”. Both currencies are specified as strings in their respective attributes; the same currency codes should be used within the <country> elements. In addition to currency1 and currency2, the other allowable attributes are: name The free-form text name for the exchange-rate. flavor Flavor information. exchange Optional name of the exchange where the series is traded ticker Optional ticker under which the series is traded on the exchange. Element: <financial-entity> A finantial entity represents a source of financial innovations within a given country. It can specify, in any order, zero or more instances of the following elements: <description>, <stock>, <bond>, <option-class>. In addition to the common attributes, the allowable attributes are: name The free-form text name for the financial entity.. †. Future revisions will allow the specification of commodities and other such products.. type The type of the financial entity, currently restricted to "public-corporation", "stock-index", "government"; the meanings are intended to be selfexplanatory.† ∗. This might have to be revisited in the future, as this design does not handle two cases: i) a country changing its currency, e.g. EU countries adopting the Euro, and ii) countries involved with more than one currency, e.g. Argentina..
(21) 17. Element: <description> A free-form text description of a financial entity. It can contain as much text as deemed necessary, and must be closed by a proper </description> tag. Stocks and Bonds <!-- stock: a list of series enclosing stock price data --> <!ELEMENT stock (time-series)+> <!ATTLIST stock %common.att; %flavor.att; stock-type ( common | privileged | other) "other" name CDATA #IMPLIED dividend-adjusted (yes|no) "no" split-adjusted (yes|no) "no" exchange CDATA #IMPLIED ticker CDATA #IMPLIED> <!-- bond: encloses a time series giving bond price/yield information --> <!ELEMENT bond (time-series)> <!ATTLIST bond %common.att; %flavor.att; name CDATA #IMPLIED maturity CDATA #IMPLIED>. Element: <stock> A stock houses information for stock-price-like series, like common stocks, stock indexes, and mutual funds. It must contain one or more <time-series> elements, each with specific meaning: • A first series contains the stock price series itself. Depending on the attributes given to the <stock> element, the price series may represent raw prices (interpreted with respect to the currency in the enclosing country), or split- and/or dividend-adjusted prices (see below for an explanation). • A second series contains the history of dividends paid by the stock (i.e. the amount paid on each dividend-due date); at the moment, the system does not allow the specification of the dates at which the dividends become known (as opposed to paid). • A third series contains the stock-split history. The following attributes may be specified for <stock>, in addition to an id and a flavor: stock-type is either "common" (for common stocks with full voting rights), "privileged" (for stocks that have usually no voting rights but receive preferred dividends), or "other" (the default; when the type is unknown or unspecified)..
(22) 18. name is a free-form name for the stock. (Optional with no default value.) dividend-adjusted is either "yes" or "no" (the default). With value "no", the stock price series is interpreted as the series of raw prices that are traded on the stock exchange. With value "yes", the price series has undergone a dividend correction: Elementary finance theory indicates that, on the day that a dividend is paid, the price of a stock undergoes a jump down by the magnitude of the paid dividend. Hence, both the price history and the dividend history are necessary to compute the total return brought forth by a stock. In a dividend-corrected series, the stock prices are retroactively adjusted to the level they would have, had the dividend not been paid; in other words, the effect of the paid dividends on the stock price is nullified. This enables the correct calculation of the total return from the price series alone, without an explicit consideration of the dividend stream. split-adjusted is either "yes" or "no" (the default). With value "no", the stock price series is interpreted as the series of raw prices that are traded on the stock exchange. With value "yes", the price series has undergone a retroactive split correction: this is similar to a dividend correction but for splits. Suppose that a stock that traded for $100 on August 31 is split 2 : 1 on September 1. With the split correction applied, all prices (in the data series) before August 31 have been divided by two, to make their level comparable to post-September 1 prices. Hence, the August 31 price is brought back to $50. exchange is an optional free-form text string giving the exchange on which the stock is traded. ticker is an optional free-form text string giving the symbol (ticker) by which the stock trades on the exchange.. Element: <bond> ∗. The current use of <bond> in SAFIR is limited to specifying risk-free rates.. The current specification is extremely preliminary is is likely to undergo substantial changes in the future.∗ A bond houses information for bondlike securities. It may enclose exactly one <time-series> element. The following attributes may be specified, in addition to an id and a flavor: name is the free-form text name of the bond maturity is a free-form text name describing the bond maturity (likely to be made more structured in the future)..
(23) 19. Option-Related Elements <!-- option-class: specification of call/put, payoff type, exercise type --> <!-- settlement-type indicates whether the underlying opening or closing --> <!-price is used to compute the option payoff. --> <!ELEMENT option-class (option-series)*> <!ATTLIST option-class %common.att; %flavor.att; underlying-asset IDREF #REQUIRED payoff-type (call|put) #REQUIRED exercise-type (american|european) #REQUIRED settlement-type (open|close) "close" exchange CDATA #IMPLIED> <!-- option-series: specification of strike price and expiration date <!-- The EXPIRATION DATE is a character string in the YYYYMMDD format <!-- AN IRREGULAR STRIKE is a strike price whose letter does not match <!-the strike code letter in the ticker symbol <!-- A DEDUCED STRIKE is a strike price that was derived indirectly, <!-e.g. using the put-call parity. No guarantee of 100% accuracy. <!ELEMENT option-series (time-series)> <!ATTLIST option-series %common.att; strike CDATA #REQUIRED expiration-date CDATA #REQUIRED irregular-strike (yes|no) "no" deduced-strike (yes|no) "no" ticker CDATA #IMPLIED>. 3.2.4. --> --> --> --> --> -->. Element: <option-class>. The is the first level of elements used to represent exchange-traded options.∗ An <option-class> groups together one or more <option-series>, and specifies the conditions that are common to several series. In addition to the id and flavor attributes, it specifies the following: underlying-asset is the XML id of the <stock> element corresponding to the underlying asset with respect to which the option is priced. Required attribute. payoff-type is either "call" or "put", standing respectively for—surprise!— call and put options. Required attribute. exercise-type is either "american" or "european", for the corresponding type of exercise restrictions. American options can be exercised at any time up to the option maturity, whereas European options can only be exercised at maturity. Other exotic options (Asian, Bermudian, etc.) are not currently supported. Required attribute. settlement-type is either "open" or "close" (the default). For an open option, the opening price of the underlying asset on settlement day is used to determine the option’s payoff. For a closed option, the closing underlying price is used for that purpose. exchange is an optional free-form text string giving the exchange on which the option is traded.. ∗. SAFIR cannot represent all conceivable contract clauses arising in OTC options; only those of standardized exchange-traded options are handled..
(24) 20. 3.2.5. Element: <option-series>. An <option-series> element contains the price series of an individual option contract (i.e. with a specific strike and maturity date). It must contain exactly one <time-series> element. In addition to an id attribute, the following attributes may be specified:. strike is the option strike price, expressed in the currency of the corresponding underlying security. If the underlying stock series is splitadjusted, the strike prices are adjusted accordingly. The behavior for dividend adjustments depends on the rules of the exchange on which the option is traded. Required attribute.. expiration-date is the option maturity date in YYYYMMDD format. Required attribute.. irregular-strike has value "yes" if the option strike price does not match the strike price code in the option ticker. Irregular-strike series are sometimes issued by exchanges when the underlying asset experiences price swings of large magnitude over a short time period, and a new option series must be issued with a strike code that is already used by an actively-traded series. Default value is "no".. deduced-strike has value "yes" if the specified strike price has been inferred from an indirect procedure, and hence has some probability of being incorrect. The prototypical example is options data that only contain a ticker code without an explicit strike price, and where the strike must be “guessed” from the ticker code; unfortunately, this process is not 100% reliable because of the irregular-strike problem hinted at above. The appendix addresses this issue. Default value is "no".. ticker is a free-form text string giving the option complete ticker (including maturity and ticker codes)..
(25) 21. Time Series <!-- time-series: point to binary data and gives sampling conditions <!-- The number-obs, start-date, and end-date are optional, but can speed <!-- up processing operations (queries, etc). Start-date and end-date <!-- are given in ’YYYY MM DD HH MM SS’ format (HH MM SS are optional). <!-- The end-date is inclusive, and is the date of the LAST observation. <!ELEMENT time-series EMPTY> <!ATTLIST time-series %common.att; series-type CDATA #IMPLIED observation-type ( quote | transaction | other ) "other" frequency ( quarterly | monthly | weekly | daily | hourly | thirty-min | fifteen-min | five-min | tick-by-tick | other ) "other" column-format NMTOKENS #REQUIRED uri CDATA #REQUIRED number-obs CDATA #IMPLIED start-date CDATA #IMPLIED end-date CDATA #IMPLIED>. --> --> --> --> -->. A <time-series> element specifies a “pointer” to a physical data series (numerical) matrix, in addition to listing various conditions under which the series has been recorded. It is an EMPTY element, meaning that it cannot contain any sub-element and must be closed right away (this is generally done by using the XML “close-right-away” shortcut: <time-series ... />. The following attributes may be specified, in addition to the standard id: series-type is an optional text string giving the type of the data series. The following strings have a recognized meaning: String. Used for. "bond yield". Series denotes the yield (annualized return) on a bond. "stock price". Series denotes a stock (or stock-like) price. "dividend history". Series denotes the history of dividends paid by a stock. "split history". Series denotes the history of splits (or reverse splits) undergone by a stock. "option price". Series denotes an option price. observation-type is either "quote" (for quote data), "transaction" (for transaction data), or "other" (the default, for unknown data). See p. 2.1 for an explanation of the difference. frequency is a rough indication of the recording frequency for the observations; the default value is "other", signifying an unknown frequency..
(26) 22. column-format is a list of XML tokens giving the meaning of each column in the data series. See section 3.2.2 for an explanation and a list of standard column headings. Required attribute. uri is a text string containing a Universal Resource Identifier for locating the physical data series (numerical matrix). The physical data representation is currently determined from the file extension. number-obs is an optional attribute giving the number of rows in the data series (the number of columns can be determined from the column-format attribute). This attribute may be specified primarily as an optimization to allow programs to start working lazily with the data matrix without having to completely load it beforehand. start-date and end-date are optional attributes that give the date of the first and last observation in the series, in "YYYY MM DD" or "YYYY MM DD HH MM SS" format (depending on the sampling frequency). These attributes are optional and are provided for optimization purposes: they allow date-filtering query operations on the database without having to explicitly refer to the uri..
(27) Financial Database 4 Access From C++ This section describes the current interfaces for accessing financial data from within a C++ machine-learning framework. We assume that the reader is familiar with basic C++ ideas such as standard-library containers (lists and vectors) and iterators, along with the PLearn machine-larning library developed within the LISA laboratory.. 4.1. B ASIC A CCESS C ODE. Sidebar 4.1 illustrates the basic patterns necessary for accessing the database from within a C++ program:. SAFIR. 1. Include the header file SAFIR.h. All classes and declarations in SAFIR reside in the SAFIR namespace; you can either prefix every name reference by the SAFIR:: modifier, or use a using declaration as shown here. 2. Create a SAFIR::FinanceDB object, which provides the main interface to the SAFIR database. A path to the XML top-level file must be provided upon construction. 3. Formulate a query for the financial information you want. Financial queries have a type PFinanceConstraint, and are written using familiar-looking C++ operators. In this example, we make a query for all time series within the USA (country id="us"), and that satisfy either of the following criteria: • The time series is associated to the stock of a public corporation trading on the New York Stock Exchange (<stock exchange="NYSE">). This means that all series associated with the stock are returned (i.e. price series, dividend history, and split history if applicable). Additional constraints could be specified to return only the price series, for example. • All time series associated with stock indexes within the USA, including stock-index-price series, and option-price series. Again, additional constraints could be specified to return, for instance, only the stock-index prices and omit the options..
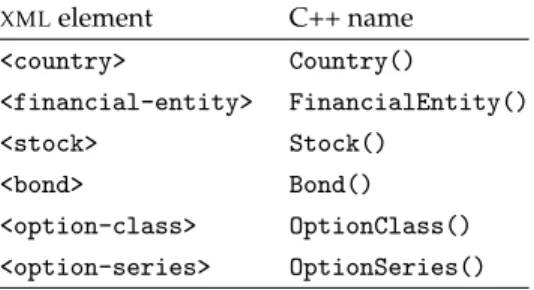
(28) 24. Sidebar 4.1. Accessing a SAFIR Database from C++. #include <iterator> // From standard C++ library #include "SAFIR.h" using namespace SAFIR; int main() { FinanceDB mydb("/u/lisa/Database/finance/option/xml/TestData.xml"); PFinanceConstraint c = Country().id("us") && ((FinancialEntity().type("public-corporation") && Stock().exchange("NYSE")) || FinancialEntity().type("stock-index")); list<TimeSeries> ts = mydb.queryTimeSeries(c); for (list<TimeSeries>::iterator it = ts.begin(), end = ts.end() ; it != end ; ++it) cout << (*it)->attr("uri") << endl; cout << endl << "The risk free rate for the USA is at uri" << endl << mydb.queryRiskFreeRate("us")->attr("uri") << endl; }. 4. The query itself is made by calling the queryTimeSeries member function. It returns a list of SAFIR::TimeSeries objects, which are the C++ view of the corresponding <time-series> XML elements. Exactly one C++ object appears in the list for every <time-series> element that satisfies the given constraints. 5. The example code iterates over the list and prints the physical location (uri attribute) of the data file for each series. See below for more details about SAFIR::TimeSeries objects. 6. The last line queries the risk-free rate series for the USA (country id="us"), and prints the physical location of the data series.. 4.1.1. What is a SAFIR::TimeSeries Object?. The SAFIR::TimeSeries class inherits from the PLearn VMat class, which provides so-called “virtual matrices”. Hence, a time series can be treated exactly like a numerical matrix of numbers, and used in all places within PLearn where a VMat is expected (among others, model training and testing algorithms). In addition, a few other member functions are available for accessing the contents of the XML attributes (see the online documentation for more details), the most important being string attr(string attribute_name) const; which returns the (string) value of a given attribute in the corresponding <time-series> element, or any XML ancestor to the element. Note that.
(29) 25. XML. element. C++ name. <country>. Country(). <financial-entity>. FinancialEntity(). <stock>. Stock(). <bond>. Bond(). <option-class>. OptionClass(). <option-series>. OptionSeries(). this function must be accessed with an arrow operator from the TimeSeries object.∗. 4.1.2. Table 4.1. Equivalence between XML elements and the corresponding C++ names. Note that all C++ names are located in namespace SAFIR.. ∗. This is related to the VMat–VMatrix duality in PLearn.. Allowable Queries. The query language within SAFIR is C++ itself; at the moment, queries for <time-series> elements only can be specified. The query structure is designed to be as “declarative” as possible, with a C++ expression specifying constraints on the time series that are allowed to match. All constraints are of type SAFIR::PFinanceConstraint. The simplest type of constraints, the elementary constraint, takes the form of the following C++ expression: ElementType ().attribute ("value "), and has the following semantics: it requires that somewhere within all “ancestral elements”† of a matching time series, an element corresponding to ElementType has an attribute with the specified value. The value must be given as a string. The equivalence between XML elements and the corresponding C++ names are given in table 4.1. The attribute names are identical in the C++ code to what they are in XML , except that all dashes (-) are replaced with underscores (_) in the C++ expression. Several elementary constraints can be combined with the C++ operators && (logical and) and || (logical or). Parentheses can be used at will for grouping. Note that at the moment, the negation operator (!) is not supported.. 4.2. †. In other words, going upwards in the XML tree, towards the root element.. M ARGINALIZATION A CROSS T IME S ERIES. It very often happens that the list of time series returned by a call to the function FinanceDB::queryTimeSeries() is not in a format amenable to creating a training set for a machine learning algorithm. Part of the problem‡ lies in the fact that too many separate series are returned by the query operation. For example, a query for all stock options on IBM with a given expiry date will return a separate series for each strike, for both calls and. ‡. Besides obvious data preprocessing issues, consideration of which we defer until a later revision of SAFIR..
(30) 26. puts! Assuming that 10 strikes are traded at the same time, this makes 20 series, and this is fixing the identity of the corporation, and the expiry date. In order to make a useful training set, we would ideally require a single matrix (or a small number), containing all the relevant conditions. This is exactly the purpose served by marginalization. This operations lets you specify that some XML attributes should really be transferred to the (numerical) VMat object, and the time series which have an otherwise-identical set of attributes after this transfer should then be merged into a single series. Returning to the above example with options, we have an initial query that returns 20 different time series, 10 for calls (one for each strike price) and 10 for puts. If we marginalize those 20 series by the strike price attribute, we end up with only two series: one for all calls and one for all puts. In addition, each of those series has one new column, corresponding to the original strike price variable that has been marginalized. Note that after marginalization, the series are not necessarily in strict chronological order any more: in the current implementation, the original subseries are simply concatenated. It is likewise possible to marginalize according to more than one variable simultaneously. For instance, we could marginalize according to both the strike price and the payoff type. In this case, we end up with only one series, that has two additional columns, respectively for the strike price and payoff type. Note that since the payoff-type attribute is string-valued, the strings would be converted to unique serial numbers, one corresponding to "call" and another corresponding to "put".. 4.2.1. Marginalization Example. An example of marginalization appears in sidebar 4.2. The initial query calls for all call options expiring on 2001/11/18 on the CBOE Oil Index. This returns one different time series for each strike price, and we would like to marginalize across strikes. The procedure is simply to construct a SAFIR::Marginalizer object, and set the attributes you want to marginalize over by calling the marginalizeOn() member function, several times if necessary. It is also necessary to specify the attributes to ignore during the marginalization operation, here ticker, uri, and id: these attributes are known to be different across time series, but we don’t care; they should not serve to prevent two otherwise-identical series from being merged. Then, you simply call the member function marginalize(), passing it the result (list of time series) obtained from a queryTimeSeries() operation. The result is, again, a new list of time series, each with additional columns that correspond to the attributes that have been marginalized over..
(31) 27. Sidebar 4.2. Marginalizing the Strike Attributes. #include <iterator> // From standard C++ library #include "SAFIR.h" using namespace SAFIR; int main() { FinanceDB mydb("/u/lisa/Database/finance/option/xml/TestData.xml"); // Get all call options for the specified option expiring on 20001118. PFinanceConstraint c = Country().id("us") && (OptionClass().payoff_type("call")) && (OptionSeries().expiration_date("20001118")) && (FinancialEntity().name("CBOE Oil Index Open/Euro C")); // This returns a list of time series, with each series representing // the option price for a different strike. list<TimeSeries> ts = mydb.queryTimeSeries(c); Marginalizer test_margin(&mydb); test_margin.marginalizeOn("strike"); test_margin.ignore("ticker"); test_margin.ignore("uri"); test_margin.ignore("id"); // Merge together otherwise-identical series having a different strike. // The strike price is added as a new column to all time series. list<TimeSeries> new_ts = test_margin.marginalize(ts); typedef list<TimeSeries>::iterator lst_iterator; for (lst_iterator it = new_ts.begin(), end = new_ts.end() ; it != end ; ++it) { int l = it->length(); int w = it->width(); cout << (*it)->attr("uri") << " (" << l << " X " << w << ")" << endl; } }.
(32) 28.
(33) 5 Future Work It must be emphasized that SAFIR remains a work in progress, and is being constantly developed to suit the needs of applying data mining and machine learning algorithms to problems in finance. Although the current version is quite functional, several important issues still need to be addressed. Sanity Checking A “sanity checking” procedure is nessary to ensure the internal consistency of the database (e.g. that all XML links and all external data series references remain valid), and the likely correctness of the data series themselves. This includes checking for obvious errors (negative prices, observations not in chronological order, etc.), and more complicated ones (e.g. the option prices do not make sense, given the underlying asset prices). Ideally, this checking should be made automatic, for instance daily, through a cron job. A very sophisticated sanity checker for option prices, incorporating literally dozens of verifications, has already been written by Julien Keable, an analyst with the LISA. It is a current project to fully interface this checker with SAFIR, and enhance its functionality for verifying the other parts of the database. More Data Types SAFIR needs to be extended to properly handle more of the common financial data types, in particular macroeconomic series, commodities, empirical term structures of interest rates, and other derivatives (e.g. futures on commodities and financials). It is expected that the current design should gracefully accomodate these extensions, both within the XML structure (where little needs to be changed, save for new element types within the DTD), and the C++ interface. Moreover, the specification for fixed-income products should be made more comprehensive, and properly handle government and corporate bonds. Some consideration should also be given to convertible bonds. Intra-Day Data Feeds The current physical data design makes more complicated than it should to incorporate near-real-time (intraday) collected data into the database. Although we currently have all the infrastructure to collect and archive intra-day quotes (taken every 15 minutes), the software.
(34) 30. to automatically update the database with the new data (and optionally call a sanity checker before committing the results) is still in development. Automatic Preprocessing Finally, extensive preprocessing operations are a necessity before hoping to apply any realistic machine learning algorithm to a finance problem. Examples of common preprocessing include normalization operations (e.g. whitening or uniformization), up/downsampling, passing the data through linear (ARMA-type) and non-linear (e.g. wavelets) filters, and computing various simple technical indicators. Part of the difficulty in writing a general-purpose preprocessing module lies in the heterogeneity of the stored data: for instance, the observation dates of independently-collected series need to be “aligned”, with missing values appropriately filled in (with a zero-hold or some other extrapolation method). Furthermore, stock price series that are not split- or dividendadjusted need to be before computing total return series, etc. At the moment, the design and implementation of such a useful and general-purpose preprocessor for financial data remains the largest open project for the next major SAFIR version..
(35) Recovering Option Strikes from the Ticker A Symbol Alone Many third-party options database (e.g. DialData, Prophet) suffer from the major defect of not recording the exact option strike price along with the rest of the data; they only save the option ticker symbol, in addition, of course, to the option prices (typically, for daily data, the opening, closing, day-high and day-low prices). In theory, the ticker symbol∗ reserves one letter to indicate the option strike price modulo 100: ‘A’ denotes a strike of either $5, $105, $205, . . .; ‘B’ denotes a strike of either $10, $110, $210, . . .; and so forth. Then, given both put and call option prices, a simple put–call parity relationship could be applied to recover the exact strike from among the possible choices. In practice, however, the picture is not so pretty. At fault are the “irregular tickers” that exchanges sometimes introduce when the underlying stock price varies so much within a short time span that new option series must be introduced, but with strike letters already taken by actively-traded options. In other words, new options must be introduced with ticker symbols of options that are still being traded, with very different payoff characteristics (strikes that differ by $100 or more). What happens in these circumstances is that the exchange simply uses some other free letter as the strike code within the ticker, with this letter bearing no relationship whatsoever to the true strike price. We are then faced with an uneasy situation whereby a strike code letter can never entirely be relied upon, for it might be the case that it represents an irregular ticker, and we have no a priori way of distinguishing a regular ticker from an irregular one.. B ASIC P ROCEDURE The best procedure we currently know of to recover the strike from an option series is to make use of the fact that, for both calls and puts, the same strike code letter is used to denote the same strike price, no matter whether the series has an irregular strike or not. From there, a put–call parity relationship can be used to recover a first approximation to the strike price. The elementary Black–Scholes put–call parity satisfies, Ct − Pt = St − K exp(−r0 τ ),. ∗. At least, on U.S. exchanges..
(36) 32. where Ct , Pt and St are, respectively, the call, put, and underlying (stock) prices at time t, K is the strike price, r0 is the risk-free rate, and τ is the time to maturity. Given all other observed variables, it is a simple matter to isolate K; hence the problem is solved (or so it seems)! We don’t even need to make use of the strike letter to isolate back the option strike price.. R EFINEMENTS Put–call parity holds imperfectly, since most exchange-traded options are American, whereas the parity relationship holds exactly only for European options. In addition, market mispricings on any given day (including finite ˆ t } of so-obtained strikes an extremely tick-size effects) make the sequence {K noisy time series, even (as we observe empirically) for actively-traded options on large indexes. An obvious possibility is simply to average the strike sequence, or to average the individual terms in the above equation, yielding P Pt − Ct + St ˆ Kt = Pt . t exp(−r0 t τt ). ∗. Most stock options trade in increments of $5, whereas options on indexes like the S&P 500 trade in increments of $25.. However, we empirically observe definite trends in the observed sequence ˆ t } of strikes, making an unconditional mean like the above appear un{K suitable. We have found that a filtering of the strike sequence, such as a simple exponentially-weighted moving average, gives quite acceptable results in practice. An additional refinement goes as follows: we can compare the “canˆ against the strike code letter (obtained from the didate” estimated strike K ticker symbol) and if the two are sufficiently close (implying a regular strike price with high probability), we then take the strike to be the one given by the ticker letter. Otherwise, we are dealing with an irregular strike, and ˆ to the nearest $5 or $25 (depending on we round the estimated strike K the exchange rules and the exact option being traded), and return this price instead.∗ An example of this process is illustrated in figure A.1, which shows the evolution of the strike deduced from the put–call parity relationship as a function of the trading day, for a pair of put and call options whose true strike price is believed to be $50. In addition to the high noise of individual points, we note a clear trend towards the “real” strike as we arrive at maturity. In this case, since the filtered strike at expiration ($49.72) is close to the strike given by the ticker letter (‘J’=$50), we can be nearly certain that the real strike is indeed $50. The specific exponentially-weighted moving average used in this example is: ¯ t = λK ¯ t−1 + (1 − λ)K ˆ t, K (A.1).
(37) 33. 51. J Figure A.1. Example of the evolution of the “implied strike” process as a function of the trading day (for the MOX stock index; option ticker AMOXCJ 01 for this example). The filtered series shows a clear trend as the option arrives at maturity. The real strike (from the letter ‘J’ in the ticker) is $50.. 50. 49. 48. 47. 46. Observed Strikes Filtered Strikes Retained Strike. 45. 44. 43. 0. 20. 40. 60. 80. 100. 120. 140. 160. 180. 200. ¯ t is the filtered strike at time t, K ˆ t is the raw strike obtained from the where K (extended; see below) put–call parity relationship at t, and we have taken ¯0 = K ˆ 0 and the decay factor λ = 0.9. K. F URTHER W RINKLES Additional tricks can be used improve the accuracy of the recovered prices. For instance, for daily data, the opening, day-low, and closing prices are all bid prices, whereas the day-high is an ask price. Applying the parity relationship using only bid prices biases the recovered strike by an amount proportional to the unknown bid–ask spread; hence we should somehow use the only ask price we have, which is the day-high price. Unfortunately, we don’t know when during the day this high price was recorded, which makes its proper use slightly problematic (however, we have observed empirically that averaging the closing with the day-high price is sufficient to significantly reduce the bias in the recovered strke). However, the fact the we simultaneously have both call and put prices saves the day: the high (ask price) for the call occurs at the same time as the low (bid price) for the put, and vice-versa! We use this information as follows: Let the unknown bid–ask spread be ∆C for the call, ∆P for the put, and ∆S for the underlying stock, and assume that these spreads remain constant within a given day.∗ Denote the high call price during day t by C¯t , the low call price by Ct , and similarly for put and stock prices.. ∗. But not necessarily across days..
(38) 34. Furthermore, as explained above, we know that C¯t and P¯t are ask prices, whereas Ct and Pt are bid prices. In addition, we know that C¯t is observed at the same∗ as Pt , and similarly for Ct versus P¯t . Putting these prices in an “extended” put–call parity relationship and solving for the strike, we have, incorporating bid–ask spreads, ˆt = K =. −(C¯t −. ) + (S¯t − ∆2S ) − (Ct + 2 exp(−r0 t τt ) (−C¯t + Pt + S¯t ) + (−Ct + P¯t + St ) . 2 exp(−r0 t τt ) ∆C 2 ) + (Pt. +. ∆P 2. ∆C ¯ 2 ) + (Pt. −. ∆P 2. ) + (St +. We notice that the unknown spreads cancel out nicely by intelligently using both high and low prices. Using this information, and averaging over several days, we significantly increase the accuracy of the recovered strike prices from only ticker data, and are able to account for unknown occurrences of irregular strikes as well.. ∗. Assuming simultaneous transactions on the call and the put; in practice, the two observations would be closely spaced in time, but not exactly contemporaneous.. ∆S 2 ).
(39)
Figure
Documents relatifs
Based on a sample of 109 listed banks and a set of macroeconomic announcements and individual bank public announcements, our study first shows that whereas bank stock prices did
In particular, our method is aimed at clustering time series that: (i) represent entities belonging to the same do- main (e.g. stock-market prices of di↵erent companies) and are
When applying PETRA to the case of stock prices, we can capture the intrinsic dynamics of the stocks’ (and companies’) relationships, through the recognition of points in time
ii) In forecasting, we used the cointegration to improve the forecasting ability in the multi-steps forecast of share price series. The aim of this study is to investigate the
By looking over these results and trying to answer qualitative questions about which type of models make better predictions, we nd that the results broadly suggest that for
In this study, our particular interest consists in the application of classical tools of signal analysis, fractional Fourier transform (FrFT) and Fractional Calculus to re- veal
This section discusses and compares the transmission mechanism of shocks originating within the financial intermediation sector, financial shocks, with two other types of
2.6 Summary statistics of the 1-step ahead forecast
