Montréal Mars 2002
Série Scientifique
Scientific Series
2002s-22Occupational Gender Segregation
and Women’s Wages in Canada:
An Historical Perspective
Nicole M. Fortin, Michael Huberman
CIRANO
Le CIRANO est un organisme sans but lucratif constitué en vertu de la Loi des compagnies du Québec. Le financement de son infrastructure et de ses activités de recherche provient des cotisations de ses organisations-membres, d’une subvention d’infrastructure du ministère de la Recherche, de la Science et de la Technologie, de même que des subventions et mandats obtenus par ses équipes de recherche.
CIRANO is a private non-profit organization incorporated under the Québec Companies Act. Its infrastructure and research activities are funded through fees paid by member organizations, an infrastructure grant from the Ministère de la Recherche, de la Science et de la Technologie, and grants and research mandates obtained by its research teams.
Les organisations-partenaires / The Partner Organizations
•École des Hautes Études Commerciales •École Polytechnique de Montréal •Université Concordia
•Université de Montréal
•Université du Québec à Montréal •Université Laval
•Université McGill
•Ministère des Finances du Québec •MRST
•Alcan inc. •AXA Canada •Banque du Canada
•Banque Laurentienne du Canada •Banque Nationale du Canada •Banque Royale du Canada •Bell Canada
•Bombardier •Bourse de Montréal
•Développement des ressources humaines Canada (DRHC) •Fédération des caisses Desjardins du Québec
•Hydro-Québec •Industrie Canada
•Pratt & Whitney Canada Inc. •Raymond Chabot Grant Thornton •Ville de Montréal
© 2002 Nicole M. Fortin et Michael Huberman. Tous droits réservés. All rights reserved. Reproduction partielle permise avec citation du document source, incluant la notice ©.
Short sections may be quoted without explicit permission, if full credit, including © notice, is given to the source.
ISSN 1198-8177
Les cahiers de la série scientifique (CS) visent à rendre accessibles des résultats de recherche effectuée au CIRANO afin de susciter échanges et commentaires. Ces cahiers sont écrits dans le style des publications scientifiques. Les idées et les opinions émises sont sous l’unique responsabilité des auteurs et ne représentent pas nécessairement les positions du CIRANO ou de ses partenaires.
This paper presents research carried out at CIRANO and aims at encouraging discussion and comment. The observations and viewpoints expressed are the sole responsibility of the authors. They do not necessarily represent positions of CIRANO or its partners.
Occupational Gender Segregation and Women’s Wages
in Canada: An Historical Perspective
*Nicole M. Fortin
†and Michael Huberman
‡Résumé / Abstract
Nous traçons un portrait de l'évolution de la ségrégation professionnelle selon le sexe au 20ième siècle, et de ses conséquences sur la condition féminine dans le marché du travail. Dans la première partie du 20ième siècle, la ségrégation professionnelle hiérarchique ou verticale a considérablement déclinée alors que les travailleuses quittaient les emplois de domestique et du secteur manufacturier en faveur des emplois de bureau. Ceci créa néanmoins une importante ségrégation professionnelle horizontale qui persiste jusqu'à aujourd'hui. Pour étudier les effets de la ségrégation professionnelle sur l'écart salarial selon le sexe, nous présentons une technique de décomposition qui divise l'écart salarial en deux composantes: l'une due aux différences intra-occupations et l'autre due aux différences inter-occupations. Depuis le début des années 90, la composante intra-occupation est prédominante.
We document the evolution of occupational gender segregation and its implications for women’s labour market outcomes over the twentieth century. The first half of the century saw a considerable decline in vertical segregation as women moved out of domestic and manufacturing work into clerical work. This created a substantial amount of horizontal segregation that persists to this day. To study the effects of occupational segregation on the gender gap, we introduce a decomposition technique that divides the gap into between-occupation and within-occupation components. Since the 1990s the component attributable to within-occupation wage differentials has become predominant.
Mots-clés : Ségrégation professionnelle, équité salariale, écart salarial selon le sexe, histoire économique
Keywords: Occupational segregation, gender wage gap, pay equity, economic history
*
We wish to thank David Gray and Gillian Hamilton for helpful comments and suggestions, and Quynh Van Tran and Sarah McLean for excellent research assistance. Financial support was provided by CIRANO, HRDC and SSHRC (Fortin: Grant no. 410-99-0959; Huberman: Grant no. 410-98-0125). All opinions expressed in this paper are those of the authors.
†
University of British Columbia and CIRANO
‡
The labour market outcomes of Canadian women have improved dramatically over the last forty years. Female labour force participation rose from below 30 per cent in 1961 to more than 75 per cent in 1996. Over roughly the same period (1960 to 1998), the ratio of female to male labour market earnings among full-time full-year workers increased from 54 to 72 per cent. Ever more optimistic, studies (Drolet 2001) that account for gender differences in weekly hours of work find a female/male hourly wage ratio in the lower 80 per cent. In spite of these changes, there is a longstanding concern that the concentration of women in certain
occupations, and within all occupations in selected tasks, has limited their labour market outcomes.
Our objective is to reconcile these seemingly opposing features of women’s work and to identify those dimensions of occupational gender segregation along which women’s progress in wages and earnings has been more important.2 A second goal is to shed light on the approaches to occupational segregation that underlie current gender-equality policies. Employment equity plans are designed to remove barriers that have limited women’s representation in male dominated occupations. They target directly gender segregation by task and by hierarchical levels within establishments.3 Employment equity also works at closing the gender wage gap if it breaks down hierarchical or vertical segregation. Pay equity/comparable worth policies are designed to correct the wage effects of occupational segregation. The U.S. National Committee on Pay Equity has long claimed that the “wage gap exists because most women and people of color are still segregated into a few low-paying occupations.”4 Designed to reduce the effect of occupational gender composition on female wages, pay equity initiatives seek to raise the pay of female-dominated jobs to that of comparable male-dominated jobs at the firm level.
along the two dimensions that are most relevant these policy initiatives. We depart from the recent studies (Blau, Simpson and Anderson 1998) that use a classification based on the gender composition of occupations.5 We return to the earlier taxonomy of Hakim (1979) and Moore (1985) and distinguish vertical and horizontal aspects of segregation.6 We define vertical segregation as segregation along hierarchical levels of work associated with different levels of education, experience, and skills. Vertical segregation can be thought of as intra-occupational if it occurs in similar lines of work (office clerks, administrative assistants, managers, executives; law clerks, notaries, trial lawyers, judges), or as inter-occupational if it involves the hierarchical comparison of jobs in different lines of work (domestic service, clerical work, professional work). Using the human-capital model, economists have predicted a decline in vertical
segregation as women reach higher levels of educational attainment and experience over time. In contrast, horizontal segregation involves segregation into jobs with similar educational and other requirements, but in different fields of study or endeavour (office clerks vs. truck drivers; assistant nurses vs. mechanics; teachers vs. engineers). Since horizontal segregation is often associated with gender role attitudes, it may be more persistent over time.
Our study of historical trends is based on census data, which limits our analysis to gender segregation by broad occupational classes. This approach abstracts from the important issue of inter-industry and inter-establishment segregation that is best handled at a more detailed level of analysis. Nonetheless, the tabulated census data provide the most accessible point of departure to chart the broad sweep of changes over time. We begin with a descriptive analysis of the evolution of occupational segregation over the first half of the twentieth century. We then turn to a statistical portrait of the relative effects of occupational changes and intra-occupation gender differentials on the gender pay gap after 1961. Other studies of the effect of
occupational gender segregation on the gender gap (Treiman and Hartman 1981, Gunderson and Reid 1983, Polachek 1987) have relied on counterfactual distributions of occupations to evaluate the impact of occupational segregation at a particular date. These counterfactuals ask what would the gender earnings ratio/gap have been if the female workforce was given the male occupational distribution, holding constant the ratio of female to male earnings in each occupation. Most of these studies find that occupational segregation – if it was the only explanatory factor – would explain around 20 per cent of the earnings gap. We introduce an alternative approach derived from classical analysis of variance that divides the gender wage gap into between-occupation and within-occupation classes components. This decomposition indicates that, in contrast to the early 1980s, the largest contribution to the gender wage gap in the 1990s came from the within-occupation classes component.7 The contribution of the between-occupation classes has declined sharply over time, although it remains substantial. Finally, we present cases studies of a few very large Canadian firms to examine the extent of intra-occupational vertical segregation by pay levels.
Occupational Segregation: 1900 to 1960
Altman and Lamontagne (1996) and MacKinnon (1991) have considered the historical nature and evolution of occupational segregation.8 Although segregation has been a persistent feature of Canadian labour markets, it has by no means been occupation specific. Nor has it been the case that occupational segregation has necessarily led to downward pressure on women’s wages. For the first three decades of the century, Altman and Lamontagne report that female/male earnings ratio rose from 47 per cent in 1900 to a little more than 50 per cent in 1930. They attribute the relative rise in female earnings to the gradual concentration of women
into clerical work. In 1900, almost one third of the female labour force was employed in manufacturing, while clerical work represented only 8 per cent of female employment. The largest share of the female labour force, 56 per cent, was employed in services, including professional and domestic services. MacKinnon (1999) reports that in 1901 domestic services accounted for as much as two-thirds of service workers, or from 25 to 35 per cent of female employment. By 1930, blue and white-collar workers had traded places. Manufacturing had reduced its share of female employment to 14 per cent, and clerical tasks claimed 22 per cent of the female workers. The femaleness of clerical work had increased from 21 to 48 per cent. Both Altman and Lamontagne and McKinnon note a relatively favorable gender earnings ratio among clerical workers of around 70 per cent. Trade, another occupation group that
experienced significant growth, also saw its share of female employment increase, from 1 per cent to 10 per cent by 1930. The large movement of women into clerical and trade occupations raised the share of women in the labour force from 19 per cent to 21 per cent between 1900 and 1930.
After 1930, the occupational breakdown by gender began to correspond to the pattern found in the later part of the century in many developed countries (OECD 1998). Women were increasingly concentrated into clerical work, sales, health occupations (predominantly nursing) and teaching. Meltz (1969) provides a statistical account of the development of these
professions. In 1931, 10 per cent of women were employed as school teachers and they
represented 78 per cent of all teachers. The period 1931-1961 saw a relative decline of women in the teaching profession; by 1961 femaleness was down to 70 per cent, with school teachers representing about 7 per cent of female employment. As for nursing, it involved a little more than 5 per cent of the female workforce in 1930; at this date, it was a 100 per cent female
occupation. In 1961, nursing (including graduates, nurses in-training and practicing nurses) had risen slightly to about 7 per cent of the female workforce.9
Table 1 gives the overall changes in the distribution workforces by gender in the first half of the century compiled by Meltz (1969) from the censuses of population, and which may differ from the censuses of manufacturing used by Altman and Lamontagne (1996). For women, there was a substantial decline in the proportion employed in the personal services (mostly domestic service) as well as in the manufacturing sector that was offset by a
considerable increase in clerical and commercial work. For men, there was a sharp decline in the proportion employed in the primary sector (mainly agriculture), compensated by increases of equal weight in the managerial, professional, manufacturing and transportation sectors. The contrasting experiences of women and men make clear that women did not participate in the growth of professional and managerial work in the first part of the century; nor did they participate in the expansion of the transportation sector. Often characterized as the “crowding” of women into pink-collar jobs, the massive entry of women in clerical work slowed down before World War II, only to gain speed between 1941 and 1951. Women’s entry into this line of work made economic sense. Up to 1951, clerical work was the second highest paid
occupation group for women, only slightly below professional occupations, yet educational requirements of clerical occupations were much lower than that of professionals (Meltz 1965).10 Meltz claims that many young women, who might have otherwise chosen to enter the labour force in service occupations, pursued their education to qualify for clerical occupations that paid at least twice as much as services. This type of occupational upgrading can be seen as reducing vertical inter-occupational segregation.
in manufacturing. In 1901 a similar percentage of men and women, 32 per cent and 31 per cent respectively, were employed in manual work. By 1961, however, only 13 per cent of women were doing manual or blue-collar work, while the percentage of men had risen to 43 per cent. For women, manual work was lower paid than clerical work, and it required approximately the same amount of schooling as service work, which had lower pay.11 Costa (2000) has argued that the clerical sector provided women cleaner, less arduous work than manufacturing. There is also the possibility that as men moved out of agricultural employment they men “crowded” women out of manufacturing jobs.
Social (Prentice et al. 1996) and labour (Palmer 1992) historians have investigated in further detail the general decline of female manufacturing workers. During the 1920s there was a rise in the average size of business units. Newer and larger enterprises began to invest in human resource departments that designed schemes, like seniority plans, which aimed principally to reduce the turnover of skilled male workers (Jacoby 1997). Even before the depression, a distinguishing characteristic of large firms was their two-tiered employment systems in which women’s position was less secure. The introduction of minimum wages in the interwar years that were ostensibly directed to protect women and children gave firms further incentive to hire men in manufacturing. Men also gained because, more than women, they were employed in regulated and protected industries. Over time, as women left manufacturing, they lost the skills associated with these jobs, making it harder for them to get back into the sector when jobs had opened up again in the late 1930s. Women in clerical work fared much better than those in manufacturing during the depression years (Green and MacKinnon 1995). Costa (2000) observes these trends in the United States as well, but the share of women in
1920s was stronger than flows into the United States, and the increase in cheap immigrant male labour crowded out women. Moreover, industrial unions, which were more open to having women members than the craft organizations were slower to take off in Canada than in the United States.
The decline of the female workforce in manufacturing is noteworthy, because in current comparable worth initiatives many job comparisons involving pay equity adjustments are made between pink and blue-collar jobs. Typical cases in the application of comparable worth, in Minnesota and in Ontario, involved the comparison of office clerks to truck drivers. In the first part of the century, pink and blue-collar jobs did not require comparable education: the median number of years of schooling for female clerical workers from 1941 to 1961 was almost 11 years, whereas that for male blue-collar workers was 8 years (Meltz 1965). At least until 1961, the ratio of average annual earnings of female clerical workers to male manufacturing workers was relatively higher than the overall ratio, although it declined from 88 per cent in 1931 to 65 per cent in 1961. The gender pay gap was a pervasive feature of labour markets and not a phenomenon linked to female dominated occupations.
Occupations and Wages: From the 1960s Onwards
The starting point for our treatment of the relation between wages and occupations is 1961 which marks the beginning of the surge in female labour force participation that
characterizes the second half of the twentieth century. Using information from the censuses of 1961,1971, 1981 and 1991 (Canada, 1964, 1975, 1984, 1993), we have assembled the available tabulated information on the number and average employment income of full-time full-year male and female workers in detailed occupations.
This compilation was not always straightforward. The 1971 Census uses the Occupational Classification Manual (OCM), while that of 1981 relies on the Standard
Occupational Classification (SOC). This distinction had few implications for the classification at the major group level. Subsequent changes in classification were more troublesome. Because the 1996 Census uses an occupation classification system (1990 NOC) that is incompatible with the previous systems (1980 SOC), we were compelled to use data from the Labour Force Survey of 1997 and 1998, which is coded with the 1980 SOC. An advantage of the Labour Force Survey is that since 1997 it contains accurate average hourly wage data that enables us to include all workers.12 In contrast, the censuses do not record data on usual hours of work for the same year as the earnings data and, as result, when using census data we are forced to use the less than ideal measure of annual earnings of full-time full-year workers. This had its own complications. Since full-time men and women work on average different numbers of weekly hours, the corresponding measure of the earnings gap is biased.13 A related problem is that annual earnings include all wages and salaries from all jobs held during the year, as well as overtime pay. Because men are more likely than women to hold more than one job and to work overtime, the gender pay gap may be overstated. While the Labour Force Survey contains information on the more accurate average hourly earnings, it does not ask the number of weeks worked last year.14 It is therefore not possible for us to provide an account of the evolution of the gender wage gap that is fully consistent over the years by focusing on full-time full-year workers as in the censuses. However, we do remove part-time workers from our LFS computations to increase on consistency across surveys, unless otherwise indicated.
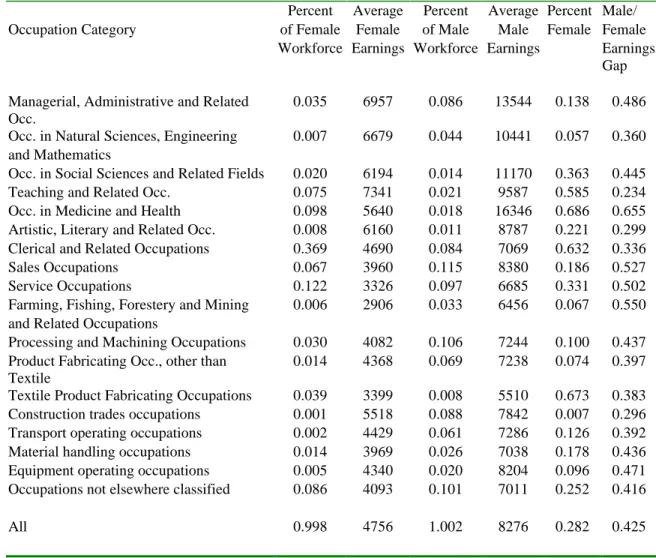
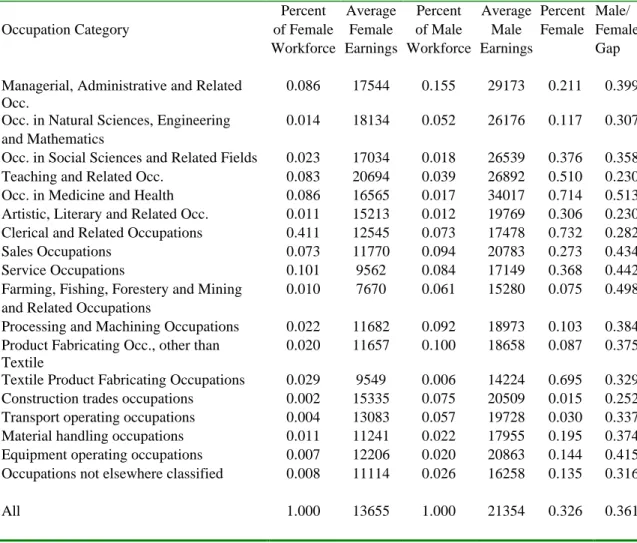
For 17 broad occupational categories, we present the average occupational earnings of full-time full-year workers (tables 2a-2d) and of full-time workers (table 2e), as well as the
gender breakdown of these figures. These categories resemble the major groups used in the occupation classification systems. We have paid special attention to the categories with high rates of femaleness: teaching, health occupations, clerical work, sales, services, and textile workers. The last column of each table gives the relative female/male earnings (wage) gap computed as the difference between average female earnings and average male earnings, normalized by dividing by average male earnings: g =(wm −wf)/wm, where wg, g=m, f are the average earnings of gender g. As explained below, this measure of the gender pay
differential allows the decomposition of the overall gap into between and within-occupations components.
Columns (1) and (3) of the tables, which give the gender-specific distribution of the workforce across the occupational categories, consider the extent to which women are “crowded” into a few female dominated occupation classes. Are women, for example, more concentrated in sales and services than men are? According to proponents of comparable worth, the crowding of women into a few low paying occupations is the main cause of the gender pay gap (Sorensen 1990). Columns (2) and (4) give the average earnings or average hourly wages of women and men, respectively. Column (6) presents the gender wage gap within occupations and considers whether women’s pay relative to men is higher in traditional female or male occupations. Column (5) gives the gender composition or femaleness of these occupations. In earlier years, if the per cent female in an occupation exceeds women's share of the total workforce (the per cent female for all occupations reported at the bottom of the table), this indicates a mostly female occupation. In the late 1980s, the relevant figure is a femaleness rate of more than 45 per cent of the workforce (including part-time workers). The introduction of a fifteen percentage points band led to legislative definitions of female jobs as those with a
femaleness rate over 60 per cent, and of male jobs as those with a femaleness rate below 30 per cent.
We begin our analysis with the evolution of the female and male distributions across several key occupations. Consider the managerial and professional categories. The latter
includes professional occupations in the natural science, engineering, mathematics, in the social sciences, law, teaching, medicine and health, and artistic, literary and related occupations. We observed little change in the representation of women in this area over the first part of the century. But between 1961 and 1997/98, the percentage of women employed in managerial occupations increased from 3 to 19 per cent; the percentage of women employed in
professional occupations rose from 18 to 25 per cent.15 At the same time, the percentage of women employed in clerical work followed a gradual decline, from its peak level of 42 per cent in 1961 to 26 per cent in 1997/98. This meant that, by the end of the century, managerial and professional women accounted for 45 per cent of the female workforce and represented a more important group in the late 1990s than clerical workers in the 1960s. The percentage of males in managerial and profession occupations, excluding the traditional female dominated
professions of education and health care, went from 17 per cent in 1961 to 27 per cent in 1997/98, while for women, the shares went from 5 to 27 per cent.
There was relatively little change in the distribution of the labour force in other
categories. Women’s presence in educational and health care fields, often associated with their traditional nurturing role, has not changed much. Seventeen per cent of women were involved full-time in the education and health care in 1961; in 1997/98, this figure rose to 19 per cent if part-time workers are included. Similarly, the percentage of the female workforce employed in sales and services did not change much; women (men) in sales and services went from 22 (19)
to 19 (16) per cent from 1961 to 1997/98.16 In many countries, such as the United States, sales occupations are female dominated occupations.17 But in Canada, the percentage of women in sales has generally been lower than women’s share of the total workforce. Even when we include part-time workers, women made up only 52 per cent of all sales workers in 1997/98. In the more narrowly defined “sales clerk” occupation (1980 SOC number 5135), women
represented 60 per cent of workers, which places this category at the cusp of a female
dominated occupation. Excluding protective and other services workers, the percentage of full-time full-year women in all other services declined from 13 per cent in 1961 to 8 per cent in 1991. In 1997/98, combining both part-time and full-time workers, child-care workers constituted less than 1 per cent of female employment, while food and beverage serving employed close to 3 per cent of female workers.
Overall, the occupational distributions reported in tables 2a-2e do not support the widely held view that women have tended to concentrate in sales and service occupations much more than men. Notwithstanding the absence of concentration along these lines, the gender distribution of occupations within the sales and services sector reveals segregation along a hierarchical dimension. Thus women tended to concentrate in retail and men in the wholesale trade. The story in sales and services is one of intra-occupational vertical segregation, rather than horizontal segregation.
This contrasts with the important female/male divide in manufacturing and related blue-collar occupations. In 1961, 41 per cent of male workers, but only 8 per cent of female workers, were involved in manual work other than textile work. Still, at this date, 6 per cent of working women were in the textile industry. By 1997/98, due to the forces of globalization, the
female workforce involved in other manual work remained relatively stable around 8 per cent, as was the share of the male workforce involved in non-textile manual work which was 44 per cent in 1997/98; overall, the 2 per cent increase in the secondary sector matched the decrease in the primary sector over that period.
In summary, the most evident development for women in the latter part of thecentury was the 22 percentage points increase in non-traditional female managerial and professional occupations and the 16 percentage points decline in clerical occupations. These occupational shifts, which we refer to as intra-occupational changes, coincided with the rise in women’s educational attainment, as well as with the introduction of new information technologies in the office. We also observe a 10 percentage points increase in managerial and professional
occupations (excluding education and health care) among males, a trend that is consistent with the rise in the share of non-production workers related to skill-biased technological change. Despite these hierarchical movements within white-collar work, which we will argue later were limited by the presence of a “glass ceiling”, the gulf between female and male employment in blue-collar work persisted. This leaves an overall picture of substantial - and static - horizontal segregation that is associated with the traditional white/blue collar, female/male divide, and women’s continued entry into nurturing professions (education and health care). Figure 1 provides a nice snapshot of these dynamics by regrouping the occupations into the ones that are stable, growing or declining over time. The bottom line is that the dynamic aspect of the
reduction in occupational gender segregation in the last couple of decades must have come from reduced vertical segregation.
The Duncan segregation index provides a more precise measurement of the extent of
occupational segregation. The index is computed as,
g j J j f j m j S
∑
= − = 1 5 . 0 α α , whereα is thegjproportion of group g in job j, g=m,f. This measure indicates the proportion of women (men) who would have to change occupations for the occupational distribution of men and women to be the same. A value of zero indicates complete integration, and a value of 100 indicates complete segregation. The measure is sensitive to the number of occupations J used in the computation.18 To minimize this problem, we establish a correspondence or crosswalk between the occupation codes of 1961 and 1971, and previously determined equivalences to bridge the smaller differences in the 1971 and 1981 occupation codes (the latter were also used in the 1991 Census). The crosswalk reduces the number of occupations to around 250 categories, but does not eliminate completely variations in the number of categories across census years.
Over the post World War II years, the Duncan index fell from a level of 71 in 1961, to 60 in 1971, 57 in 1981, 47 in 1991, and 42 in 1997/98. Gunderson (1998), using 496 unit groups, reports index levels of 62, 59, and 52 for the census reporting years between 1971 and 1991. For the United States, Blau et al. (1998) report comparable levels of 68 in 1970, 59 in 1980, and 53 in 1990. Changes in the index locate the 1980s as the decade of rapid
occupational change.19 Over this decade, based on the occupational distributions of tables 2c and 2d, the percentage of women in managerial occupations more than doubled, while the percentage of women employed in clerical work was reduced by ten points. Such was the magnitude of this change that it can be considered as the most significant occupational movement of the last part of the century. While part of the change may involve some
occupation re-labeling, from secretary to administrative assistant for example, the difference in earnings between the two categories indicates that more than changing titles was at work.
The substantial workplace and occupational changes after 1961 went hand-in-hand with the narrowing of the gender earnings gap, as reported in tables 2a-2e. In 1961, it stood at 46.5 per cent; by 1991, it had been cut to 32.3 percent, a reduction of 30 per cent. The more accurate measure of the gender pay gap that is based on the hourly wage of full-time workers shows an overall gap of 17.1 per cent in 1997/98.20 Of course, aggregate measures of this type mask occupational differences that are relevant to gender equity policies. To correct for this problem, we provide measures of the gender wage gap by occupational categories (in column 6 of tables 2a-2e). This shows in particular that women in integrated or male occupations generally do not face a more favorable gender pay gap than women employed in female dominated
occupations.21
In principle, when women are crowded into the handful of female-dominated occupations, the excess supply in these occupations ought to lower their level of pay. We would not expect this phenomenon to be at work in male and integrated occupations and, thus if crowding was responsible for the lower wages of women, the pay gap in these occupations would be more favorable. Yet, in 1961 when the crowding effect in clerical work, which comprised 42 per cent of the female workforce, was at its highest point, the gender pay gap in this occupation was lower than the relative gender gap in blue-collar work. More importantly, the average female earnings in clerical work in 1961 were also higher than in health care
occupations and in most sales, service and blue-collar occupations. In 1971, which followed the wave of unionization in the preceding decade, nursing began to move ahead of clerical
occupations. In 1981, the earnings of women in construction, transport-operating occupations surpassed those of clerical workers, and, by 1991, average female earnings in clerical work were no higher than among full-time full-year sales occupations. The trends of the latter part of
the century show clerical work as a declining occupation both in terms of its importance and relative levels of pay. While the crowding effect may have had some influence at mid-century, technological change (including word processing and other forms of computerizing
information), and the almost complete absence of unionization in the sector, explain much of the relative decline of clerical workers’ earnings in the 1980s and 1990s.22
Economic and social historians have studied these changes. Women continued to enter education and health fields (at the expense of clerical occupations) because the conditions of work in these areas were improving, in large part because of unionization. The start of the upsurge in public-goods unions occurred in Canada in the mid-to late 1960s, first at the
provincial and then at the federal level. Quebec was in the forefront of these changes. In 1964, it gave its workers the right to strike, but perhaps a more important turning point was in 1967, when, with the passage of Bill 25, Quebec introduced centralized negotiations of a base salary scale. Into the late 1950s, teachers and nurses in the province had negotiated at the local or establishment level and this produced large wage disparities between urban centers and the regions (Dionne 1969, Massicotte 1982). In teaching, disparities also existed between men and women and between married and single professionals. Unionization rates in theses sectors remained low. In fact, bargaining units were not recognized in the official statistics unless they were members of a central federation (Eaton 1972). Bill 25 in Quebec and the adoption of similar legislation elsewhere, the key federal legislation was the Public Service Staff Relations Act in 1967, suppressed wage differentials and ushered in a period of rapid growth in union density rates for women. For all of Canada, between 1961 and 1971, the union density rates in the public-goods sector rose from about 25 to 80 percent (CALURA various years).
sectors who were union members (Akyeampong 1998). Still, for all occupations the percentage of women workers unionized increased by about 40 per cent (from 16.4 to 22.6 per cent) between 1961 and 1971, with most of the change occurring after 1965, in line with the timing of the passage of legislation in Quebec and elsewhere. By 1970, Canada had highly unionized health and education fields, sectors that had extremely high rates of femaleness. Note that in the United States these changes occurred more slowly, and this might explain why the wage gap closed at a much faster rate in Canada.23
To make sense of recent women’s history of occupational choice and wages, we now seek to measure the contribution of changes in the distribution of occupations by gender on changes in the pay gap. The average wages of men and women can be written as:
f m g w w gj J j g j g , , 1 = =
∑
=α whereα is the proportion of group g in occupation j, and gj g j w is the
average wage of group g in occupation j. These proportions can be rewritten as αgj =αjsgj , where αj is the proportion of the whole workforce (men and women) in occupation j, and where s is the relative share of group g in occupation j. This relative share is equal to thegj share of group g in occupation j divided by the share of group g in the whole workforce:
) / ( ) / ( N N N N s g j g j g
j = . The gender gap in wages can be written as:
∑
(
)
= − = J j f j f j j m j m j js w s w G 1 α α . It
then can decomposed into a term that reflects male-female differences in the distribution of occupations, and a term that reflects male-female wage differences within a given occupation class:
(
)
[
(
)
( )]
. 1 1∑
∑
= = − − − + − = J j j f j f j j j m j m j j j J j f j m j j s s w s w w s w w G α α α ,where w is the average wage (for men and women) in job j, and j f j m j j s s s = − is the gender difference in job share j. As with Oaxaca decompositions, the choice of the base wage structure has an important impact on the results. Here we assume, following Oaxaca and Ransom (1994), that the base wage is the occupational wage averaged over male and female workers. That said, we note that in female dominated jobs, the average occupational wage will tend to reflect women’s wages; the converse holds in male dominated jobs.
Table 3 gives the results of this decomposition. We report the part of the gender gap that originates from differences in male and female earnings within a detailed occupation class, and the part of the gender wage gap that arises from differences in the distribution of men and women across occupations. While the third column of the table reveals a declining total male/female earnings gap both in raw and relative terms, the first column shows that the portion of the total gap due to between-occupation gender differences, the first term in the equation above, is also declining sharply. This is consistent with the occupational upgrading documented above. The second column shows the part of the gender gap that arises from the gender differences in earnings within the occupation classes. Surprisingly, this part of the wage gap is not continuously declining over time. Rather, the within-occupation wage gap is largest in 1991. This implies that, as a percentage of the total wage gap, the within-occupation
component has been growing over time. By 1997/98, the within-occupation gender gap accounted for almost two-thirds of the gender wage gap.24
These results cast a shadow on current pay equity/comparable worth proposals that focus on the between component of the gender wage gap. Recall that the dimension underlying the concept of comparable worth is the classification of jobs based on the femaleness rate. We have previously noted evidence of this in the pink/blue collar, female/male divide. But current
policy initiatives do not speak to the substantial and growing portion of the gender wage gap that originates from intra-occupational vertical segregation. Indeed one potential – and perverse – consequence of pay equity is that its implementation gives firms an incentive to integrate job classes, while maintaining women in the lower hierarchical echelons of these integrated job classes. We explore this possibility in the next section using firm level data.
Case Studies
The censuses and the Labour Force Survey data provide a good starting point to study the evolution of occupational segregation, but they are necessarily limited in scope because, even at their most detailed level, they consider only broadly defined occupational classes. This makes it difficult to account for that part of the trend in the within-occupation class portion of gender wage differentials that is the result of hierarchical segregation between men and women within occupations. As women enter traditional male occupations, they may be relegated to the lower echelons of the hierarchy. The appropriate policy prescription to tackle this problem is employment equity.
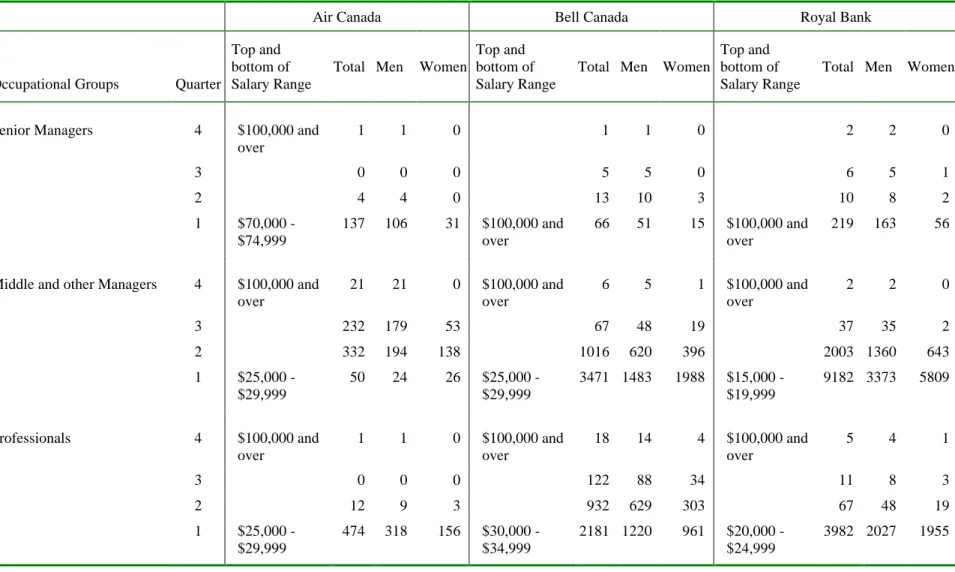
Our evaluation of hierarchical segregation is based on the reports by leading Canadian firms to the federal government on their employment equity initiatives. The 1996 federal employment equity requires targeted employers to submit reports of the representation of women, among other minority groups, in the firm’s hierarchy. Although the reports give information on 14 occupational groups that are in fact more broadly defined than the
occupations in Statistics Canada’s data, they do provide a breakdown of occupations by salary quartile. This allows us to evaluate the representation of women in the occupation hierarchy, even if precise titles are not available.
Table 4a-e reproduces part 2 of the reports for permanent full-time employees of three large firms for 1999: Air Canada, a male dominated firm; Bell Canada, an integrated firm; and the Royal Bank, a female dominated firm.25 The number of permanent full-time employees in each firm is in the 20,000-30,000 range, which make them very large firms by Canadian standards.
Air Canada has a high degree of concentration of female employees. Seventy-four per cent of women at the firm are congregated in the intermediate sales and service personnel category, an occupation with a femaleness rate of 68 per cent. Male employees concentrate in the semi-professional and technical tasks, skilled and semi-skilled crafts and trades, and in intermediate sales and services, a category that occupies 19 per cent of male employees. Although women are more than three times more likely to be in the intermediate sales and services category than men are, there is a larger concentration of women in the lowest salary quartile, 23 per cent compared to 16 per cent for men.
At Bell Canada, 69 per cent of female employees are concentrated in the clerical
personnel category, while 51 per cent of male employees are reported as skilled craft and trades workers. The shares of women and men entering middle management are about equal - 18 per cent of female employees and 19 per cent of male employees are considered to be “middle and other managers” category, an occupation that is 53 per cent female. However, despite the apparent gender balance, women are over-represented in the lowest salary quartile, 83 per cent compared to 69 per cent for men. Based on these figures, occupational segregation at Bell Canada would appear to operate along two dimensions, a pink/blue-collar, female/male divide, coupled with substantial intra-occupation vertical segregation.
At the Royal Bank, 70 per cent of all full-time permanent employees are female. Thirty-six per cent of female employees are in the lower echelon of clerical work and 22 per cent in the administrative and senior clerical category. In the middle management group, 58 per cent of workers are female. Although 29 per cent of women at the bank are employed in this
occupation, the corresponding figure for men is 51 per cent. As with the other firms, there is substantial vertical segregation in middle management: 90 per cent of women and 70 per cent of men are found in the lowest salary quartile. Table 4a, covering senior and middle
management as well as professionals at the bank, reinforces the portrait of hierarchical
segregation found within-occupation groups. Women are virtually absent from the highest pay quartile in these occupations and are more likely than men to be found in the bottom and second lowest quartile of the salary range: a phenomena often referred to as the glass ceiling.
The case studies confirm some of the stylized facts that emerged from our analysis of national data, although very large firms employ a relatively small proportion of the workforce. Horizontal segregation, which has a long history, persists at Air Canada and Bell Canada in the form of the pink/blue-collar, female/male divide. Hierarchical segregation, partly as the result of the glass ceiling phenomenon, also figures as an important stumbling block to women’s economic progress.
Conclusion
The evolution of women’s labour market outcomes over the twentieth century is a multi-faceted puzzle. Although female labour force participation rates have increased since 1960 and the wage gap has narrowed, women are concentrated in a number of occupations and strata within organizations. Here we have taken a preliminary step to sort out some pieces of
the puzzle. We find that horizontal segregation has essentially stagnated since mid-century, while segregation along vertical lines has narrowed and improved steadily, in large part following increases in women’s educational attainment.
Horizontal segregation has had two main components. First, is the relatively stable share of the female workforce, which hovered around 15 per cent from 1931 to 1991, engaged in nurturing occupations, mainly education and health care.26 Unionized in the 1960s, these occupations have among the smallest wage gap today and continue to offer relatively attractive wages to women.27 The second component of horizontal segregation has had a longer historical trajectory. At the beginning of the century, the manual blue-collar sector employed equal proportions of women and men, but by the depression years men had been replaced women in this line of work. The movement of men out of agriculture and into manufacturing, construction trades and transportation occupations intensified after World War II. By 1950 there was a great divide between men and women in manual work, a contrast that remains evident at the end of the century.
This pattern of horizontal segregation casts some doubt on the efficacy of pay equity proposals at reducing the overall gender wage gap. Undoubtedly, since certain blue-collar jobs especially in the skilled crafts and trades category are relatively well paid, women have been left out of some pecuniary opportunities. But from an economic and practical standpoint it is not clear that the most recent policy initiatives, despite their ever widening scope, can actually affect the labour market outcomes of a substantial proportion of women. Pay equity targets pay discrimination that arises from horizontal segregation within an employer/establishment of a minimum size, and in these establishments only women working in undervalued female jobs for which there are comparable male jobs actually benefit. This implies several limitations to
these policies. The first stems from the fact that much of the horizontal segregation we have described takes place across establishments and industries.28 Indeed, in studies that perform decompositions of the gender wage gap (Drolet 1999), and in those that investigate the penalty to female work (Reilly and Wirjanto 1999, Baker and Fortin 2001), the negative effect of industrial and establishment gender segregation on either the gender gap or female wages dominates that of occupational gender segregation.29 Recent research of Baker and Fortin (2000) suggests that another limitation on policy is the difficulty, if not impossibility, of making commensurate female and male jobs in establishments of less than 100 employees. Since more than two-thirds of the female workforce are employed in establishments with less than 100 employees, the great majority of women will likely be unaffected by pay equity initiatives. Other problems in the application of pay equity are reviewed in Weiner (2002) and Gunderson and Lanoie (2002).
As important, employment policies designed to moderate the effects of horizontal segregation have not had their intended results because, over the decades, segregation of this type has led to the concretization of gender role attitudes. Akerlof and Kranton (1999) have suggested that women who enter male jobs face severe obstacles if they threaten the “identity” of their fellow male workers. They cite a study of coal handlers in a power plant where a female co-worker was refused training and assistance routinely given to male co-workers. When confronted by deep-seated attitudes, policy initiatives based on comparisons of jobs of different types will prove even more difficult to apply.
In contrast to persistent horizontal segregation, the decline in inter-occupational vertical segregation has contributed to the improvement of women’s labour market outcomes over the course of the past century. Advances in educational attainment fueled these changes. In the
earlier part of the century, a high school diploma allowed women to move from domestic to clerical work. In the 1970s, professional and trade certificates permitted women to move into administrative work, and, in the 1980s, university degrees in commerce opened the doors to managerial occupations. Finnie and Wannell (1999) report that in 1982 only 9 per cent of female university graduates had a commerce degree, but that the figure was up to 12 per cent in 1990. For male graduates, these percentages were stable at 15 per cent. As a result, the
percentage of female graduates in commerce went from 38 per cent in 1982 to 47 per cent in 1990. We also observed substantial increases in the percentage of women in other non-traditional professional occupations. All told, we found that the largest improvement in the gender wage gap was the result between-occupation changes.
Offsetting occupational upgrading, there exists a substantial degree of
intra-occupational vertical segregation by pay levels at the firm level. In confirmation of this trend, we found an increase in the component of the gender gap attributable to within-occupation groups wage differentials. To the extent that this type of vertical segregation lies outside the framework of “equal pay for equal work” policies, the appropriate public policy response in this case is equal opportunity legislation. At the federal level, targeted employers which include private firms of more that 100 employees under federal jurisdiction or which are federal
contractors, as well as large public sector employers, are required to submit employment equity plans. The evaluation of the effectiveness of this law is in the early stages (Leck 2002). Others have sought to identify the obstacles to the progress of women in corporate hierarchies. Some (Baldwin et al. 2001) cite the distaste of men for working under female managers. Others (Costa 2000) cite the difficulty of combining work and family as slowing women’s move to the top. Costa argues that “more women than men are willing to sacrifice their careers for time
spent with children and those women who reach the top are disproportionately childless.” This also suggests an increasing role for family friendly policies both at the public and firm levels to support women’s economic progress. Evans (2002) reviews the impacts of work-family
reconciliation policies on women’s labour market outcomes across a number of developed countries.
The long-term perspective we have taken suggests that there is no single solution to correct for the impact of occupational segregation on the gender wage gap.30 If this is the case, then recent pay equity/comparable worth initiatives in Canada may well prove to be a large investment of resources with only modest returns, an example of une éléphante qui a accouché d’une souris. Over the century, a complex patchwork of different types of occupational
segregation has been established, shaped and altered by changes in education, technology and societal values. Much research remains in assembling all the pieces of the puzzle, including the assessment of firm-level data, in order to provide a sound basis for the formulation of evidence-based policies.
References
Akerlof, G. and R. Kranton. 2000. “Economics and Identity,” Quarterly Journal of Economics 115 (3): 715-53.
Akyeampong, E. B. 1998. “The Rise of Unionization among Women,” Perspectives on Labour and Income. Statistics Canada, no. 75-00I-XPE.
Altman, M. and L. Lamontagne. 1996. “Gender Pay Inequality and Occupational Change in Canada, 1900-1930,” Journal of Socio-Economics 25 (3): 285-309.
Anker, R. 1997. “Theories of Occupational Segregation by Sex: An Overview,” International Labour Review 136 (3): 315-39.
Baker, M. and N. M. Fortin. 1999. “Women's Wages in Women's Work: A US—Canada Comparison of the Roles of Unions and ‘Public Goods’ Sector Jobs,” American Economic Review 89 (2): 198-223.
Baker, M. and N. M. Fortin. 2000. “Does Comparable Worth Work in a Decentralized Labour Market?” NBER Working Paper no. 7937, Cambridge, MA.
Baker, M. and N. M. Fortin. 2001. “Occupational Gender Composition and Wages in Canada: 1987-1988,” Canadian Journal of Economics 34 (2): 345-376.
Baldwin, M. L., R. J. Butler, and W. G. Johnson. 2001. “A Hierarchical Theory of
Occupational Segregation and Wage Discrimination,” Economic Inquiry 39 (1): 94-110. Bayard, K. , J. Hellerstein, D. Neumark and K. Troske. 1999. “New Evidence on Sex
Segregation in Wages from Matched Employee-Employer Data,” NBER Working Paper no. 7003, Cambridge, MA.
Bergquits, V. A. 1974. “Women’s Participation in Labour Organizations,” Monthly Labor Review 97 (10): 3-9.
Blau, F. D., P. Simpson, and D. Anderson. 1998. “Continuing Progress? Trends in Occupational Segregation in the United States,” NBER Working Paper no. 6716, Cambridge, MA. CALURA. Various years. Statistics Canada. Catalogue 71-202. Annual Report of the
Minister of Industry, Science and Technology under the Corporations and Labour Unions Returns Act Part II- Labour Unions. Ottawa: Minster of Industry, Science and Technology.
Canada, Dominion Bureau of Statistics. 1964. 1961 Census of Canada - Labour Force, Vol. III part 3. Catalogue 94-533.
Canada, Statistics Canada. 1975. 1971 Census of Canada- Income of Individuals, Vol. III part 6. Catalogue 94-767. Table 18.
Canada. Statistics Canada. 1984. 1981 Census of Canada-Worked in 1980- Employment Income by Occupation. Vol 1. Catalogue 92-930. Table 1.
Canada, Statistics Canada. 1993. 1991 Census of Canada –Employment Income by Occupation. Catalogue 93-332. Table 1.
Canadian Human Rights Commission, 2001. Time for Action. A Special Report to Parliament. http://www.chrc-ccdp.ca/news-comm/2001/.
Carrington, W. J. and K. Troske. 1995. “Gender Segregation in Small Firms,” Journal of Human Resources, 30 (3): 329-365.
Carrington, W.J. and K. Troske. 1998. “Sex Segregation in U.S. Manufacturing,” Industrial and Labor Relations Review, 51(3): 445-464.
Costa, D. L. 2000. “From Mill Town to Board Room: The Rise of Women’s Paid Labour,” NBER Working Paper no. 7608. Cambridge, MA.
Dionne, P. 1969. “Une analyse historique de la Corporation des enseignants du Québec (1836-1968),” Université Laval (unpublished M.A. thesis).
Drolet, M. 2001. “The Persistent Gap: New Evidence on the Canadian Gender Wage Gap,” Analytical Studies Branch Research Paper Series No. 157. Ottawa: Statistics Canada. Eaton, J. K. 1972. Union Growth in Canada in the Sixties. Ottawa: Economics and Research
Branch, Department of Labour.
Evans, J. 2002. “Work/Family Reconciliation, Gender Wage Equity and Occupational Segregation: The Role of Firms and Public Policy,” Canadian Public Policy this issue Finnie, R. and T. Wannell. 1999. “The Gender Earnings Gap Amongst Canadian Bachelor’s
Level University Graduates: A Cross-Cohort Longitudinal Analysis,” in Women and Work, edited by Richard P. Chaykowski and Lisa M. Powell, John Deutsch Institute for the Study of Economic Policy, Queen’s University.
Goldin, C. 1990. Understanding the Gender Gap: An Economic History of American Women. Oxford: Oxford University Press.
Green, A. and M. MacKinnon. 1995. “Interwar Unemployment and Relief in Canada,” in Douglas McCalla and Michael Huberman, Perspectives on Canadian Economic History, 2nd edition. Toronto: Copp Clark.
Groshen, E. L. 1991. “The Structure of the Female/Male Wage Differential: Is It Who You Are, What You Do, or Where You Work? Journal of Human Resources 26 (no. 3): 457-472. Gunderson, M. 1998. Women and the Canadian Labour Market. Catalogue No. 96-321-MPE
No. 2, Statistics Canada.
Gunderson, M. and P. Lanoie. 2002. “Program Evaluation Criteria Applied to Pay Equity in Ontario,” Canadian Public Policy this issue.
Gunderson, M. and F. Reid. 1983. “Sex Discrimination in the Canadian Labour Market: Theories, Data and Evidence.” Women’s Bureau, Series A: Equality in the Workplace, no.3., Minister of Supply and Services. Canada.
Hakim, C. 1979. “Occupational Segregation: A Comparative Study of the Degree and Pattern of the Differentiation Between Men and Women’s Work in Britain, the United States and Other Countries,” Research Paper no. 9, London, United Kingdom: Department of Employment.
Jacobsen, J. P. 1998. The Economics of Gender. 2nd edition. Malden, MA.: Blackwell Publishers.
Jacoby, S. M. 1997. Modern Manors: Welfare Capitalism Since the New Deal. Princeton: Princeton University Press.
Kidd, M.P. and M. Shannon. 1994. "An Update and Extension of the Canadian Evidence on Gender Wage Differentials," Canadian Journal of Economics, 27(4): 918-938. Leck, J. 2002. “Making Employment Equity Programs Work for Women,”Canadian Public
Policy this issue.
Lowe, G. S. 1987. Women in the Administrative Revolution. Toronto: University of Toronto Press.
MacKinnon, M. 1999. “Canadian Women at Work in 1901: Implications for the Pay Equity Debate,” Unpublished manuscript, Department of Economics, McGill University, Montreal, Canada.
Massicotte, P. 1982. “Histoire de la corporation des instituteurs et institutrices catholiques de la Porvince de Québec, de 1943 à 1966,” Université de Montréal (unpublished M.A. thesis).
Meltz, N. 1965. Changes in the Occupational Composition of the Canadian Labour Force, 1931-1961. Occasional paper no.2, Economics and Research Branch, Department of Labour, Canada.
Meltz, N. 1969. Manpower in Canada: 1931 to 1961- Historical Statistics of the Canadian Labour Force. Research Branch, Department of Manpower and Immigration, Canada. Moore, G. 1985. “Horizontal and Vertical: the Dimensions of Occupational Segregation by
Gender in Canada.” Canadian Research Institute for the Advancement of Women. Oaxaca R. L. and M. R. Ransom. 1994. “On Discrimination and the Decomposition of Wage
Differentials,” Journal of Econometrics, 61(1): 5-21.
Organization for Economic Co-Operation and Development. 1998. The Future of Female-Dominated Occupations. Paris: OECD.
Palmer, B. 1992. Working Class Experience, 2nd edition. Toronto: McClelland and Stewart. Polachek, S. W. 1987. “Occupational Segregation and the Gender Wage Gap,” Population
Research and Policy Review 6 (1): 47-67.
Prentice, A., et al. 1996. Canadian Women – A History, 2nd edition. Toronto: Harcourt Brace. Reilly, K. T. and T. S. Wirjanto. 1999. “Does More Mean Less? The Male/Female Wage Gap
and the Proportion of Females at the Establishment Level,” Canadian Journal of Economics 3 (4): 906-929.
Sorensen, E. 1990. “The Crowding Hypothesis and Comparable Worth,” Journal of Human Resources 25 (1): 55-89.
Treiman, D. and H. Hartmann, eds. 1981. Women, Work, and Wages: Equal Pay for Jobs of Equal Value. Washington, D.C.: National Academy of Sciences Press.
Endnotes
1
We wish to thank David Gray and Gillian Hamilton for helpful comments and suggestions, and Quynh Van Tran and Sarah McLean for excellent research assistance. Financial support was provided by CIRANO, HRDC and SSHRC (Fortin: Grant no. 410-99-0959; Huberman: Grant no. 410-98-0125). All opinions expressed in this paper are those of the authors.
2
For an analysis of the effects of changes in socio-economic characteristics on labour market outcomes, see Gunderson (1998).
3
We note that women are only one of the many groups targeted by employment equity.
4
The source for this is www.feminist.com.
5In Canada, by contrast with the United States, Baker and Fortin (1999) find that the
femaleness of occupations has had little effect on the wages of women.
6
Anker (1997) points to the difficulty of differentiating between vertical and horizontal segregation on the basis of the classification codes that have been adopted. We address this difficulty by limiting horizontal comparisons to occupations requiring similar levels of educational attainment.
7We note that, using a different methodology, Kidd and Shannon (1994) also found that almost
all of the observed 1989 gender wage gap was the result of intra-occupational differences in the wages of men and women.
8Altman and Lamontage (1996) use the censuses of manufacturing for the years 1900, 1910,
1915 and 1930. These data excluded small firms up to 1930.
9
In 1961, only 0.1 per cent of women were listed as physicians and surgeons, osteopaths and chiropractors, compared to 0.45 per cent for men.
10
Meltz (1965) reports that in 1951 the median number of years of schooling was 10.6 for clerical workers, as compared with 12.4 years for professional occupations.
11
Meltz (1965) reports that the median number of years of schooling for males and females in both manufacturing, construction and service occupations was 8 in 1951, while the average female annual earnings for clerical, manufacturing and service work were respectively $1546, $1264 and $644 in 1951 dollars.
12
We sample wage and salary workers who are 16-69 years of age, full-time students, and who earn more than $1.00 an hour from the November rotation of the 1997 and 1998 LFS. Wages are obtained from the main job at this time; they are the actual hourly wage for workers paid by the hour and the usual hourly earnings for other workers. Hourly wages are in 1997 dollars. We note that 1997 if the first year where questions about wages were asked in the Labour Force Survey.
13
For example, Drolet (2001) reports that in 1996, the average number of hours worked per week was 43.6 hours among FTFY men and 39.6 hours among FTFY women.
14
The Labour Force Survey of 1997 and 1998 does question respondents about the number of weeks unemployed and the number of weeks absent from work. It is not possible, however, to infer the number of weeks worked.
15
The comparison of the 1961 Census and the 1997/98 Labour Force Survey runs up against several problems. First, there are not “occupations not elsewhere classified” in the LFS data. This implies that our comparisons may carry a margin of error of a few percentage points. Second, the LFS data samples part-year as well as full-year workers.
16
Using Gunderson’s (1998) table 6.6, we compute a similar distribution of sales and services workers that includes part-time workers: 24 per cent among women and 19 per cent among
men in 1971; 25 and 19 per cent among women and men in 1981; and 26 and 20 per cent in 1991 (based on the 1971 Classification Manual).
17
See also OECD (1999), table 2.4. While sales assistants are more than 70 per cent female in France, Germany, Norway, the United Kingdom and the United States, the femaleness reported for Canada is 54 per cent.
18For example, Jacobsen (1998) shows that the Duncan segregation index, calculated from the
1990 U.S. Census, can vary from a value of 33 when 6 job categories are used to a value of 59 with 36,669 categories.
19
The large change in the Duncan index from 1961 to 1971 is more difficult to evaluate because of the changes in the occupation codes between the two censuses.
20The inclusion of part-time workers does not change this gap much (17.2 instead of 17.1).
However, the gap measured in average weekly earnings of full-time workers is 23 per cent, reflecting gender differences in the number of hours worked per week among full-time workers.
21
If, anything we find a modest – and negative – correlation between the relative pay gap by detailed occupations and the femaleness of the occupation.
22
While average female clerical earnings represent 121 per cent of average female non-clerical earnings in 1961, that proportion was down to 97 per cent in 1971, 87 per cent in 1981 and 84 per cent in 1991.
23
For the United States, in 1961, 18.3 per cent of union members were women; in 1971 the figure was 20.7 per cent (Bergquist 1974).
24We note that the substantial between-occupation-classes component of the gender wage gap
Fortin 2001). This component can be generated by a negative effect of gender composition on male wages.
25
These reports are available at http://info.load-otea.hrdc-drhc.gc.ca/~eeisadmin/cgi-bin/INTRO.cgi .
26
The 1997/98 distribution that includes part-time workers puts the share at 19 per cent.
27As indicated in table 2d, teaching and related occupations was the category with the highest
average female earnings in 1991.
28
Industrial segregation links blue collar work with the secondary sector and white collar work with the tertiary or services sector. In addition, even within manufacturing, Carrington and Troske (1998) point out to much gender segregation by establishment.
29
Groshen (1991) first described the identification problems in trying to explain the lower wages of women: “Is it who you are, what you do, or where you work?” Studies (Baker and Fortin 2001) of the impact of occupational gender segregation on wages deal with the second question. Studies of the impact of gender segregation by establishment or industry (Reilly and Wirjanto 1999) deal with the third. Groshen's finding of the predominance of the “what you do” has been revisited in Bayard et al. (1999) using employer-employee matched data sets; the latter favours the “who you are” explanation.
30We note that a high level of occupational gender segregation is not incompatible with a small
Table 1. Distribution of Female and Male Workforce – 1901-1961 Occupation Category 1901 1911 1921 1931 1941 1951 1961
Women
White-Collar 23.6 29.9 47.9 45.4 44.6 55.4 57.4
Proprietary and Managerial 1.2 1.6 2.0 1.6 2.0 3.0 2.9 Professional 14.7 12.5 19.0 17.7 15.6 14.4 15.6
Clerical 5.3 9.1 18.5 17.7 18.3 27.4 28.6
Commercial and financial 2.4 6.7 8.4 8.4 8.7 10.6 10.3
Manual 30.6 28.0 21.1 16.9 18.5 19.4 13.3
Manufacturing and mechanical 29.6 26.4 18.0 12.7 15.4 14.6 9.9
Construction * * * * * 0.1 *
Labourers 0.5 0.1 0.1 1.8 1.4 1.8 1.2
Transportation and communication 0.5 1.5 3.0 2.4 1.7 2.9 2.2
Service 42.0 37.6 27.0 34.0 34.4 21.3 22.5
Personal 42.0 37.5 26.0 33.9 34.3 21.1 22.2
Protective and other * 0.1 1.0 0.1 0.1 0.2 0.3
Primary 3.8 4.5 3.7 3.7 2.3 2.8 4.3
Not stated - - 0.3 * 0.2 1.1 2.5
Men
White-Collar 14.1 14.8 21.0 20.2 20.4 25.8 31.4
Proprietary and Managerial 4.8 5.0 8.2 6.4 6.2 8.8 9.8
Professional 3.1 2.4 2.9 3.7 4.5 5.4 7.9
Clerical 2.9 3.0 4.7 4.4 4.5 6.0 6.9
Commercial and financial 3.3 4.4 5.2 5.7 5.2 5.6 6.8
Manual 32.2 37.3 33.1 37.2 37.2 42.9 43.2
Manufacturing and mechanical 13.8 11.7 10.2 11.3 16.2 18.2 18.8
Construction 5.4 5.5 5.5 5.6 5.8 7.2 7.3
Labourers 8.2 13.8 11.4 13.2 7.6 8.1 7.1
Transportation and communication 5.1 6.3 6.0 7.1 7.5 9.4 10.0
Service 2.9 3.1 3.4 4.1 4.6 4.9 6.3
Personal 2.6 2.8 2.1 3.0 3.2 3.4 4.3
Protective and other 0.3 0.3 1.3 1.1 1.4 1.5 2.0
Primary 50.5 44.8 42.3 38.5 37.6 25.1 16.4
Not stated - - 0.2 * 0.3 1.3 2.7
Source: Meltz, N. (1969) Manpower in Canada: 1931 to 1961- Historical Statistics of the Canadian Labour Force, Tables A.2-A.3.
Note: * less than 0.05 per cent - None
Table 2a. Distribution of Full-Time Full-Year Female and Male Workforce, Average Annual Earnings, Femaleness Rates and Male/Female Earnings Gap -1961
Percent Average Percent Average Percent Male/ Occupation Category of Female Female of Male Male Female Female
Workforce Earnings Workforce Earnings Gap
Managerial, Administrative and Related Occ.
0.030 3058 0.109 6425 0.084 0.524
Occ. in Natural Sciences, Engineering 0.010 3030 0.046 5625 0.069 0.461 and Mathematics
Occ. in Social Sciences and Related Fields 0.007 2978 0.009 4066 0.215 0.268 Teaching and Related Occ. 0.068 3394 0.016 5679 0.586 0.402 Occ. in Medicine and Health 0.092 2140 0.010 4213 0.751 0.492 Artistic, Literary and Related Occ. 0.006 2655 0.007 4778 0.204 0.444 Clerical and Related Occupations 0.416 2339 0.102 3389 0.577 0.310
Sales Occupations 0.071 1422 0.083 3910 0.223 0.636
Service Occupations 0.146 1146 0.105 3333 0.318 0.656 Farming, Fishing, Forestery and Mining 0.002 653 0.044 2595 0.012 0.748 and Related Occupations
Processing and Machining Occupations 0.043 2058 0.129 3804 0.100 0.459 Product Fabricating Occ., other than
Textile
0.007 1852 0.067 3441 0.035 0.462
Textile Product Fabricating Occupations 0.058 1597 0.010 2871 0.650 0.444 Construction trades occupations 0.006 2360 0.117 3502 0.017 0.326 Transport operating occupations 0.001 1641 0.065 3587 0.003 0.542 Material handling occupations 0.018 1652 0.019 2678 0.241 0.383 Equipment operating occupations 0.006 2098 0.015 4376 0.125 0.520 Occupations not elsewhere classified 0.013 1642 0.047 2792 0.087 0.412
All 1.00 2104 1.00 3936 0.251 0.465
Source: Dominion Bureau of Statistics. 1964, 1961 Census of Canada - Labour Force, Vol. III part 3. Catalogue 94-533. Table 21.
Table 2b. Distribution of the Full-Time Full-Year Female and Male Workforce, Average Annual Earnings, Femaleness Rates and Male/Female Earnings Gap –1971
Percent Average Percent Average Percent Male/ Occupation Category of Female Female of Male Male Female Female
Workforce Earnings Workforce Earnings Earnings Gap
Managerial, Administrative and Related Occ.
0.035 6957 0.086 13544 0.138 0.486
Occ. in Natural Sciences, Engineering 0.007 6679 0.044 10441 0.057 0.360 and Mathematics
Occ. in Social Sciences and Related Fields 0.020 6194 0.014 11170 0.363 0.445 Teaching and Related Occ. 0.075 7341 0.021 9587 0.585 0.234 Occ. in Medicine and Health 0.098 5640 0.018 16346 0.686 0.655 Artistic, Literary and Related Occ. 0.008 6160 0.011 8787 0.221 0.299 Clerical and Related Occupations 0.369 4690 0.084 7069 0.632 0.336
Sales Occupations 0.067 3960 0.115 8380 0.186 0.527
Service Occupations 0.122 3326 0.097 6685 0.331 0.502 Farming, Fishing, Forestery and Mining 0.006 2906 0.033 6456 0.067 0.550 and Related Occupations
Processing and Machining Occupations 0.030 4082 0.106 7244 0.100 0.437 Product Fabricating Occ., other than
Textile
0.014 4368 0.069 7238 0.074 0.397
Textile Product Fabricating Occupations 0.039 3399 0.008 5510 0.673 0.383 Construction trades occupations 0.001 5518 0.088 7842 0.007 0.296 Transport operating occupations 0.002 4429 0.061 7286 0.126 0.392 Material handling occupations 0.014 3969 0.026 7038 0.178 0.436 Equipment operating occupations 0.005 4340 0.020 8204 0.096 0.471 Occupations not elsewhere classified 0.086 4093 0.101 7011 0.252 0.416
All 0.998 4756 1.002 8276 0.282 0.425
Source: Statistics Canada. 1975. 1971 Census of Canada- Income of Individuals, Vol. III part 6. Catalogue 94-767. Table 18.