Pioglitazone Use in Combination with Insulin in
the Prospective Pioglitazone Clinical Trial in
Macrovascular Events Study (PROactive19)
Bernard Charbonnel, Ralph DeFronzo, Jaime Davidson, Ole Schmitz, Kare Birkeland, Valdis Pirags, and Andre´ Scheen, on behalf of the PROactive investigators
Clinique d’Endocrinologie, Maladies Metaboliques, et Nutrition (B.C.), 44093 Nantes, France; Diabetes Division (R.D.), The University of Texas Health Science Center, San Antonio, Texas 78229; Medical City Hospital (J.D.), Dallas, Texas 75230; Department of Medicine M (Endocrinology and Diabetes) (O.S.), Århus Kommunehospitalet, DK-8000 Aarhus, Denmark; Department of Clinical Endocrinology (K.B.), Aker University Hospital, 0514 Oslo, Norway; Department of Internal Medicine (V.P.), Paula Stradina Kliniska Universitates Slimnica, 1002 Riga, Latvia; and Division of Diabetes, Nutrition, and Metabolic Disorders (A.S.), Department of Medicine, University of Lie`ge, 4000 Lie`ge, Belgium
Objective: In this post hoc analysis, we examined insulin requirements and regimens, glycemic control, cardiovascular outcomes, and safety in the patients treated with insulin at baseline in the Prospective Pioglitazone Clinical Trial in Macrovascular Events study.
Design: The Prospective Pioglitazone Clinical Trial in Macrovascular Events study was a double-blind, placebo-controlled outcome study (mean follow-up 34.5 months) in 5238 high-risk patients with type 2 diabetes randomized to pioglitazone (force titrated to 45 mg) or placebo. One third of the total population (pioglitazone 864; placebo 896) were receiving insulin at baseline. Results: A rapid and sustained decrease in insulin dose was observed with pioglitazone vs. a progressive increase with placebo. By study end, the mean insulin dose was lower with pioglitazone (42 vs. 55 U/d with placebo; P⬍ 0.0001). The insulin regimen (number on insulin, need for multiple injections, and reduction in oral agents) had been simplified vs. placebo; nevertheless, a greater glycosylated hemoglobin reduction was observed with pioglitazone (⫺0.93%) vs. placebo (⫺0.45%; P ⬍ 0.0001). At the final visit, insulin had been discontinued in 9% of pioglitazone vs. 2% of placebo patients (P⬍ 0.0001). More insulin-resistant patients (defined as poorly controlled type 2 diabetes despite high doses of insulin) in the pioglitazone plus insulin group showed the greatest glycosylated hemoglobin decline. There were nonsignificant reductions with pioglitazone relative to placebo in the cardiovascular primary (hazard ratio 0.86; 95% confidence interval 0.71, 1.04; P⫽ 0.1198) and main secondary (hazard ratio 0.85; 95% confidence interval 0.67, 1.08; P⫽ 0.1831) end points in insulin-treated patients. The rates of overall heart failure, edema, and hypoglycemia were higher with pioglitazone [13.5 vs 10.5% (P⫽ 0.0489); 30.8 vs. 18.2% (P ⬍ 0.0001); and 42.1 vs 29.0% (P⬍ 0.0001), respectively], but there were no significant differences in serious events.
Conclusions: Pioglitazone use in combination with insulin resulted in a sustained improved glycemic control and allowed the treatment regimens to be simplified and the insulin doses reduced. (J Clin Endocrinol Metab 95: 0000 – 0000, 2010)
ISSN Print 0021-972X ISSN Online 1945-7197 Printed in U.S.A.
Copyright © 2010 by The Endocrine Society
doi: 10.1210/jc.2009-1974 Received September 16, 2009. Accepted February 18, 2010.
Abbreviations: CI, Confidence interval; HbA1c, glycosylated hemoglobin; IDF, International
Diabetes Federation; PROactive, Prospective Pioglitazone Clinical Trial in Macrovascular Events.
O R I G I N A L A R T I C L E E n d o c r i n e C a r e
J Clin Endocrinol Metab, May 2010, 95(5):0000 – 0000 jcem.endojournals.org 1
T
ype 2 diabetes is a progressive disease characterized by insulin resistance and diminished insulin secretion (1). Neither sulfonylureas nor metformin has a long-term effect to preserve ß-cell function, and many patients with type 2 diabetes fail to reach target [glycosylated hemoglo-bin (HbA1c)⬍7.0%], despite combined metformin/sulfo-nylurea therapy (2–5). Hence, many patients with type 2 diabetes will eventually require insulin therapy.Insulin therapy is commonly initiated as a once-daily basal insulin injection, with the addition of rapid-acting insulin with dose and number of injections based on the height of postprandial glucose excursions (6). A step-wise insulin optimization strategy frequently includes appro-priate combination with oral agents to improve glycemic control and reduce the dose of insulin (7). Thiazo-lidinediones are oral glucose-lowering agents that reduce insulin resistance in liver and muscle (8). A number of studies have shown the benefits of a thiazolidinedione and insulin in combination (9 –16).
Prospective Pioglitazone Clinical Trial in Macrovascular Events (PROactive) evaluated the effects of long-term treat-ment with pioglitazone on cardiovascular events in a popu-lation of 5238 patients with type 2 diabetes at high risk for macrovascular events (17). The primary measure of efficacy was time to analysis for a composite end point comprising seven cardiovascular-related events. Patients entered the study on their existing glucose-lowering therapies, which were continued. This paper reports an exploratory analysis evaluating long-term insulin requirements, insulin regimens, glycemic control, cardiovascular outcomes, and safety in the 1760 patients who entered PROactive on insulin therapy.
Subjects and Methods Study design
PROactive was a randomized, double-blind, multicenter, pla-cebo-controlled, parallel-group study in 5238 patients with type 2 diabetes and a history of macrovascular disease. Details of enrollment and trial conduct have been published (17). All par-ticipants provided written informed consent. A brief summary of the inclusion and exclusion criteria will be presented in the fol-lowing paragraphs.
To be eligible for randomization, patients had to be adults (aged 35–75 yr, inclusive) with type 2 diabetes (defined as an HbA1clevel above the upper limit of normal, i.e. the local equiv-alent of 6.5% for a diabetes control and complications trial trace-able assay) and an established history of macrovascular disease (17). Current use of pioglitazone or other thiazolidinediones, and insulin monotherapy for 2 wk or longer at any time in the previous 3 months excluded subjects from entry into the study. However, insulin-treated patients were eligible if insulin was combined with oral agents.
Patients were randomized to 45 mg pioglitazone or placebo in addition to the existing background glucose-lowering therapies (including diet and exercise). The dose of pioglitazone could be
increased or decreased within the range of 15– 45 mg throughout the study: more than 90% of patients who remained on study medication received 45 mg pioglitazone. Treatment random-ization was not stratified by existing glucose-lowering treat-ment, and all investigators were encouraged to adjust and/or add glucose-lowering agents to achieve and maintain 1999 Inter-national Diabetes Federation (IDF) targets (HbA1c⬍7.0%). Therefore, it was anticipated that background treatment would change over the course of the study. Patients also con-tinued with existing therapy for hypertension, dyslipidemia, and thrombotic conditions to reduce cardiovascular risk (ad-justed again using the 1999 IDF guidelines).
Efficacy end points
In the main PROactive study, the primary end point was the time to the first occurrence of cardiovascular events or death; these data have been published (17).
This manuscript reports post hoc data from the patients who were receiving insulin at baseline. The analyses performed were changes in the percentages of patients remaining on insulin ther-apy vs. switching to oral agents/discontinuing insulin; changes in the insulin regimens (i.e. in number of injections); changes in mean daily insulin dosage; glycemic control (HbA1cover time), cardiovascular end points; and safety data in patients receiving insulin therapy at baseline. We also conducted an analysis of the glycemic control and insulin dose changes in patients categorized as more insulin-resistant (defined as baseline insulin dose and HbA1cboth median or greater) compared with less insulin-re-sistant patients (defined as baseline insulin dose and HbA1cboth less than median) as a potential index of insulin sensitivity. The median insulin dose at baseline was 42 U/d and the median HbA1cwas 8.3%.
Statistical methods
The main statistical and analytical methods have been de-scribed previously (17). The data presented here are from the intention-to-treat population of patients (defined as all random-ized patients who subsequently took at least one dose of study medication) who were receiving insulin at the time of entry into the study.
Concomitant glucose-lowering medication was recorded at baseline and at each subsequent visit by class (insulin, met-formin, sulfonylureas, others) and dose. Statistical methods for summarizing concomitant glucose-lowering medication consid-ered the percentage of patients (in the pioglitazone and placebo treatment groups) receiving each type of medication. Mean dose by visit, change from baseline in percentage of patients with a medication dose increase or decrease, and percentage of patients newly starting, continuing, stopping, or decreasing medication were considered.
Changes from baseline to final visit in HbA1cwere calculated for each of two cohorts (patients receiving and patients not re-ceiving insulin) and compared by treatment group. For HbA1c, the differences between treatment groups and changes from baseline were examined by visit and compared using ANOVA. An area under the curve measure (linear interpolation and ad-justment for duration of exposure) was used as an aggregate measure of HbA1c. The comparative effect of the study treat-ments on time to permanent insulin use was estimated by cal-culating the hazard ratio and corresponding 95% confidence interval (CI) from a Cox proportional hazards survival model,
with treatment as the only covariate. The standard threshold of
P⬍ 0.05 was used to define a significant result.
Results
Baseline demographics and characteristics
At baseline, one third of the total study population [n⫽ 1760 patients; 864 (33.2%) in the pioglitazone group and 896 (34.0%) in the placebo group] was receiving insulin. There were some differences in baseline data between those receiving and those not receiving insulin (Table 1). Although there were differences in baseline character-istics between the patients with vs. without insulin, there were no important differences between patient character-istics and baseline laboratory data between the insulin-treated patients in the pioglitazone group and those in the placebo group. Similarly, there were no relevant differ-ences between non-insulin-treated patients in the piogli-tazone group vs. the placebo group (Table 1).
At baseline, the mean daily insulin dose was 46.6 U and the mean number of insulin injections per day was 2.3 (23.4% were receiving one injection; 47.6%, two injec-tions; and 29.0%, three or more injections). There were no important differences in insulin doses or regimens between the pioglitazone and placebo groups (data not shown).
At baseline, concomitant medications in the insulin-treated groups were: metformin, 52.9%; sulfonylurea, 24.3%; metformin plus sulfonylurea, 12.0%; other oral agents as monotherapy or combination, 10.8%. These percentages were similar in the pioglitazone and placebo groups.
Glycemic control
Both treatment groups showed an improvement in gly-cemic control. Mean HbA1clevels decreased from 8.4 to 7.4% in the pioglitazone group and from 8.5 to 8.1% in the placebo group (P⬍ 0.001 vs. baseline for both groups;
P⬍ 0.0001 between groups at all time points; Fig. 1A).
The improvement in HbA1cwith pioglitazone was inde-pendent of the baseline insulin regimen (i.e. the number of injections or daily dose of insulin). The HbA1cdecreases from baseline to the final visit with pioglitazone vs. pla-cebo were 0.84 vs. 0.22% for patients receiving one; 1.02
vs. 0.44% for patients receiving two; and 0.82 vs. 0.56%
for patients receiving three insulin injections at baseline. At end point, the proportion of patients achieving good glycemic control (mean HbA1cⱕ7.0%) was 41.7% (n ⫽ 308) with pioglitazone vs. 24.3% with placebo (n⫽ 188).
Changes in doses of insulin
In the patients who were on insulin at baseline, the mean daily dose of insulin decreased in the pioglitazone
group, beginning at the first study visit and continued throughout the study (Fig. 1B). The mean daily insulin dose initially remained stable in the placebo group, but by month 6, the daily insulin dose steadily increased through-out the study. By final visit, the mean insulin dose had decreased from 46.5 U at baseline to 42.1 U/d in the pio-glitazone group compared with an increase from 46.7 U to 54.9 U/d in the placebo group (P⬍ 0.0001 between group difference). These differences in insulin dose between pio-glitazone and placebo were shown for any insulin regimen.
Changes in treatment regimens
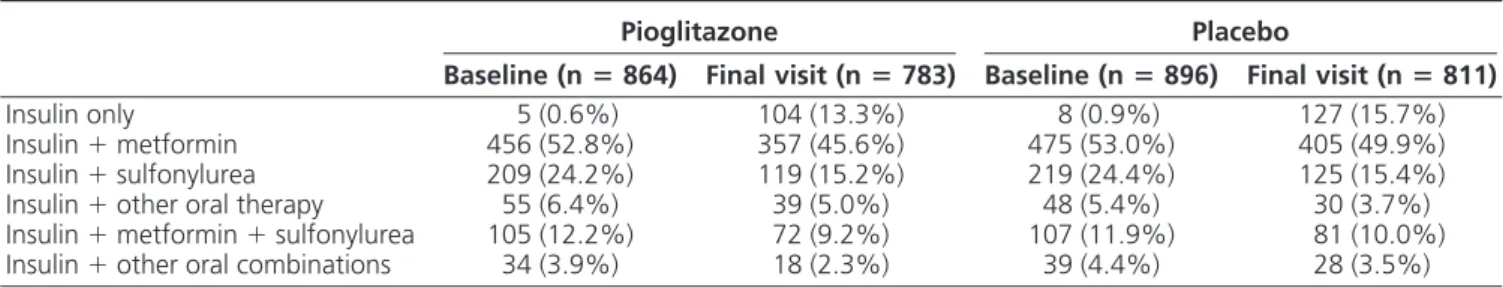
Background treatments for diabetes were not con-trolled for and investigators were encouraged to treat to 1999 European IDF glycemic goals. As expected, the back-ground glucose-lowering treatments shifted throughout the course of the study. There were no major differences between groups for the use of oral agents combined with insulin over time (Table 2). Nevertheless, significantly more insulin-treated patients receiving pioglitazone dis-continued concomitant oral agents (such as metformin or a sulfonylurea) than those receiving placebo. The percent-age of patients who discontinued insulin therapy from baseline to the end of the study was greater in the piogli-tazone group than the placebo group [8.6% (n⫽ 74) vs. 1.7% (n ⫽ 15) P ⬍ 0.0001]. Moreover, the number of insulin injections per day increased significantly on pla-cebo compared with pioglitazone. The number of insulin injections per day increased significantly in placebo pa-tients treated with one, two, or three or more injections per day compared with the pioglitazone group (Table 3). Of note, the percentage of patients receiving two or three or more injections per day at final visit decreased signifi-cantly in the pioglitazone group (P⬍ 0.01).
Changes in doses or regimen of insulin according to insulin sensitivity
In the patients categorized as less insulin resistant at baseline (according to their insulin doses and HbA1cboth less than median), the mean baseline HbA1cwas 7.3% and
insulin dose was 24 U/d vs. 9.6% and 69 U/d in the more insulin-resistant patients (according to their insulin doses and HbA1c both median or greater). These two groups appear to have different insulin needs and behave differ-ently on pioglitazone.
In the less insulin-resistant patients, the insulin dose increased from 24 to 34 U in the placebo group, with no increase of insulin dose in the pioglitazone group. HbA1c
was more or less stable, with a slight 0.3% decline in the pioglitazone group, whereas it increased slightly in the placebo group by 0.2% (P⬍ 0.0001). In the more insulin-resistant patients, HbA1cdecreased by 1.3% from 9.6 to
TABLE 1. Patient characteristics by treatment in those with type 2 diabetes and cardiovascular disease receiving insulin vs. those not receiving insulin at baseline in the PROactive study Receiving any combination of insulin Not receiving insulin Pioglitazone (n ⴝ 864) Placebo (n ⴝ 896) Pioglitazone (n ⴝ 1741) Placebo (n ⴝ 1737) Patient characteristics Male, n (%) 503 (58.2%) 547 (61.0%) 1232 (70.8%) 1181 (68.0%) Caucasian, n (%) 854 (98.8%) 887 (99.0%) 1710 (98.2%) 1713 (98.6%) Age (yr) 61.7 ⫾ 7.5 61.2 ⫾ 7.5 62.0 ⫾ 7.6 61.8 ⫾ 7.9 Duration of diabetes (yr) 12.8 ⫾ 7.1 13.1 ⫾ 7.1 7.8 ⫾ 6.2 7.8 ⫾ 6.4 Body mass index (kg/m 2 ) 31.6 ⫾ 4.7 31.9 ⫾ 4.7 30.3 ⫾ 4.7 30.6 ⫾ 4.8 History of hypertension, n (%) 658 (76.2%) 695 (77.6%) 1289 (74.0%) 1310 (75.4%) Smoking Current, n (%) 93 (10.8%) 103 (11.5%) 247 (14.2%) 278 (16.0%) Past, n (%) 381 (44.1%) 392 (43.8%) 818 (47.0%) 767 (44.2%) Microvascular disease, n (%) a 544 (63.0%) 537 (59.9%) 569 (32.7%) 539 (31.0%) Laboratory values HbA 1c (%) 8.4 ⫾ 1.4 8.5 ⫾ 1.4 7.9 ⫾ 1.4 7.9 ⫾ 1.4 Systolic blood pressure (mm Hg) 144 ⫾ 17.6 144 ⫾ 17.6 143 ⫾ 17.8 143 ⫾ 17.9 Diastolic blood pressure (mm Hg) 82 ⫾ 9.8 82 ⫾ 9.7 83 ⫾ 10.0 84 ⫾ 9.3 Triglycerides [mg/dl (mmol/liter)] 207 ⫾ 212 (2.34 ⫾ 2.4) 198 ⫾ 159 (2.24 ⫾ 1.8) 193 ⫾ 142 (2.18 ⫾ 1.6) 199 ⫾ 159 (2.25 ⫾ 1.8) HDL cholesterol [mg/dl (mmol/liter)] 45.2 ⫾ 11.6 (1.17 ⫾ 0.3) 44.8 ⫾ 11.6 (1.16 ⫾ 0.3) 44.4 ⫾ 11.6 (1.15 ⫾ 0.3) 44.8 ⫾ 11.6 (1.16 ⫾ 0.3) LDL cholesterol [mg/dl (mmol/liter)] 114 ⫾ 38.6 (2.96 ⫾ 1.0) 114 ⫾ 38.6 (2.94 ⫾ 1.0) 114 ⫾ 34.7 (2.95 ⫾ 0.9) 115 ⫾ 38.6 (2.99 ⫾ 1.0) LDL cholesterol to HDL cholesterol ratio 2.68 ⫾ 1.1 2.67 ⫾ 1.1 2.68 ⫾ 0.9 2.69 ⫾ 1.0 Values represent the mean ⫾ SD unless otherwise specified. HDL, High-density lipoprotein; LDL, low-density lipoprotein. aInvestigator-diagnosed retinopathy, nephropathy, and neuropathy.
The decrease in HbA1c in these patients was largely accounted for by an improvement in the pioglitazone-treated patients, with a mean decrease from 9.5 to 7.9%, despite a mean decrease in insulin units of 11 U/d from 68 to 57 U/d. In the placebo group, the decrease in HbA1cwas significantly less (from 9.6 to 8.6%), despite a mean in-crease in insulin dose of 7 U from 69 to 76 U/d (both P⬍ 0.001 between treatment group difference), associated with the intensification of the insulin regimen.
Cardiovascular primary and main secondary end points
As in the total PROactive patient population (17), there was a consistent trend of benefit with pioglitazone in the insulin-treated patients with respect to the primary end
point (event rate of 20.7% with pioglitazone vs. 24.3% with placebo; hazard ratio 0.86; 95% CI 0.71, 1.04; P⫽ 0.1198; Fig. 2A). There was a similar nonsignificant 15% risk reduction with pioglitazone in the main secondary end point, a composite of death, nonfatal myocardial infarc-tion, and stroke (event rate of 13.5% with pioglitazone vs. 15.8% with placebo; hazard ratio 0.85; 95% CI 0.67, 1.08; P⫽ 0.1831; Fig. 2B).
Safety and tolerability
There were more serious adverse events (both end point and non-end point events) in patients treated with insulin (52.2%) vs. those not receiving insulin (44.9%; P ⬍ 0.0001). Heart failure rates were significantly higher in insulin-treated (12.0%) than non-insulin-treated patients (7.7%; P⬍ 0.0001). There were no significant differences in rates of serious heart failure (defined as requiring hos-pitalization or prolongation of a hoshos-pitalization stay, fatal or life threatening, or resulted in persistent significant dis-ability or incapacity; 5.7% in the insulin group and 4.5% in the no insulin group) or of fatal heart failure (1.3% in the insulin group and 0.7% in the no insulin group). As expected, there were higher rates of all hypoglycemia (35.5 vs. 18.4%; P⬍ 0.0001), serious hypoglycemia (1.3
vs. 0.3%; P⬍ 0.001), and edema (24.4 vs. 20.2%; P ⫽
0.005) in the insulin group than the no-insulin group. The relative occurrence of adverse events in the piogli-tazone group compared with the placebo group was sim-ilar in these insulin-treated patients as in the total PRO-active population (17). Serious adverse events occurred in 434 patients (50.2%) in the pioglitazone group and 484 (54.0%) in the placebo group (P⫽ NS). There were no differences in the safety profiles in the pioglitazone and placebo groups (with or without other treatments) in those receiving insulin at baseline, with the exception of edema and hypoglycemia (Table 4). The rates of hypoglycemia were the same, irrespective of baseline sulfonylurea use (Table 4).
There were no significant differences in the incidence of serious (i.e. requiring hospitalization) or fatal heart failure between the pioglitazone and placebo groups in the
pa-TABLE 2. Glucose-lowering regimens by treatment at baseline and final visit in those receiving insulin at baseline
Pioglitazone Placebo
Baseline (nⴝ 864) Final visit (n ⴝ 783) Baseline (n ⴝ 896) Final visit (n ⴝ 811)
Insulin only 5 (0.6%) 104 (13.3%) 8 (0.9%) 127 (15.7%) Insulin⫹ metformin 456 (52.8%) 357 (45.6%) 475 (53.0%) 405 (49.9%) Insulin⫹ sulfonylurea 209 (24.2%) 119 (15.2%) 219 (24.4%) 125 (15.4%) Insulin⫹ other oral therapy 55 (6.4%) 39 (5.0%) 48 (5.4%) 30 (3.7%) Insulin⫹ metformin ⫹ sulfonylurea 105 (12.2%) 72 (9.2%) 107 (11.9%) 81 (10.0%) Insulin⫹ other oral combinations 34 (3.9%) 18 (2.3%) 39 (4.4%) 28 (3.5%)
FIG. 1. Changes in glycemic control (A) and insulin dose (B) over time with pioglitazone or placebo in patients receiving insulin at baseline (open squares, pioglitazone; closed squares, placebo).
tients who were receiving any insulin combination at base-line (Table 4).
There was a 4.2-kg increase in body weight from base-line to final visit in insulin-treated patients in the piogli-tazone group, whereas there was a decrease of 0.1 kg from baseline to final visit in the placebo group (P⬍ 0.0001 between group difference). Most of the weight gain with pioglitazone occurred in the first year and weight pla-teaued by the end of the second year. The increase in body weight in insulin-treated patients receiving pioglitazone were correlated (r⫽ ⫺0.12, P ⫽ 0.0012) with the decline in HbA1c.
Discussion
Insulin optimization strategy in type 2 diabetes includes insulin intensification with multiinjections, titration of in-sulin doses, and combination with oral drugs (6). Inin-sulin sensitizers, such as thiazolidinediones, are a good option from the mechanistic point of view and have been proved to work in many short-term studies of insulin-requiring patients with type 2 diabetes, for troglitazone (9 –12), ros-iglitazone (13), and pioglitazone (14 –16). However, large long-term studies are needed both for long-term efficacy and safety issues. This is why this exploratory analysis of the large cohort of 1760 patients entering PROactive on insulin therapy may be of interest.
This analysis showed an improved glycemic control in pioglitazone-treated compared with placebo-treated
pa-FIG. 2. Kaplan-Meier curve of time to the primary end point (A) and the main secondary end point (B) in the subgroup of patients treated with insulin at baseline.
TABLE 4. Adverse events occurring in insulin-treated patients Receiving any combination of insulin Pioglitazone n (%) Placebo n (%)
Serious adverse events 434 (50.2%) 484 (54.0%) End point event 141 (16.3%) 172 (19.2%) Non-end point event 395 (45.7%) 439 (49.0%) Any report of heart failure 117 (13.5%)a 94 (10.5%)
Serious heart failureb 54 (6.3%) 47 (5.2%)
Fatal heart failure 12 (1.4%) 10 (1.1%) Any report of hypoglycemia
(all groups)
364 (42.1%)c 260 (29.0%)
Seriousb 16 (1.9%) 7 (0.8%)
Nonserious 358 (41.4%)c 253 (28.2%)
Any report of hypoglycemia (baseline sulfonylurea group) 134 (40.6%)c 96 (27.7%) Seriousb 5 (1.5%) 3 (0.9%) Nonserious 129 (39.1%)c 93 (26.9%) Edema 266 (30.8%)c 163 (18.2%) Seriousb 4 (0.5%) 2 (0.2%) Nonserious 265 (30.7%)c 163 (18.2%) Serious pneumoniab 25 (2.9%) 21 (2.3%) a P⬍ 0.05 vs. placebo.
bDefined as requiring hospitalization or prolongation of a
hospitalization stay, fatal or life-threatening, or resulted in persistent significant disability or incapacity.
c
P⬍ 0.001 vs. placebo.
TABLE 3. Change in dose of insulin from baseline to final visit according to the number of injections per day at
baseline Pioglitazone Placebo Between-group difference Baseline (nⴝ 864) Final visit (nⴝ 783) Baseline (nⴝ 896) Final visit (nⴝ 811)
One injection, daily dose (U) 20.4 26.3 19.6 34.1 P⫽ 0.002
Tywo injections, daily dose (U) 48.2 41.6 47.4 53.2 P⬍ 0.0001
tients. Both treatment groups (pioglitazone and placebo) improved glycemic control in this subgroup of patients receiving insulin at baseline. However, pioglitazone pro-vided sustained and significantly better glycemic control than placebo at all time points, irrespective of baseline insulin regimen. This benefit was sustained for the dura-tion of the study (mean 34.5 months). Thus, the statisti-cally significant and sustained benefit of pioglitazone vs. placebo on glycemic control that was observed in the total PROactive patient population persisted in this group of insulin-treated patients. A higher percentage of pioglita-zone-treated patients discontinued insulin therapy, 8.6 vs. 1.7%. Whereas the insulin regimen intensified and the mean daily insulin dose increased in the placebo group, there was a decrease in mean daily insulin dose and a simplification of the glucose-lowering regimen in the pio-glitazone group. There were minor changes in the number of insulin injections in the pioglitazone group along with a shift to a less intensified regimen with respect to the use of concomitant oral drugs in both groups, but this was more marked in the pioglitazone group. This suggests that there was no need for insulin intensification, whereas there was a major intensification of the insulin regimen in the placebo group, more patients on multiple injections, and higher doses of insulin (in line with protocol guidelines to achieve glycemic targets). This improvement in glycemic control for simpler insulin regimens and lower doses of insulin was shown with pioglitazone, despite an increase in body weight. Moreover, this increase in body weight in insulin-treated patients receiving pioglitazone was corre-lated with the decline in HbA1c.
To achieve an HbA1c less than 7.0%, most patients
require high-dose (⬎60 U/d) insulin therapy (18, 19). However, many insulin-resistant patients remain poorly controlled, even when receiving high doses of insulin (19, 20). Of note, the improvement in glycemic control (HbA1c
⬍7.0%) with pioglitazone was observed despite a reduc-tion in insulin dose. This supports the use of an insulin-sensitizing agent to optimize insulin action (8, 21) and reduce the daily insulin dose. It is interesting to note that patients with baseline insulin dose and HbA1cboth greater
than median responded better to pioglitazone. In these patients with a high baseline HbA1c, 9.6% or greater,
de-spite relatively high insulin doses, 69 U/d or greater, the HbA1cdecrease shown in the placebo group was logically related to the intensification of insulin treatment, whereas the greater HbA1cdecrease (⫺1.65 vs. ⫺0.92%) on
pio-glitazone was obtained without any change in the insulin regimen and with lower doses of insulin, which suggests that this improvement is related to the insulin-sensitizing action of the drug. Thus, poorly controlled, insulin-treated patients appear to respond well to the addition of
piogli-tazone. It could be argued that insulin doses mainly reflect the physician’s approach more than insulin needs; thus, we used a combined way using both insulin doses and HbA1c greater than the median to define these patients in whom adding pioglitazone to insulin was the most effective. The mechanism by which thiazolidinediones are effective in-volves reduced liver fat and enhanced hepatic insulin sen-sitivity, as recently shown in a small group of patients with a high HbA1c, despite very high mean doses of insulin
greater than 200 U/d (20).
However, aggressive insulin therapy in type 2 diabetes prompts safety concerns regarding the effects of supra-physiological doses of insulin, including hypoglycemia, weight gain, edema, and heart failure (22-24), as recently evidenced in the ACCORD study (25). We also found that there were more events of heart failure, all hypoglycemia, serious hypoglycemia, and edema in patients treated with insulin vs. those not receiving insulin, but there were no significant differences in rates of serious or of fatal heart failure. There were higher rates of edema and hypoglyce-mia and more weight gain in pioglitazone plus insulin group vs. the placebo plus insulin group. The rates of hy-poglycemia were not affected by baseline sulfonylurea use. A key result of this exploratory analysis of PROactive is to show that the cardiovascular trend to benefit conferred by pioglitazone in the total PROactive population (17) per-sisted in the insulin-treated patients.
The lipid profile and the blood pressure profile im-provements on pioglitazone compared with placebo were similar in these insulin-treated patients to those published for the whole PROactive study population (data not shown).
It should be noted that this analysis is limited by its post
hoc nature.
The patients included in PROactive were at high risk of macrovascular disease. The patients included in this anal-ysis appeared to be at even greater risk, including greater risk of heart failure, as evidenced by the number of end point events and as reflected by the baseline characteris-tics: patients who were on insulin at baseline had a higher HbA1cand a longer duration of diabetes, and a greater
percentage of patients had microvascular complications than those not receiving insulin. To the contrary, there was a tendency toward a reduction in recurrent cardiovascular events and deaths in patients in the insulin and pioglita-zone group.
As expected, the rates of hypoglycemia, edema, and heart failure were higher in diabetic patients receiving in-sulin than in those not receiving inin-sulin in our analysis of PROactive data. Serious heart failure occurred more fre-quently in patients who were insulin treated compared with non-insulin-treated patients, irrespective of
pioglita-zone or placebo. This reflects the well-known observation that insulin-treated patients are at higher risk due to the longer duration of diabetes and more severe underlying cardiovascular disease. Importantly, the addition of pio-glitazone in these insulin-treated patients did not show any difference compared with what was published for the whole PROactive study population (17): the rate of seri-ous heart failure was numerically, but nonsignificantly, higher compared with the placebo group, whereas the rel-ative increase of serious heart failure with pioglitazone compared with placebo was not significantly greater in these patients who were receiving any insulin combination at baseline (6.3% in the pioglitazone group and 5.2% in the placebo group) than in the total PROactive population (5.7% in the pioglitazone group and 4.1% in the placebo group). As with the total PROactive population, the rates of fatal heart failure were similar between groups.
In conclusion, in the insulin-treated patients in PRO-active, pioglitazone use resulted in simplified insulin reg-imens, lower doses of insulin and better glycemic control over time, with a similar cardiovascular and safety profile as in the whole study population.
Acknowledgments
This study was designed by the International Steering Commit-tee, who approved the protocol and amendments. The PROac-tive study is registered as an international standard randomized controlled trial (ISRCTN NCT00174993).
Address all correspondence and requests for reprints to: Pro-fessor Bernard Charbonnel, Clinique d’Endocrinologie, Mala-dies Metaboliques, et Nutrition, Centre Hospitalier Universita-ire de Nantes, Hoˆtel Dieu, 1, Place Alexis Ricordeau, 44093 Nantes Cedex 1, France. E-mail: bernard.charbonnel@univ-nantes.fr.
This work was supported by Takeda Pharmaceutical Co. and Eli Lilly and Co.
Presented at the American Diabetes Association 66th Scien-tific Sessions, June 2006, Washington, DC.
Disclosure Summary: B.C. is a member of the PROactive Ex-ecutive Committee and has served as a consultant to Takeda and received travel expenses and payments from Takeda for speaking at meetings. R.D. and J.D. have received research grants from Takeda North America and served as consultants and/or on the Speakers Bureau and Advisory Board for Takeda Pharmaceuti-cals. A.S., K.B., O.S., and V.P. are national principal investiga-tors of the PROactive study. A.S. is also a member of a national advisory board on diabetes sponsored by Eli Lilly.
References
1. Kahn SE 2003 The relative contributions of insulin resistance and -cell dysfunction to the pathophysiology of type 2 diabetes. Dia-betologia 46:3–19
2. U.K. Prospective Diabetes Study Group 1995 U.K. prospective
di-abetes study 16. Overview of 6 years’ therapy of type II didi-abetes: a progressive disease. Diabetes 44:1249 –1258
3. Charbonnel B, Schernthaner G, Brunetti P, Matthews DR, Urquhart R, Tan MH, Hanefeld M 2005 Long-term efficacy and tolerability of add-on pioglitazone therapy to failing monotherapy compared with addition of gliclazide or metformin in patients with type 2 diabetes. Diabetología 48:1093–1104
4. Hanefeld M, Brunetti P, Schernthaner GH, Matthews DR, Charbonnel BH, for the QUARTET Study Group 2004 One-year glycemic control with a sulfonylurea plus pioglitazone versus a sulfonylurea plus metformin in patients with type 2 diabetes. Diabetes Care 27:141–147
5. Kahn SE, Haffner SM, Heise MA, Herman WH, Holman RR, Jones NP, Kravitz BG, Lachin JM, O’Neill MC, Zinman B, Viberti G; ADOPT Study Group 2006 Glycemic durability of rosiglitazone, metformin, or glyburide monotherapy. N Engl J Med 355:2427– 2443
6. Nathan DM, Buse JB, Davidson MB, Heine RJ, Holman RR, Sherwin R, Zinman B 2006 Management of hyperglycemia in type 2 diabetes: a consensus algorithm for the initiation and adjustment of therapy. A consensus statement from the American Diabetes As-sociation and the European AsAs-sociation for the Study of Diabetes. Diabetes Care 29:1963–1972
7. Scheen AJ, Lefe`bvre PJ 1998 Oral antidiabetic agents. A guide to selection. Drugs 55:225–236
8. Yki-Ja¨rvinen H 2004 Thiazolidinediones. N Engl J Med 351:1106 – 1118
9. Buse JB, Gumbiner B, Mathias NP, Nelson DM, Faja BW, Whitcomb RW 1998 Troglitazone use in insulin-treated type 2 diabetic patients. Diabetes Care 21:1455–1461
10. Strowig SM, Avile´s-Santa ML, Raskin P 2004 Improved glycemic control without weight gain using triple therapy in type 2 diabetes. Diabetes Care 27:1577–1583
11. Strowig SM, Avile´s-Santa ML, Raskin P 2002 Comparison of insulin monotherapy and combination therapy with insulin and metformin or insulin and troglitazone in type 2 diabetes. Diabetes Care 25: 1691–1698
12. Yu JG, Kruszynska YT, Mulford MI, Olefsky JM 1999 A compar-ison of troglitazone and metformin on insulin requirements in eu-glycemic intensively insulin-treated type 2 diabetic patients. Diabe-tes 48:2414 –2421
13. Raskin P, Rendell M, Riddle MC, Dole JF, Freed MI, Rosenstock J 2001 A randomized trial of rosiglitazone therapy in patients with inadequately controlled insulin-treated type 2 diabetes. The Rosiglitazone Clinical Trials Study Group. Diabetes Care 24: 1226 –1232
14. Davidson JA, Perez A, Zhang J; The Pioglitazone 343 Study Group 2006 Addition of pioglitazone to stable insulin therapy in patients with poorly controlled type 2 diabetes: results of a double-blind, multicentre, randomized study. Diabetes Obes Metab 8:164 –174 15. Raz I, Stranks S, Filipczak R, Joshi P, Lertoft B, Rastam J, Chow CC,
Shaban J 2005 Efficacy and safety of biphasic insulin aspart 30 combined with pioglitazone in type 2 diabetes poorly controlled on glibenclamide (glyburide) monotherapy or combination therapy: an 18-week, randomized, open-label study. Clin Ther 27:1432–1443 16. Rosenstock J, Einhorn D, Hershon K, Glazer NB, Yu S 2002 Efficacy and safety of pioglitazone in type 2 diabetes: a randomised, placebo-controlled study in patients receiving stable insulin therapy. The Pioglitazone 014 Study Group. Int J Clin Pract 56:251–257 17. Dormandy JA, Charbonnel B, Eckland DJ, Erdmann E,
Massi-Benedetti M, Moules IK, Skene AM, Tan MH, Lefe`bvre PJ, Murray GD, Standl E, Wilcox RG, Wilhelmsen L, Betteridge J, Birkeland K, Golay A, Heine RJ, Kora´nyi L, Laakso M, Moka´n M, Norkus A, Pirags V, Podar T, Scheen A, Scherbaum W, Schernthaner G, Schmitz O, Skrha J, Smith U, Taton J; PROactive investigators 2005 Secondary prevention of macrovascular events in patients with type 2 diabetes in the PROactive Study (PROspective pioglitAzone
Clin-ical Trial In macroVascular Events): a randomized controlled trial. Lancet 366:1279 –1289
18. Henry RR, Gumbiner B, Ditzler T, Wallace P, Lyon R, Glauber HS 1993 Intensive conventional insulin therapy for type II diabetes. Metabolic effects during a 6-mo outpatient trial. Diabetes Care 16: 21–31
19. Bergenstal RM 2006 Treatment models from the International Di-abetes Center: advancing from oral agents to insulin therapy in type 2 diabetes. Endocr Pract 12:98 –104
20. Juurinen L, Kotronen A, Grane´r M, Yki-Ja¨rvinen H 2008 Rosigli-tazone reduces liver fat and insulin requirements and improves he-patic insulin sensitivity and glycemic control in patients with type 2 diabetes requiring high insulin doses. J Clin Endocrinol Metab 93: 118 –124
21. Miyazaki Y, Mahankali A, Matsuda M, Glass L, Mahankali S, Ferrannini E, Cusi K, Mandarino LJ, DeFronzo RA 2001 Improved glycemic control and enhanced insulin sensitivity in type 2 diabetic subjects treated with pioglitazone. Diabetes Care 24:710 –719
22. DeFronzo RA, Ferrannini E, Simonson DC 1989 Fasting hypergly-cemia in non-insulin-dependent diabetes mellitus: contributions of excessive hepatic glucose production and impaired tissue glucose uptake. Metabolism 38:387–395
23. U.K. Prospective Diabetes Study (UKPDS) Group 1998 Intensive blood-glucose control with sulphonylureas or insulin compared with conventional treatment and risk of complications in patients with type 2 diabetes (UKPDS 33). Lancet 352:837– 853
24. United Kingdom Prospective Diabetes Study Group 1998 United Kingdom Prospective Diabetes Study 24. A 6-year, randomized, controlled trial comparing sulfonylurea, insulin, and metformin therapy in patients with newly diagnosed type 2 diabetes that could not be controlled with diet therapy. Ann Intern Med 128:165–175 25. Gerstein HC, Miller ME, Byington RP, Goff Jr DC, Bigger JT, Buse JB, Cushman WC, Genuth S, Ismail-Beigi F, Grimm Jr RH, Probstfield JL, Simons-Morton DG, Friedewald WT, Action to Control Cardiovas-cular Risk in Diabetes Study Group 2008 Effects of intensive glucose lowering in type 2 diabetes. N Engl J Med 358:2545–2559