This is an author-deposited version published in: https://sam.ensam.eu Handle ID: .http://hdl.handle.net/10985/8680
To cite this version :
Patrick BOT, Ignazio MARIA VIOLA, Richard G.J. FLAY, Jean-Sebastien BRETT - Wind-tunnel pressure measurements on modelscale rigid downwind sails Ocean Engineering p.a paraitre -2014
Any correspondence concerning this service should be sent to the repository Administrator : [email protected]
1
WIND-TUNNEL PRESSURE MEASUREMENTS ON
MODEL-SCALE RIGID DOWNWIND SAILS
To appear in Ocean Engineering special issueYacht Engineering, 2014, DOI:10.1016/j.oceaneng.2014.07.024
Patrick Bot1, Naval Academy Research Institute, France, [email protected]
Ignazio Maria Viola, Institute for Energy Systems, School of Engineering, The University of
Edinburgh, [email protected]
Richard G.J. Flay, Yacht Research Unit, University of Auckland, New Zealand,
Jean-Sebastien Brett, Naval Academy Research Institute, France, [email protected]
ABSTRACT
This paper describes an experiment that was carried out in the Twisted Flow Wind Tunnel at The University of Auckland to measure a detailed set of pressure distributions on a rigid 1/15th scale model of a modern asymmetric spinnaker. It was observed that the pressures varied considerably up the height of the spinnaker. The fine resolution of pressure taps allowed the extent of leading edge separation bubble, pressure recovery region, and effect of sail curvature to be observed quite clearly. It was found that the shape of the pressure distributions could be understood in terms of conventional aerodynamic theory. The sail performed best at an apparent wind angle of about 55°, which is its design angle, and the effect of heel was more pronounced near the head than the foot. Analysis of pressure time histories allows the large scale vortex shedding to be detected in the separation region, with a Strouhal number in the range 0.1 – 0.3, based on local sail chord length.
Keywords: Sails Aerodynamics – Downwind Sail – Pressure Measurements – Leading-edge
Separation– Laminar Separation Bubble - Trailing-edge Separation
2
NOMENCLATURE
AWA Apparent Wind Angle
c Sail section chord (m)
cav Average sail chord (m)
Pressure coefficient (-)
f Frequency (Hz)
h Yacht model height (m) Sail surface pressure (Pa) Reference static pressure (Pa) Reference dynamic pressure (Pa)
Re Reynolds number (-)
Strouhal number (-) Reference velocity
x Chord-wise coordinate (m) Fluid kinematic viscosity
1 INTRODUCTION
Modern yacht sails are aerodynamically very efficient but the flow field around sails is largely unknown. Knowledge of the flow features that make sails aerodynamically efficient will allow the performance of sails and also the aerodynamic efficiency of sail-like airfoils for other applications to be enhanced further.
3
The aerodynamics of sails has mainly been investigated with force measurements [Richards et al. 2001; Le Pelley et al. 2002; Fossati et al. 2006a, 2006b; Hansen et al. 2006] in wind tunnels [Flay and Jackson 1992; Flay 1996; Le Pelley et al. 2001], while only a few authors have recently measured sail pressure distributions [Richard and Lasher 2008; Viola and Flay 2009, 2011]. The flow field around sails has been examined primarily through numerical simulations and, therefore, it is very important to validate such simulations with accurate measurements of local quantities such as surface pressure distributions, instead of only comparing them to global quantities such as forces.
Sail pressure distributions can be measured in model-scale from wind tunnel tests and in full scale [Viola and Flay 2011]. The state-of-the-art experimental technique is based on flexible sails – including semi-flexible single-skin fibreglass sails used by Richards and Lasher [Richard and Lasher 2008], and common spinnaker sailcloth used by Viola & Flay [Viola and Flay 2009, 2010] - where pressure taps are attached to one side of the sail and pressures are measured on the other side of the sail through holes in the sailcloth. This technique allows realistic sail trims in different sailing conditions to be modelled, but is limited by (i) the unknown blockage effect due to the tubes and pressure taps, (ii) the alteration of both the static sail shape and the dynamic behaviour of the sails by the mass and stiffness of the tubes and pressure taps, (iii) the low accuracy in the reconstruction of the sail flying shape.
The observed differences between the pressure distributions measured with this technique in the wind tunnel, and those measured in full-scale or computed numerically are expected to be partially due to the presence of tubes and pressure taps.
4
A novel technique is presented in this paper, where the effect of the pressure taps is eliminated and the effect of the tubes on the flow field is minimised. Also, the sail is rigid allowing the flying shape to be detected with high-accuracy.
This paper describes pressure distributions measured on the rigid asymmetric spinnaker in a wind tunnel, which are discussed and compared to pressures measured on soft flexible sails, and also to numerical simulation results. The pressure profiles along the sail chord on the leeward side enable interesting flow characteristics that were found in previous works [Collie 2006; Viola and Flay 2011; Viola et al. 2013b, 2014] to be determined, such as leading edge separation bubble (sharp suction peak), sail curvature suction, and trailing edge flow separation (pressure plateau). Helpful insights into sail aerodynamics are obtained from this investigation, which are explained using conventional aerodynamic and aeronautical knowledge of the aerodynamics of thin wings [e.g. Glauert 1926; Abbott and Doenhoff 1959; Hoerner and Borst 1975]. Further details are given in the subsequent sections.
2 EXPERIMENTAL ARRANGEMENT
A rigid 1/15th scale model of an AC33-class spinnaker has been tested at the University of Auckland
Yacht Research Unit (YRU) Twisted Flow Wind Tunnel which has an open jet with a test section 7m wide and 3.5m high. The tests were performed in uniform flow (without twisting vanes) with a turbulence intensity of maximum 3%. The reference wind speed was approximately
giving a Reynolds number based on the average spinnaker chord cav equal to . The
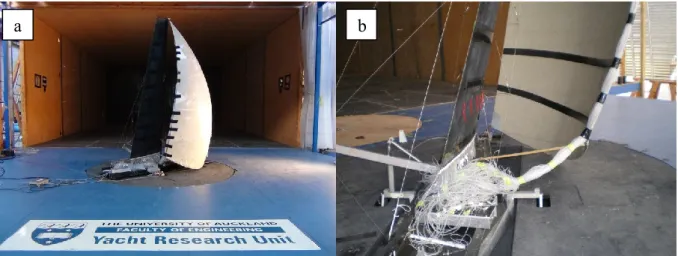
solid spinnaker and mainsail were mounted on a yacht model (rig and hull), which was mounted on a turntable to adjust the apparent wind angle (AWA). The model was mounted on fore and aft bearings to enable the heel angle to be varied. Figure 1 shows two photographs of the model during
5
the tests. In particular, Figure 1(b) shows the tubes carrying the pressures from the sail leech to the transducers in the cockpit; note also that to reduce deflection, the rig was reinforced by a deck spreader to windward due to the heavy spinnaker model, and the actuator used to adjust heel angle can be seen on the left hand side.
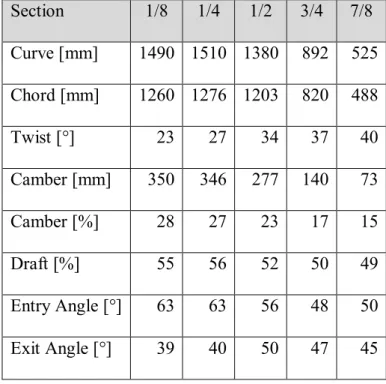
The solid model spinnaker was built as part of a master’s research project at the YRU by Brett [Brett 2012], with the flying shape recorded from a sailcloth model spinnaker previously studied at the YRU [Viola and Flay 2009]. The selected shape was recorded for a trim giving the maximum driving force with a non-flapping sail at an AWA of 55° and 10° of heel. The geometric parameters of the sail shape are given in Table 1. Unfortunately the shapes of the rigid asymmetric spinnaker and the soft sail were not perfectly identical, and this has implications on the pressure comparisons discussed in Section 4.
The solid sail is a 5mm thick epoxy fibreglass sandwich where the core is a corrugated plastic material featuring a high density of individual pressure-tight flutes, which provide the pneumatic tubes to carry the pressure signal from the measurement locations to the sail leech. Thin plastic tubes are connected to each flute on the sail leech to carry the pressures to the pressure transducers in the model cockpit. One-millimetre holes were drilled through the sail and tape was used to close one side in order to measure the pressures on the other side. A sketch of a pressure tap in a section of the solid spinnaker model is shown in Figure 2. The sail model is as thin as possible with a 45° chamfer on the leading edge to mimic the very low thickness of a real sail. The rigid sail had a mass of about 10kg, and it was observed that its shape could distort due to self-weight. The implications of this are addressed later in the paper when the results are discussed.
6
Figure 1: Photographs of the rigid spinnaker setup in the wind tunnel; (a) general view from downstream; (b) close-up view from behind the yacht model (colours available in the on-line version of the manuscript).
Figure 2: Sketch of a pressure tap in a section of the solid spinnaker model, and definition of aerodynamic profile parameters
Measurement system and experimental procedure
All transducers were pneumatically connected to a reference static pressure measured with a Pitot-static probe located 9.1m upstream of the model, 0.5m below the wind tunnel roof. A total of 175 pressure taps were arranged along five horizontal sections located at fractions 1/8, 1/4, 1/2, 3/4 and
7
7/8 of the mitre height, which is the line equidistant from the leading and trailing edges of the sail. The distance between consecutive pressure taps ranges from around 10mm near the leading edge up to around 100mm in the middle of the chord where the pressure gradient is expected to be lower. There are from 31 to 38 taps per section.
The reference dynamic pressure was measured by the same sensor as described in the preceding paragraph. Two other Pitot-static probes were positioned 0.8m above the wind tunnel floor (corresponding to a full scale height of 12m) to check the air speed at these locations too.
The piezoresistive pressure sensors used are Honeywell XSCL04DC transducers, and a calibration was made before each experimental run with a precision (+/-0.125 Pa) Druck-DPI 615LP pressure calibrator. The accuracy of the pressure measurements is of order 0.5 Pa.
Pressures were measured on the 175 pressure taps on each side of the sail, for different AWA and heel angles. For the mean pressure distribution, pressures were recorded over 100s at a sampling frequency of 100Hz. Only the pressure distribution on the sail’s suction side is shown for clarity. On the pressure side, the pressure was observed to be nearly constant with a pressure coefficient Cp ranging between 0.5 and 0.8 depending on the AWA, similar to previously published results [e.g. Richards and Lasher 2008; Viola and Flay 2009, 2010, 2011]. Note that this is different from what is observed on a flat plate at incidence [e.g. Crompton and Barret 2000], because on the curved section, the upstream flow is almost aligned with the section tangent at the leading edge. Pressures near the leading edge would be very sensitive to the detailed leading edge shape, but this effect could not be assessed. The leading edge was made as sharp as possible with a chamfer on the windward side to mimic what would happen on the leeward side of a sail with very low thickness.
8
This makes a significant difference compared to more common aerofoil sections with a rounded nose, as detailed e.g. in Abbott and von Doenhoff (1959).
Table 1: Parameters of the aerodynamic profile on each section (see definition in Fig. 2) Section 1/8 1/4 1/2 3/4 7/8 Curve [mm] 1490 1510 1380 892 525 Chord [mm] 1260 1276 1203 820 488 Twist [°] 23 27 34 37 40 Camber [mm] 350 346 277 140 73 Camber [%] 28 27 23 17 15 Draft [%] 55 56 52 50 49 Entry Angle [°] 63 63 56 48 50 Exit Angle [°] 39 40 50 47 45
3 MEAN PRESSURE DISTRIBUTIONS
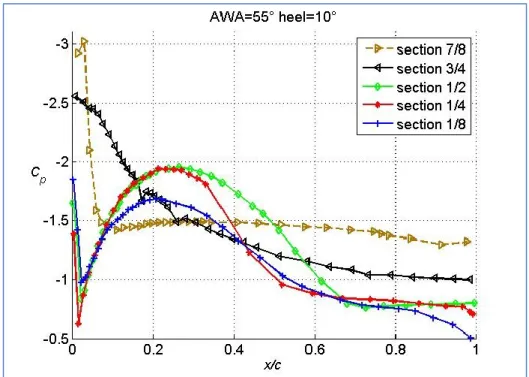
Figure 3 shows the mean pressure distributions recorded on the five sections of the spinnaker for an AWA of 55° and 10° heel. The three lower sections show similar behaviour with the following characteristics, which can be related to the separated and attached flow areas found in CFD investigations on sails [Collie 2006, Viola and Flay 2011, Viola et al. 2013b, 2014] (see also Section 6). A high suction peak at the leading edge is followed by a sharp pressure recovery with a minimum suction located around 2% of the chord length. The flow separates at the leading edge forming a leading edge separation bubble, where the pressure recovery is associated with re-attachment. On upwind sails [Viola et al. 2013a] the maximum pressure recovery occurs just
9
downstream of the point of reattachment. Downstream of this point, the pressure decreases again due to the sail curvature and thus the associated flow curvature, with a maximum suction at around 20%-30% of the chord length. After the pressure recovery in the region where the sail shape becomes less curved, the pressure is nearly constant in the trailing edge separated area. The high spatial resolution achieved due to the numerous pressure taps enables the very sharp gradients occurring near the leading edge to be resolved, which has not usually been possible in previously published work on sail pressure distributions. Notice that due to different chord lengths for the different sections, suction maxima at the same reduced coordinate x/c are not superimposed in reality.
Figure 3: Cp on the 5 sections of the spinnaker for 55° AWA and 10° heel (colours available in the on-line version of the manuscript).
On the highest section, there is a very high suction (Cp = -3) at the leading edge and then a rapid pressure recovery with the minimum suction located at 10% of the chord followed by a relatively
10
uniform pressure over the remaining chord. This pressure distribution suggests that there is a tight leading edge separation bubble at this location. Note that since this section is near the head of the sail, the flow will be very three-dimensional. There is a very flat maximum suction visible around x/c=0.3-0.4. On section 3/4, downstream of the high suction at the leading edge, the pressure recovery is smooth and essentially monotonic.
The pressure distributions on the five sections are shown in Figure 4 for AWAs from 51° to 59° at 10° heel. It should be noted that the rigid spinnaker shape corresponds (approximately) to the flying shape of the equivalent soft sail recorded at 55° AWA. This frozen shape is expected to perform well over a fairly narrow range of AWAs. Again, the three lower sections show similar behaviour to that described above. When the AWA is increased, the pressure recovery at the re-attachment location is reduced a little and the trailing edge separation point moves upstream. The pressure distribution on the lowest section is the least sensitive to AWA, whereas conversely, the pressure distribution on the highest section is the most sensitive to AWA. It may also be noticed that the pressure plateau in the trailing edge separated area for section 1/8 is more pronounced and with a higher suction (Cp around -0.8) for the highest AWA. The higher sections are mostly separated and totally stalled for the highest AWA. From pressures on the whole sail, the aerodynamic force looks higher at 53° AWA than 55° which was the optimal AWA for the soft sail.
11
Figure 4: Cp for AWA=51, 53, 55, 57 and 59° on the 5 sail sections, for 10° heel. Note that the Cp scale is larger for sections 3/4 and 7/8 (colours available in the on-line version of the manuscript).
12
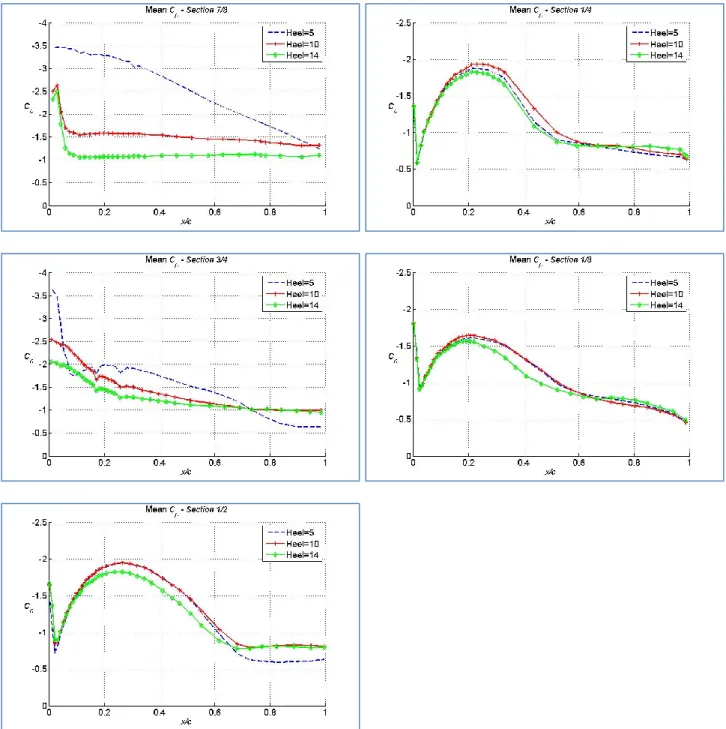
Figure 5: Cp for heel=5, 10 and 14° on the 5 sail sections, for AWA=55°. Note that the Cp scale is larger for sections 3/4 and 7/8 (colours available in the on-line version of the manuscript).
Figure 5 shows the pressure distributions on the five sections for heel angles of 5°, 10° and 14°, for an AWA of 55°. On the three lower sections, the pressure is affected only slightly by heel angle, with the trailing edge separation slightly earlier for the highest heel angle. On the top two sections, where the flow is mainly separated, the effect of heel is stronger and the higher the heel angle, the
13
more stalled the profile. In Figure 6, it is noticeable that the pressures on the top two sections at 5° heel for 55° AWA are nearly identical to the pressures at 10° heel for 53°AWA, and that the pressures at 10° heel for 57° AWA are nearly identical to pressures at 14° heel for 55° AWA, so that aerodynamically, additional heeling corresponds to increasing the angle of attack, for the highest sections of the spinnaker. In particular, the trailing edge separation point seems to move upstream when the heel angle increases.
Figure 6 : Cp on sections 7/8 and 3/4 for AWA=55° and heel angles of 5, 10 and 14°, and for heel angle = 10° and AWAs of 53, 55 and 57° (colours available in the on-line version of the
manuscript).
4 COMPARISON WITH OTHER PUBLICATIONS
Figure 7 shows the present results and those achieved with recent numerical simulations made on the same geometry at 55° AWA and 10° heel using Detached Eddy Simulation [Viola et al. 2013b, 2014], and those achieved experimentally on the equivalent soft sail [Viola and Flay 2010]. Viola et al. (2013b, 2014) modelled the model-scale wind tunnel experiment with a hybrid computational approach where unsteady Reynolds-averaged Navier-Stokes with a Spalart-Allmaras turbulence
14
model was used in the near-wall region, including the leading edge bubble, and Large Eddy Simulation was used to model the outer region. A finite volume solver with second order accuracy discretisation algorithms was used with a grid of 32 million cells. The leading edge bubble was described with approximately 10 cells in both the streamwise direction and in the wall-normal direction.
The wind tunnel tests with the flexible sails were performed in the same wind and sail trim conditions as the tests with rigid sails.
Figure 7 also shows the results of the present study obtained during another experimental run, which show the reasonable repeatability of the measurements. On the three lowest sections, the simulated and experimental results are similar. The general behaviour is well reproduced and a good quantitative agreement is found. Even in the region of the leading edge bubble, the agreement between the present results and the DES CFD results is reasonably good, as shown on the enlargements on Figure 7. In some cases, the simulation result is closer to the pressure recorded for a slightly lower AWA of 53° (see sections 1/8 and 1/4 for x/c<0.2 and section 1/2 for x/c<0.4). The pressure plateau associated with the trailing edge separation is found to be a little further downstream in the simulation than in the experiment. On the top two sections, the numerical pressures are similar to the experimental result for a lower AWA (53°).
15
Figure 7: Cp measured on the solid spinnaker (present study) for 10° heel, AWA=53 and 55° (measurements from two distinct experimental runs are shown to assess the repeatability), measured on a soft sail [Viola and Flay 2010] and computed with DDES [Viola et al. 2013b, 2014]; bottom-right: enlargement around the leading edge for sections 1/8, 1/4 and 1/2 (colours available in the on-line version of the manuscript).
The results obtained on the soft sail in a different experiment show general behaviour that is more or less compatible with the present results, but the discrepancies are important. In particular, the peak
16
suction values and locations are rather different. It can be observed that the lower number of pressure taps on the soft sail did not allow the sharp gradients to be resolved. The differences between the soft and rigid sail results are also likely to be due to the differences in shape between them. In fact they are also slightly different in size.
Another reason for the differences observed between the present results and the simulation results may result from an alteration of the shape of the solid sail. As the solid sail is quite heavy (around 10kg) compared to the aerodynamic force, and not perfectly rigid, it was observed after the tests that the model’s weight had altered the general sail shape by dropping the clew which would have increased the sail curvature and decreased the sail twist resulting in higher angle of attack on the highest sections, which could explain the stall of the top of the sail. In order to understand this point better, a subsequent research project is underway to measure both the spinnaker and mainsail pressures, with additional support of the solid spinnaker using wires to fix the distances between the head, tack and clew to the required values.
5 PRESSURE TIME SERIES
For the particular analysis of pressure time histories, some tests were done with only 58 pressure taps located on sections 1/4, 1/2 and 3/4, and with shorter pressure tubes, recorded over 300s at a sampling frequency of 200Hz. The signals were then filtered with a moving average of span 20 data points. Each tube length was adjusted to the length of each flute inside the sandwich sail in order to have an identical total cavity length equal to 2.15m. Such long tubes would have provided significant damping to the recorded pressure time histories. However, even though the sensor plus tube transfer function is not known with precision, the recorded pressures show quite different behaviours depending on their positions, and hence according to the region of the local flow, and
17
some interesting features of the separation were detected. Note that for these tests, the 58 tubes were not taped all together on the trailing edge, but only maintained downstream by small bunches in order not to move in the flow, as shown on the insert in Fig. 9. Hence, there is no bundle of tubes like the one shown in Fig. 1 with 175 tubes, and the trailing edge thickness was that of the solid sail model (5mm).
Figure 8 shows the time series of Cp variations (instantaneous Cp – time averaged Cp) on section 1/2 from four characteristic locations along the chord: near the leading edge just downstream of the reattachment (x/c=0.0428), near the maximum of the curvature suction peak (x/c=0.240), in the separation region (x/c=0.617) and in the separated area near the trailing edge (x/c=0.889). In the two first locations, the fluctuation results from the turbulence of the flow. It is noticeable that the pressure amplitudes are much higher in the separated area and that the maximum amplitudes are observed where the separation occurs. The separation location is known to be oscillatory in time and the back and forth motion of the separation point associated with its high pressure gradient gives rise to these high pressure fluctuations. Moreover, as can be seen in the enlargement in Figure 8, the pressure fluctuations at x/c=0.617 undergo rather coherent oscillations at a frequency significantly lower than the pressure fluctuations at other locations. Similar measurements were repeated for different values of the flow velocity, namely and 4.36 m/s. For the lowest velocity , the signal to noise ratio from the pressure taps is too low to enable any analysis. For the other values of the velocity, the observed coherent fluctuation frequencies and corresponding Strouhal number ranges are given in Table 2. The chord length was chosen as length scale for the Strouhal number as the vortex shedding results from the massive separation on the high camber high incidence section, and the section depth scales with the chord length. The results show that these low frequency coherent oscillations are characterised by a Strouhal number from 0.1 up to
18
0.3. Such a Strouhal number range confirms that these fluctuations are associated with the large scale vortex shedding in the flow separation.
Figure 8: Time series of the Cp variations for a flow velocity of 3.45m/s, on section 1/2, at x/c=0.0428, 0.240, 0.617 and 0.889; enlargement: detail for x/c=0.617 and t from 100 to 150s (colours available in the on-line version of the manuscript).
Table 2: Observed coherent fluctuation frequency range in the pressure time series for different values of the flow velocity and the corresponding Strouhal number range.
Frequency (Hz) Strouhal number
2.41 0.20 – 0.50 0.10 – 0.25
3.45 0.29 – 0.67 0.10 – 0.23
19
6 DISCUSSION AND CONCLUSIONS
The paper presents results from novel rigid sails, manufactured in a sandwich structure made of pressure-tight flutes, which allows the pressure distributions on model-scale yacht sails to be measured. This model was used to measure the pressure distributions on an asymmetric spinnaker at different AWA and heel angles, and the results were compared with numerical results and another experimental method.
The measurements confirmed the general pressure distributions and trends observed by other authors with flexible sails [Viola and Flay 2009, 2010] and numerical simulations [Viola et al. 2013b, 2014]. In particular, in the optimum trim condition, the pressure gently decreases from the leading edge to the trailing edge on the whole windward side of the sail. On the leeward side (Figure 3), the pressure shows a suction peak due to the leading edge separation followed by a partial pressure recovery associated with the reattachment. Further downstream the pressure shows a second smoother suction peak associated with the sail and flow curvature, and then a pressure plateau extending to the trailing edge when separation occurs. On the highest sections, the second suction peak does not occur due to the tip vortex at the head of the sail.
When the AWA increases (Figure 4), the leading edge suction peak increases while the trailing edge separation point moves upstream leading to a lower curvature-related suction peak. When the AWA is increased further, the flow fails to reattach and the pressure gradient decreases until a constant pressure is measured on the entire sail section.
20
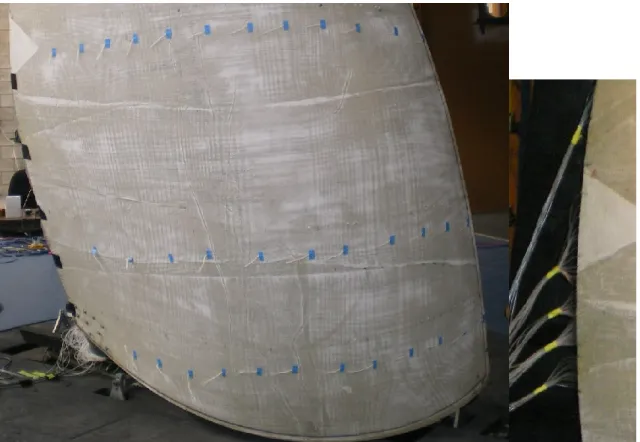
Figure 9: Photograph of the leeward surface of the sail showing the wool tell-tales to visualise the trailing edge separation region; insert: tube arrangement on the trailing edge used for the time series
tests (colours available in the on-line version of the manuscript).
The interpretation of pressure distributions in terms of leading edge bubble and trailing edge separation is supported by various CFD investigations [Collie 2006; Viola and Flay 2011; Viola et al. 2013b, 2014] on similar geometries. Proper visualisation of the leading edge bubble was not possible in this test set up because the bubble was too small. Near the trailing edge, visualisation with tell-tales enables the large separation area to be seen (Fig. 9), and the pressure plateau could be seen to be related to the trailing edge separation. Therefore, the pressure distributions on sections 1/2 and 1/4 on Fig. 4 clearly illustrate the growth of the trailing edge separation region with increasing AWA.
21
On the top sections of the spinnaker, increasing the heel angle has a similar effect on pressures to increasing the AWA (Fig. 6). This result is in contradiction with the commonly used effective angle theory [Kerwin 1978, Jackson 2001] which considers only the effect of the projection of the flow in the heeled plane. Even though this simple approach elegantly accounts for the effect of heel on the global aerodynamic forces, particularly on upwind sails, it is believed that it is not appropriate for describing local flow properties on a highly curved downwind sail, particularly from the curvature in the spanwise direction. Moreover, the flow around a spinnaker is highly three-dimensional, particularly on the top sections. The specific behaviour observed here is not fully understood and is expected to happen only in a limited range of heel angles, such as those measured in the present paper. Furthermore, the effect of heel on the aerodynamic force produced by a spinnaker will also depend on whether or not it is re-trimmed for every heel angle. Interestingly, Le Pelley et al. [2008] already mentioned that downwind sails may allow larger aerodynamic forces to occur when the yacht is slightly heeled than when upright, in particular circumstances, possibly due to a different flow field in the tip vortex or to more attached flow related to the modification of the sail’s horizontal sections.
This novel model sail pressure investigation allowed progress beyond the current state-of-the-art method based on flexible sails [Viola and Flay 2009, 20010, 20011] in several areas. In particular:
Rigid sails allow better control of the sail geometry (particularly camber and draft) than flexible sails, though the control on the twist of the sails is still unsatisfactory. For instance, the comparison with the pressures computed numerically by Viola et al. [Viola et al. 2013b, 2014] suggests that the sail was under-twisted by about on the highest sections during the experiments (Fig. 7). This undesirable sail deflection was probably caused by its own self weight.
22
On flexible sails the pressure tubes cannot be bundled together at the trailing edge and thus the tubes have a greater blockage effect than with rigid sails. For instance, when pressures on the leeward side are measured with flexible sails, the tubes on the windward side deflect the incoming streamlines, resulting in an increased angle of attack. This can be seen in Fig. 7, where higher suction peaks were measured with flexible sails than with rigid sails.
On flexible sails, the weight of the pressure taps and tubes affect the sail shape leading to local flow accelerations and pressure changes, while rigid sails allow a much smoother surface. For instance, on the lowest section in Fig. 7, the pressure around 3/4th of the chord decreases locally due to a kink (wrinkle) on the sail.
Rigid sails also allow the pressure transducers to be placed very close to the pressure tap, minimising the displacement of the volume of air between the tap and the transducer that affects the frequency content of the pressure time series due to the filtering effect of long tubes. The study of frequencies and phases of the pressure time series may reveal very interesting information on the flow field. For instance, it may allow the detection of the location of laminar to turbulent transition, if the positions of separation and reattachment points are stationary, while correlations between signals from taps located in different places may allow the convection of coherent flow structures to be detected. The paper presents a preliminary attempt to analyse pressure time histories at four different locations (Fig. 8). For the first time it is shown that the position of the trailing edge separation point is not steady but oscillates with a frequency corresponding to . Future work in this area is expected to include the use of shorter pressure tubes, or pressure transducers embedded into the sail structure, as is commonly done in experimental aeronautical research investigations.
23
In conclusion, the novel experimental methods discussed in the paper are very promising although further enhancements are needed to increase their accuracy. Firstly, the flying shape must be controlled more precisely and, secondly, it is desirable that the blockage due to the bundle of tubes at the trailing edge is decreased further.
ACKNOWLEDGEMENTS
The authors warmly acknowledge the help from the Centre for Advanced Composite Materials (CACM) at The University of Auckland to build the solid spinnaker model. The support from the YRU and especially David Le Pelley is gratefully acknowledged, as well as the help from research students Dario Motta, Francesca Tagliaferri and Novella Saccenti to carry out the tests. This project has received funding from the European Union’s Seventh Programme for research, technological development and demonstration under grant agreement No PIRSES-GA-2012-318924, and from the Royal Society of New Zealand for the UK-France-NZ collaboration project SAILING FLUIDS.
REFERENCES
Abbot, I. H. and von Doenhoff, A E., 1959, Theory of wing sections, Dover Publications.
Brett, J.S, 2012, Downwind Sail Aerodynamics: A pressure distribution and an Aerodynamic Forces database for the validation of numerical code, Master Thesis in Naval Environment, Research
Institute of the Naval Academy, IRENav, Arts et Métiers ParisTech, France. Research project
24
Collie, S., 2006, Application of Computational Fluid Dynamics to Two-Dimensional Downwind Sail Flows, PhD thesis, University of Auckland.
Crompton, M.J., Barret, R.V., 2000, Investigation of the separation bubble formed behind the sharp leading edge of a flat plate at incidence. In Proceedings of the Institution of Mechanical Engineers,
Part G: Journal of Aerospace Engineering, 214(3), 157-176.
Flay, R.G.J., Jackson, P.S., 1992, Flow simulations for wind-tunnel studies of sail aerodynamics.
Journal of Wind Engineering and Industrial Aerodynamics, Vol. 44, Issues 1–3, pp.2703–2714.
Flay R.G.J., 1996, A twisted flow wind tunnel for testing yacht sails, Journal of Wind Engineering
and Industrial Aerodynamics, Volume 63, Number 1, pp. 171-182.
Fossati, F., Muggiasca, S., Viola, I.M. and Zasso, A., 2006a, Wind tunnel techniques for investigation and optimization of sailing yachts aerodynamics, In Proceedings of the 2nd High
Performance Yacht Design Conference, Auckland, New Zealand.
Fossati, F., Muggiasca, S. and Viola, I.M., 2006b, An investigation of aerodynamic force modelling for IMS Rule using wind tunnel techniques, In Proceedings of the 19th International HISWA
Symposium on Yacht Design and Yacht Construction, pp. 49-90, 13-14 November, Amsterdam, The
Netherlands.
Glauert, H., 1926, The elements of aerofoil and airscrew theory, Cambridge University Press.
Hansen, H., Richards, P.J. and Jackson, P.S., 2006, An investigation of aerodynamic force modelling for yacht sails using wind tunnel techniques, In Proceedings of the 2nd High
Performance Yacht Design Conference, Auckland, New Zealand.
Hoerner, S F. and Borst, H V., 1975, Fluid-dynamic lift, Hoerner Fluid Dynamics, Bricktown New Jersey.
25
Jackson, P., 2001, An improved upwind sail model for VPPs, The 15th Chesapeake Sailing Yacht
Symposium, SNAME, Annapolis, USA.
Kerwin, J.E., 1978, A velocity prediction program for ocean racing yachts, Rep. 78-11, MIT Irving Pratt Ocean Race Handicapping Project.
Le Pelley, D.J., Benzie, D., Flay, R.G.J., 2001, Correct simulation of the profiles of apparent wind speed and twist for testing yacht sails, In Proceedings of the 9th Australasian Wind Engineering Workshop (AWES). Townsville, Australia.
Le Pelley, D.J., Ekblom, P., Flay, R.G.J., 2002, Wind tunnel testing of downwind sails, In
Proceedings of the 1st High Performance Yacht Design Conference, pp. 155-161, Auckland, New
Zealand.
Le Pelley, D.J., Kjellberg, L., Flay, R.G.J., 2008, The effects of staysails on yacht performance, In
Proceedings of the 3rd High Performance Yacht Design Conference, pp. 247-256, Auckland, New
Zealand.
Richards, P.J., Lasher, W., 2008, Wind Tunnel and CFD Modelling of Pressures on Downwind Sails, In Proceedings of Bluff Bodies Aerodynamics & Applications, Milano, Italy.
Richards, P.J., Johnson, A. and Stanton A., 2001, America’s Cup downwind sails - vertical wings or horizontal parachutes?, Journal of Wind Engineering and Industrial Aerodynamics, Vol. 89, Issues
14–15, pp 1565-1577.
Viola, I.M., Flay, R.G.J., 2009, Force and pressure investigation of modern asymmetric spinnakers,
Transactions of the Royal Institution of Naval Architects Part B: International Journal of Small Craft Technology, 151(2), 31-40.
26
Viola, I.M., Flay, R.G.J., 2010, Pressure distribution on modern asymmetric spinnakers,
Transactions of the Royal Institution of Naval Architects Part B: International Journal of Small Craft Technology, 1512(1), 41-50.
Viola, I.M., Flay, R.G.J., 2011, Sail pressures from full-scale, wind-tunnel and numerical investigations, Ocean Engineering, 38(16), 1733-1743.
Viola, I.M., Bot, P., Riotte, M., 2013a, Upwind Sail Aerodynamics: a RANS Numerical Investigation Validated with Wind Tunnel Pressure Measurements, International Journal of Heat
and Fluid Flow, Vol. 39, pp.90-101.
Viola, I.M., Bartesaghi, S, Van-Renterghem, T., Ponzini, R., 2013b, Delayed Detached Eddy Simulation of sailing yacht sails. In Proceedings of the 3rd International Conference on Innovation in High Performance Sailing Yachts, INNOV’SAIL, Lorient, France.
Viola, I.M., Bartesaghi, S, Van-Renterghem, T., Ponzini, R., 2014, Detached Eddy Simulation of a sailing yacht. Ocean Engineering, Special Issue Yacht Engineering, present volume2.
2 Authors note to editor: If the paper referenced Viola et al. 2014 is accepted for publication, then reference Viola et al.
2013b should be skipped in the final version. If not accepted, Viola et al. 2014 should be skipped and only Viola et al. 2013b be used throughout the present paper