Breast Cancer Subtypes and Screening Mammography
Sensitivity
Mémoire
Sue-Ling Chang
Maîtrise en Épidémiologie
Maître ès sciences (M.Sc.)
Québec, Canada
© Sue-Ling Chang, 2014
Résumé
Les cancers du sein peuvent être classifiés selon le statut de récepteur d’estrogène (RE), de récepteur de progestérone (RP), de récepteur HER2, ou selon quatre sous-types (Luminal A, Luminal B, HER2-enrichi, Triple-négatif) ayant des propriétés biologiques et cliniques différentes. La sensibilité du dépistage par mammographie pourrait varier selon ces types de cancers mais ceci n’est pas encore clair. L’agressivité de la tumeur, mesurée par le grade histologique pourrait expliquer cette association. Les types de cancers d’intervalle ont été comparés à ceux de cancers détectés par dépistage parmi 1536 cas infiltrants provenant d’un centre de référence de Québec. Les tumeurs RE-négatif, RP-négatif, positif, Luminal B, HER2-enrichi et TPN étaient tous plus fréquentes chez les femmes avec cancers d’intervalle que chez celles avec cancers détectés par dépistage. À l’exception des tumeurs HER2-positif et HER2-enrichi, le grade histologique expliquait en grande partie la variabilité observée entre les types de cancer et la sensibilité.
Abstract
Breast cancers can be classified according to tumour estrogen (ER) and progesterone (PR) receptors, human epidermal growth factor receptor 2 (HER2), and according to four subtypes (Luminal A, Luminal B, HER2-enriched, Triple-negative), each with different biological and clinical profiles. These tumour types may also influence screening mammography sensitivity but this is still not clear. Tumour aggressiveness, measured by the histological grade, may also play a role in explaining this association. Interval cancer types were compared to screen-detected cancer types in 1536 invasive cases obtained from a reference center in Quebec. ER-negative, PR-negative and HER2-positive, Luminal B, HER2-enriched and TPN tumours were all more frequent in women with interval cancers than in women with screen-detected cancers. Except for HER2-positive and HER2-enriched tumours, histological grade explained most of the variability observed between tumour receptor status, subtypes and sensitivity.
Table of Contents
Résumé... iii
Abstract ... v
Table of Contents ... vii
List of Tables ... ix
List of Figures ... xi
List of Abbreviations ... xiii
Acknowledgments ... xv
Foreword ... xvii
Introduction ... 1
Literature Review ... 5
2.1BREAST CANCER INTRINSIC SUBTYPES ... 5
2.1.1 Description of intrinsic breast cancer subtypes ... 5
2.1.2 Classification of breast cancer subtypes by immunohistochemistry ... 8
2.1.3 Section summary ... 10
2.2BREAST CANCER TYPES AND AGGRESSIVENESS ... 10
2.2.1 Markers of aggressiveness ... 10
2.2.2 Breast cancer types and aggressiveness ... 13
2.2.3 Section summary ... 16
2.3BREAST CANCER TYPES AND RADIOLOGIC FEATURES ... 16
2.3.1 Definition and description of radiologic features ... 17
2.3.2 Breast cancer types and radiologic features ... 18
2.3.3 Section summary ... 21
2.4SCREENING SENSITIVITY ... 21
2.4.1 Definition ... 21
2.4.2 Characteristics of women ... 26
2.4.3 Aggressiveness and sensitivity ... 28
2.4.4 Radiologic features at screening and sensitivity ... 30
2.4.5 Breast cancer types and sensitivity ... 31
2.4.6 Section summary ... 33
Objectives and Conceptual Framework ... 37
3.1OBJECTIVES ... 38
3.2CONCEPTUAL FRAMEWORK ... 39
Breast Cancer Subtypes and Screening Mammography Sensitivity ... 41
4.1RÉSUMÉ ... 42
4.2ABSTRACT ... 44
4.3INTRODUCTION ... 45
4.4MATERIALS AND METHODS ... 47
4.5RESULTS ... 50
4.7REFERENCES ... ERREUR !SIGNET NON DEFINI.
Conclusion ... 65
References ... 69
Appendix ... 77
APPENDIX A.COMPLETE-CASE RESULTS OF TUMOUR TYPE AND HISTOLOGICAL GRADE OF BREAST CANCERS (N=806) ... 78
APPENDIX B.COMPLETE-CASE RESULTS OF TUMOUR TYPE OF INVASIVE INTERVAL BREAST CANCERS RELATIVE TO SCREEN-DETECTED CANCERS (N=858) ... 79
APPENDIX C.COMPLETE-CASE RESULTS OF TUMOUR TYPE OF INVASIVE CLINICAL BREAST CANCERS RELATIVE TO SCREENED BREAST CANCERS (N=1536) ... 80
APPENDIX D.TUMOUR TYPE OF INVASIVE INTERVAL BREAST CANCERS RELATIVE TO SCREEN-DETECTED BREAST CANCERS, ADJUSTED FOR VASCULAR INVASION (N=858) ... 81
APPENDIX E.COMPLETE-CASE RESULTS OF TUMOUR TYPE OF INVASIVE INTERVAL BREAST CANCERS RELATIVE TO SCREEN-DETECTED BREAST CANCERS, ADJUSTED FOR VASCULAR INVASION (N=858) ... 82
List of Tables
TABLE 1.BREAST CANCER SUBTYPES DETERMINED BY IHC ASSESSMENT OF ER,PR, AND HER2 STATUS. ... 9
TABLE 2.FEATURES AND RELATED SCORES TO EVALUATE HISTOLOGICAL GRADE ACCORDING TO THE ELSTON-ELLIS GRADING METHOD. 11
TABLE 3.SUMMARY AND DESCRIPTION OF GRADE 1,2, AND 3. ... 12
TABLE 4.CHARACTERISTICS OF STUDIES REPORTING ADJUSTED RESULTS FOR THE RELATIONSHIP BETWEEN SUBTYPES AND HISTOLOGICAL GRADE. ... 15
TABLE 5.COMPARISON OF STUDIES EXAMINING BREAST CANCER SUBTYPES AND SENSITIVITY ... 35
Article tables
TABLE 1.CHARACTERISTICS OF STUDY POPULATION (N=1536)... 59
TABLE 2.TUMOUR TYPE AND HISTOLOGICAL GRADE OF BREAST CANCERS (N=806) ... 61
TABLE 3.TUMOUR TYPE OF INVASIVE INTERVAL BREAST CANCERS RELATIVE TO SCREEN-DETECTED BREAST CANCERS (N=858) . 62
TABLE 4.TUMOUR TYPE OF INVASIVE CLINICAL BREAST CANCERS RELATIVE TO SCREENED BREAST CANCERS (N=1536) ... 63
Appendix tables
ADDITIONAL TABLE 1.COMPLETE-CASE RESULTS OF TUMOUR TYPE AND HISTOLOGICAL GRADE OF BREAST CANCERS (N=806) ... 78
ADDITIONAL TABLE 2.COMPLETE-CASE RESULTS OF TUMOUR TYPE OF INVASIVE INTERVAL BREAST CANCERS RELATIVE TO SCREEN -DETECTED CANCERS (N=858) ... 79
ADDITIONAL TABLE 3.COMPLETE-CASE RESULTS OF TUMOUR TYPE OF INVASIVE CLINICAL BREAST CANCERS RELATIVE TO SCREENED BREAST CANCERS (N=1536) ... 80
ADDITIONAL TABLE 4.TUMOUR TYPE OF INVASIVE INTERVAL BREAST CANCERS RELATIVE TO SCREEN-DETECTED BREAST CANCERS, ADJUSTED FOR VASCULAR INVASION (N=858) ... 81
ADDITIONAL TABLE 5.COMPLETE-CASE RESULTS OF TUMOUR TYPE OF INVASIVE INTERVAL BREAST CANCERS RELATIVE TO SCREEN -DETECTED BREAST CANCERS, ADJUSTED FOR VASCULAR INVASION (N=858) ... 82
List of Figures
FIGURE 1.BREAST ANATOMY AND HISTOLOGY. ... 5
FIGURE 2.DENDROGRAM FROM HIERARCHICAL CLUSTERING OF 115 TUMOUR SAMPLES. ... 8
FIGURE 3.TYPICAL HISTOLOGICAL VIEWS OF TUMOURS BY GRADE SCORES RELATIVE TO NORMAL BREAST TISSUE. ... 12
FIGURE 4.RADIOLOGIC ABNORMALITIES OF THE BREAST. ... 17
FIGURE 5.DRAWN REPRESENTATION OF MASS SHAPES AND MARGINS, AND EXAMPLES OF MICROCALCIFICATION MORPHOLOGIES. 18 FIGURE 6.REPRESENTATION OF THE NATURAL HISTORY OF BREAST CANCER: THE NON-DETECTABLE PHASE, THE PRECLINICAL DETECTABLE PHASE AND THE CLINICAL PHASE. ... 22
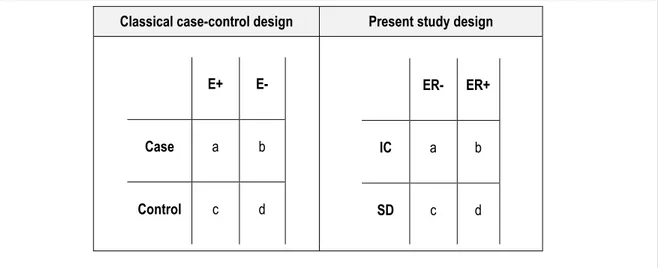
FIGURE 7.MODIFIED 2X2 TABLE FEATURING RESULTS OF SCREENING MAMMOGRAPHY, ASSESSMENT, AND BREAST CANCER DIAGNOSIS. 23 FIGURE 8. REPRESENTATION OF CASE-CONTROL AND STUDY DESIGN. ... 24
FIGURE 9.1-SENSITIVITY ODDS RATIOS CALCULATED IN POPULATION AND STUDY SAMPLE. ... 25
FIGURE 10. REPRESENTATION OF TUMOUR DETECTION BY SCREENING ACCORDING TO LENGTH OF PRECLINICAL PHASE. ... 26
FIGURE 11.CONCEPTUAL FRAMEWORK OF STUDY. ... 39
Article figure FIGURE 1.CAUSAL DIAGRAM ILLUSTRATING THE POSSIBLE PATHWAYS BY WHICH BREAST CANCER TYPES MAY INFLUENCE SCREENING SENSITIVITY. ... 58
List of Abbreviations
ADJ Adjustment
BMI Body Mass Index
CCNB1 Cyclin B1
CEP17 Chromosome 17 centromere
CI Confidence interval
CK Cytokeratins
CK2 Cytokeratin 2
CK5/6 Cytokeratins 5 and 6
CMSDF Centre des Maladies du Sein Deschênes-Fabia
DCIS Ductal Carcinoma in Situ
ER Estrogen Receptor
ERBB2 V-Erb-B2 Avian Erythroblastic Leukemia Viral Oncogene Homolog
FISH Fluorescent in situ hybridization
FOXA1 Forkhead Box Protein 1
GATA3 GATA-Binding Protein 3
GRB7 Growth Factor Receptor-Bound Protein 7
HER1 Epidermal Growth Factor Receptor
HER2 Human Epidermal Growth Factor Receptor 2
HRT Hormone Replacement Therapy
IC Interval Cancer
IDC Invasive Ductal Carcinoma
IHC Immunohistochemistry
ILC Invasive Lobular Carcinoma
INSPQ Institut national de santé publique du Québec
KRT5 Cytokeratin 5
KRT6 Cytokeratin 6
KRT17 Cytokeratin 17
LUM Luminal
MKI67 Ki-67
MYBL2 Myb-Related Protein
OR Odds Ratio
PQDCS Programme québécois de dépistage du cancer du sein
PR Progesterone Receptor RC Rapport de cotes RE Récepteur d’estrogène RP Récepteur de progestérone SD Screen-Detected Cancer Se Sensitivity SPF S-Phase Fraction TPN Triple-negative
WHO World Health Organization
Acknowledgments
I would like to thank foremost my thesis director Dr. Jacques Brisson for graciously accepting me as his student, and offering me an interesting and exciting project. Not having any prior experience in epidemiology, he gave me the opportunity to obtain real-life epidemiology experience by working alongside epidemiologists and breast cancer screening experts, and to participate in two publications. His rigorous approach to research and thinking about epidemiological problems motivated me to improve my own work, and I am certain that all the skills I have gained as his student will help me in my future endeavours.
I would be remiss if I didn’t thank Dr. Caroline Diorio for introducing me to the field of molecular epidemiology and for helping me further my knowledge in molecular biology by inviting me to interact with her team. Her knowledge of these fields helped me further understand certain concepts of this present work. I will always be grateful for her encouragement, support, and words of wisdom that she gave me during my studies. Her approachable and welcoming disposition helped me become more at ease with the research environment.
I would like to thank Caty Blanchette for her patience and support during my earlier ordeals with SAS and for assembling the database used during this research. In addition, I thank Sylvie Bérubé for helping me understand the CMSDF database. I also would like to extend my gratitude to the members of the PQDCS Evaluation team and other colleagues at the INSPQ notably Isabelle Théberge, Marie-Hélène Guertin, Éric Pelletier, André Langlois and Roxanne Gagnon. Thank you for helping me in various ways throughout this work either by helping me understand epidemiological concepts, working through problems, resolving SAS bugs or simply by extending your friendship. I am also grateful to Daniela Furrer-Soliz for helping me understand immunohistochemistry and some aspects of HER2.
On a personal note, I thank my mother Elena, my step-father Serge, and my husband Kayne, for their patience and support throughout this endeavour.
Foreword
This project culminated in the drafting of an article entitled ‟Breast cancer intrinsic subtypes and screening
mammography sensitivity‟ which will be submitted for publication. In this study, I participated in the discussion
leading to the formulation of the study objectives and conducted the literature review. I was involved in assembling the data with the support of Sylvie Bérubé who, along with Julie Lemieux, contributed valuable knowledge of the Centre des Maladies du Sein Deschênes-Fabia (CMSDF) database. I was responsible for matching the data from the CMSDF to the database of the Programme Québécois de Dépistage du Cancer du Sein (PQDCS), preparing the data for analyses, conducting the analyses, drafting and editing the article. Éric Pelletier helped me navigate the PQDCS database and also contributed his knowledge of the screening program to the article. François Sanschagrin was responsible for the pathology and laboratory information. Dr. Jacques Brisson supervised my work throughout the entire project.
During my training, I also had the chance to participate in the writing of two other articles that have now been published. I was also closely involved with the data collection of an on-going project of the effect of mammography quality on the sensitivity of mammography screening. These complementary experiences enriched my research training considerably although it does not appear in this document.
1. Fontenoy AM, Langlois A, Chang SL, Daigle JM, Pelletier É, Guertin M, Théberge I, Brisson J. Contribution and performance of mobile units in an organized mammography screening program. Can J Public Health. 2013; 104(3):193-199.
2. Théberge I, Chang SL, Vandal, N, Daigle JM, Guertin M, Pelletier É, Brisson J. Radiologist interpretive volume and breast cancer screening accuracy in a Canadian organized screening program. J Natl Cancer
Introduction
Sensitivity is the property that enables screening mammography to detect breast cancer early in its preclinical phase which provides an opportunity to advance treatment and thus, reduce mortality. Sensitivity is therefore an important determinant of the disease control value of a screening program.1
Molecular studies have shown that breast cancers can be classified into four unique subtypes by virtue of their distinctive gene-expression profiles (Luminal A, Luminal B, HER2-enriched, and Basal-like)2-5. Luminal A and Luminal
B subtypes have gene expression patterns that resemble the gene expression profiles of luminal epithelial breast cells, and are characterized by the expression of the estrogen receptor (ER), progesterone receptor (PR) and genes associated with ER activation.6,7 Luminal B tumours are different from Luminal A in that they also express the human
epidermal growth factor receptor 2 (HER2) and HER2-associated genes.3,8-10 In contrast to the luminal subtypes,
enriched tumours lack expression of ER, PR and ER-associated genes. However, like Luminal B, HER2-enriched tumours overexpress HER2 and HER2-associated genes. Lastly, the Basal-like subtype is characterized by the lack of expression of ER, PR, ER-associated genes and HER2 but expresses genes encoding for epithelial cytokeratins (CK) 5, 6, 14, and 17.3 The four breast cancer subtypes have clinical relevancy as they have been shown
to have different treatment responses and survival.5,7,8,11 For instance, endocrine therapy such as Tamoxifen is used
for Luminal A, while biological therapy like Transtuzumab, is used for HER2-enriched tumours, and a combination of both may be used for Luminal B.5 There are no targeted treatments for Basal-like tumours to date.
Since breast cancers represent different types of tumours with unique biological and clinical characteristics, these differences may also influence the way they appear on a mammogram. For instance, tumour appearance may affect sensitivity if a tumour type has a more conspicuous appearance at screening which would make it more detectable than another that blends in with mammary tissue. The literature suggests that breast tumour types (ER, PR, HER2 and subtype) may differ in radiologic appearance. ER-positive tumours generally tend to occur more frequently as spiculated masses than ER-negative tumours12-21 with only one study not reporting significant findings.22 PR and
HER2 were not generally associated with masses. A few studies observed that PR-positive tumours12,20 were more
frequent in spiculated masses but most findings were not significant.14,15,17,18,22 HER2-positivivity was not associated
with masses.12,13,18,22-26 ER-negative tumours were also more frequent in microcalcifications than ER-positive
tumours14,15,19,20,27 but not consistently.16-18,24,26,28 PR-negative tumours also showed frequently microcalcifications20,27
but generally findings were not statistically significant.15,17,18,24,28 Conversely, HER2-positive tumours were more likely
than HER2-negative to appear as microcalcifications22,23,25,26,28-32 with few disagreeing studies.18,24 Subtype studies
were not consistent.13,31,33-37 Basal-likes were more frequent in ill-defined masses than non-Basal-like subtypes33,34
and this was similarly reported for Triple-negatives when compared to HER-positive and ER-positive tumours.13
masses than Basal-like tumours, another used a non-conventional subtype classification35, and still another did not
provide statistics for all comparisons.36 Two studies comparing all subtypes reported that Triple-negative tumours
were more frequently masses than Luminal A but no margin descriptors were used.31,37 These studies suggested that
HER2-enriched31,37 and Luminal B37 frequently appeared as microcalcifications when compared to other subtypes. An
association with Luminal A and architectural distortion is reported which has not been described elsewhere.37
Screening sensitivity may also vary according to tumour aggressiveness. Aggressive cancers progress rapidly through the preclinical phase, therefore, narrowing the window of opportunity to detect them, before they become symptomatic. Conversely, non-aggressive cancers progress slowly (low grade (I)) through the preclinical phase and so, there is greater opportunity to detect them. Tumour receptor status and grade have been extensively studied in the past and generally suggest that ER-positive and PR-positive tumours are more frequently grade I than grade 3 tumours. These findings concur with more recent studies of this subject.38-40 The association of HER2 with grade has
been less studied and is less consistent than ER and PR although some suggest HER2-positive tumours are more frequently high grade.38,40-42 Molecular studies revealed that the four subtypes varied in the expression of aggressive
genes such as MKI67, CCNB1, and MYBL2 which are known to be associated with cellular proliferation.3,10 Studies
examining the association between subtype and grade reporting both crude and adjusted results were consistent7,21,38,43-53 with few disagreeing studies and suggested that compared to Luminal A, Basal-like and
HER2-enriched subtypes were strongly associated with high-grade. An association between Luminal B and higher grade was also reported in one study.45
Since breast cancer types vary in radiologic appearance at screening and tumour aggressiveness, it is possible they may also vary in screening sensitivity. To date, studies of tumour types and sensitivity compared the proportion of subtypes in interval cancers to that in screen-detected cancers. In general, ER-negative tumours are more frequent in interval cancers than in screen-detected cancers54-66 with few studies not reporting similar findings.67-69 The evidence
for an association of PR status with sensitivity is less consistent than for ER but, in general; studies do not suggest a strong association of PR with sensitivity. While some studies 59,61,62,66 suggest that PR-negative tumours are more
frequent in interval cancers than in screen-detected cancers, many do not report significant findings.55,56,58,60,63,64,67-69
Like studies of PR status and sensitivity, studies of HER2 do not suggest an association with sensitivity. Studies of HER2 and sensitivity are inconsistent with a few reporting an association between HER2-positivity and decreased sensitivity55,63,70 but many more not reporting any significant findings. 40,58-61,64,68
There are few studies of tumour subtypes and sensitivity.60,61,68,71 Most suggest that Triple-negative/Basal-like
subtypes are found more frequently in interval cancers than in screen-detected cancers but, in these studies, all non-Triple-negative and non-Basal-like are used as comparison groups.60,61,68 Thus, apart from Triple- negative, the
Florence compared interval and screen-detected cancers distinguishing all subtypes; however, this study did not report any significant findings but its statistical power was limited.
Given the goal of screening to reduce breast cancer mortality, it is imperative to understand the factors that may influence screening mammography sensitivity. Since the evidence suggests breast cancer types vary in aggressiveness and in radiological appearance, they may also influence screening sensitivity. Therefore, the main objective of this study is to assess the relation of breast cancer types (including tumour subtypes as well as ER, PR and HER2 status) and screening sensitivity. A second objective is to determine if tumour aggressiveness can explain the variability in sensitivity across tumour type if any such variability is observed.
Literature Review
2.1 Breast cancer intrinsic subtypes
2.1.1 Description of intrinsic breast cancer subtypes
According to the World Health Organization (WHO), twenty major histological types of breast cancers are known which highlights their rich phenotypic diversity.2 Most of all diagnosed breast cancers, approximately 70-80%, will be
classified either as invasive ductal carcinoma (IDC) or invasive lobular carcinoma (ILC).5,72 Invasive breast tumours
are those that penetrate all or part of the basement membrane of the epithelial site of origin.73 These tumours are
mostly adenocarcinomas that are thought to be derived from mammary epithelial cells of the terminal duct lobular units (Figure 1).73 Invasive cancers represent a mixture of cancers with different biological and clinical profiles.5,72 For
instance, two invasive ductal carcinomas will differ in their propensity to metastasize and in their response to treatment.73,74 These observations set the stage for more in-depth characterization of breast cancers to assess if
biological differences could also be found at the molecular level.
Figure 1. Breast anatomy and histology.
The basic unit in the breast (left) is the terminal duct lobular unit (middle). Cross-section of the terminal duct lobular unit is represented (right) with luminal epithelial cells lining the lumen (triangular-shaped cells in blue). Myoepithelial cells line the basal membrane (elongated pink cells).
Source: Breast development and anatomy75
Given that histological diversity could not explain all the differences in breast cancer behaviour, Perou et al.2 sought to
characterize breast cancers at the molecular level. They speculated that breast cancers’ histological diversity could generate an equally rich molecular diversity2 which in turn, could help further understand breast cancer behaviour. In
their landmark study2, the authors characterized the gene expression from 8102 human genes and identified 496
between different tumours in 65 breast cancers obtained from 42 patients. Tumours with similar gene-expression patterns were grouped using a hierarchical clustering method76 (Figure 2) . Based on this method, two distinctive
groups of breast cancers emerged based on the expression of the estrogen receptor (ER) and ER-associated genes.2
This finding was compatible with breast cancer biology since estrogen is believed to play a crucial role in breast cancer aetiology.5 Its role in aetiology is consistent with the fact that estrogen binds to the nuclear ER and controls
cell proliferation,5,77 moreover, hormone therapy such as Tamoxifen treatment, which targets ER, has been found to
increase survival.78,79
The cluster expressing ER (ER-positive) comprised tumours that had a gene expression profile similar to the gene profile of luminal cells found in the normal breast (Figure 1)80 and was aptly named Luminal A subtype.4 Within this
same ER-positive cluster, a group of tumours were also found to overexpress HER2 and was named Luminal B to distinguish it from the Luminal A group which did not overexpress this receptor. In the cluster not expressing ER (ER-negative), two groups of tumours were observed which also were differentiated by the expression of HER2. The cluster of ER-negative tumours overexpressing HER2 and HER2-associated genes such as GRB7 was named HER2-enriched.3,4 The role of HER2 in breast cancer can be inferred from the biological therapy with humanized
antibody Transtuzumab that target HER2.70 The remaining group of tumours within the ER-negative cluster did not
overexpress HER2. However, this group was rich in cells expressing cytokeratins (CK), which are usually expressed in normal breast myoepithelial, or basal cells that underlie the breast luminal cells (Figure 1), and was thus termed Basal-like subtype.4
All of these studies inspired a new molecular taxonomy for breast cancers, 2-4,6,74,81 and the term "intrinsic subtypes"
was adopted to reflect each of the subtype’s unique biological properties.3 The four studied intrinsic subtypesab are
Luminal A, Luminal B, HER2-enriched, and Basal-like.2-4,6,74,81
Luminal A
The Luminal A subtype has a gene expression pattern resembling the gene expression of the cells of the luminal epithelial layer of the breast and is characterized by the expression of ER, PR and genes associated with ER activation.5,6 In particular, Luminal A breast cancers have high expression of ER and ER-regulated genes such as
GATA-binding protein 3 (GATA3), X-box –binding protein (XBP1), and Forkhead box protein A1 (FOXA1), and low expression of proliferative genes such as proliferation associated antigen Ki-67 (MKI67), cyclin B1 (CCNB1), and Myb-related protein 2 (MYBL2). 3,8-10,82 Luminal A is the most frequent tumour subtype representing about 55-65% of
a Perou et al.2 originally also reported a normal-like subtype. However, this last subtype is believed to be laboratory contamination and will not be studied in this
work.3
b Additional studies have been published since alluding to the possible existence of other subtypes. However, this work will focus on subtypes which have been extensively studied and which have been found to have clinical relevancy.
total breast cancers diagnosed.5 Patients diagnosed with this subtype are treated with Tamoxifen, and have a better
prognosis than all other subtypes with an average 5-year survival of 75-90 %.5,7,8,11
Luminal B
Like the Luminal A subtype, this subtype is associated with the expression of ER, PR and genes involved in ER-regulation. In contrast to Luminal A, the Luminal B subtype also expresses HER2 and HER2-associated genes (ERBB2 and GRB7). In addition, it is also rich in genes associated with proliferation like MKI67, CCNB1, and
MYBL2.3,82 This subtype is not very frequent compared to Luminal A, and represents about 7-12% of total diagnosed
cancers. Patients diagnosed with this subtype can benefit from Tamoxifen, and possibly Transtuzumab, but the average 5-year survival can range anywhere from 45-90%.5,7,8,11
HER2-enriched
Unlike the Luminal A and B subtypes, the HER2-enriched subtype does not express of ER, PR and ER-associated genes but overexpresses HER2 and HER2-associated genes (ERBB2 and GRB7). Human growth factor receptor 2, or HER2, is a transmembrane receptor tyrosine kinase and the amplification of the gene or protein overexpression is associated with accelerated cell growth and proliferation.77 GRB7 is a gene encoding for growth factor receptor-bound
protein 7, which is an adapter protein that interacts with tyrosine kinases, and signalling molecules.83 This subtype
highly expresses genes involved in cellular proliferation such as MKI67, CCNB1, and MYBL2.3,82 It is the least
common of all subtypes and represents about 6-10% of total breast cancers diagnosed. Although patients diagnosed with this subtype can benefit from targeted therapy such as Transtuzumab, the average 5-year survival is poorer than for Luminal subtypes, and ranges from 20-75%.5,7,8,11
Basal-like
Like the HER2-enriched subtype, Basal-like does not express ER, PR and ER-associated genes. But it also does not express HER2. It is characterized by high level expression of genes KRT5, KRT6, and KRT17 encoding for epithelial cytokeratins 5, 6, and 17.3 This subtype also highly expresses genes involved in cellular proliferation MKI67, CCNB1,
and MYBL2.3,82 It represents approximately 10-15% of total breast cancers diagnosed, and also has a poorer
prognosis than Luminal subtypes with an average 5-year survival of 30-80%.5,7,8,11 Unlike the other subtypes, women
Figure 2. Dendrogram from hierarchical clustering of 115 tumour samples.
Columns represent tumour samples while rows are representative of specific genes (genes shown ER, HER2, CK2, HER1). Gene overexpression compared to a reference standard sample is represented in red while low expression of the gene against the standard is in green. A Molecular-signatures specific to each breast cancer subtype is shown (left to right): Luminal A (purple branches), Luminal B (blue branches), and HER2-enriched (pink branches), Basal-like (orange branches) and Normal-like (green branches). B Corresponding immunohistochemistry classification according to ER, PR, and HER2 status is shown at bottom of the dendrogram.
Source: Race, breast cancer subtypes, and survival in the Carolina Breast Cancer Study.7
2.1.2 Classification of breast cancer subtypes by immunohistochemistry
Identification of breast cancer subtypes by immunohistochemistry
The use of gene-expression based assays while very informative is both laborious and expensive, and a simpler method to recreate the molecular-derived subtypes was required for routine clinical work. Immunohistochemistry (IHC), a protein-based assay, is a relatively simple laboratory method that is widely used in pathology laboratory and proved a practical alternative to approximate the subtypes.7,84
IHC takes advantage of the capacity of antibodies to bind to very specific antigens.85 Sections of breast tumours are
incubated with specific antibodies directed at ER, PR, HER2, and CK5/6 proteins.86 For tumours expressing one of
these markers, the specific antibody will bind it and form a complex. A secondary antibody, linked to an enzyme will target this complex.85 A substratec is added and an enzymatic reaction occurs leaving a colour deposit at the site of
the complex. Under the microscope, areas that contain bound antibody will appear darker than other areas. By this method, it is then possible to estimate the number of positive staining cells for a specific marker from a section of
c A substrate is a substance that reacts with an enzyme.82
A
tumour. According to current guidelines, if more than 1% of tumour cells are stained then the tumour sample is considered ER- and PR-positive.87,88
To ascertain HER2 receptor status, IHC is also used to assess protein expression. Tumours are classified as HER2-positive if the IHC score is 3+, meaning intense membranous staining of > 30% of tumour cells. 89 Scores of 0 or 1+
are considered HER2-negative.89 Tumours classified, as 2+ are considered equivocal and need to be analyzed by
fluorescent in situ hybridization (FISH). FISH is a laboratory procedure that uses fluorescent probes to detect DNA sequences on a chromosome.90,91 These detected areas light up when viewed under a fluorescent microscope and
show whether or not there are many copies of the HER2 gene in cancer cells.92 HER2 is considered amplified if on
average more than six copies of the HER2 gene are detected per cell, or if more than 2.2 HER2 genes are counted for every copy of chromosome 17 (or CEP 17, the reference gene).89 A result is considered equivocal if on average
four to six copies of HER2 are counted per cell, or if 1.8 to 2.2 HER2 genes are counted per copy of chromosome 17.89 If there are less than four copies of HER2 per cell, or if the HER2 to CEP 17 ratio is less than 1.8, then the result
is negative.89
Unlike ER, PR, and HER2, assessment of CK 5/6 by IHC to approximate the Basal-like subtype is not routinely performed and is considered insufficiently reproducible for general use.31,34,93 In standard practice, the absence of ER,
PR and HER2 receptor expression is considered a proxy for Basal-like, but because it doesn’t include results for cytokeratins, it is called Triple-negative.93-95 In the literature both terms are used depending if cytokeratins were
assessed but Triple-negative is the most common terminology.d
Combinations of IHC-derived markers (ER, PR, and HER2) were subsequently validated7 to determine the
classification that best matched the original gene expression patterns (Table 1).ef
Table 1. Breast cancer subtypes determined by IHC assessment of ER, PR, and HER2 status.
Breast cancer subtypes IHC classification
Luminal A ER + and/or PR + HER2-
Luminal B ER + and/or PR + HER2+
HER2 – enriched ER- PR - HER2+ Triple – negative ER- PR - HER2-
dTriple-negative will be used in this work while the term Basal-like will be used when cited in the literature.
e Some studies examine tumour in terms of ER, PR and HER2 status separately. In this work, we will use both these individual receptors and the subtypes. For ease of interpretation, we refer to both these groups as types.
2.1.3 Section summary
Molecular studies allowed us to gain a better understanding of breast cancer biology. They allowed classifying breast cancers according to four distinct intrinsic subtypes (Luminal A, Luminal B, HER2-enriched and Triple-negative). These subtypes can be approximated by determining the status of the ER, PR, and HER2 receptors using IHC. Therefore, researchers can now study all breast cancer types meaning in terms of each individual receptor or combine them to reproduce the subtypes. Classifying breast cancers according to types has allowed clinicians to better treat patients, and has paved the way for further studies concerning breast cancer aetiology, detection and progression.8
2.2 Breast cancer types and aggressiveness
Aggressiveness can be thought of, as the potential of the cancer to grow and spread. It is a broad term encompassing cellular proliferation, cellular differentiation, and tumour dissemination.96,97 The ability of a tumour to proliferate,
differentiate and disseminate is dictated by its aggressiveness, which is a biological characteristic of the tumour.
2.2.1 Markers of aggressiveness
Molecular studies not only showed that breast cancers could be classified according to distinct subtypes but also revealed that they differed in the expression of aggressive genes such as MKI67, CCNB1, and MYBL2 3,82
Aggressiveness in breast cancers can be assessed by evaluating histological grade, determining KI-67 expression and quantifying the S-phase fraction. Determining the histological grade, which measures the degree of cellular differentiation,97,98 is an ideal method to infer tumour aggressiveness since it was reported to correlate well with
proliferative genes identified in earlier molecular studies.2 Since proliferative genes MKI67, CCNB1, and MYBL2
encode for cell cycle proteins, the Ki-67 index, which measures the expression of the nuclear protein Ki-67, and the S-phase fraction, which measures the rate of cell turnover or proliferation97 can also be used to infer aggressiveness.
Studies of these three markers suggest that the Ki-67 index correlates with the S-phase fraction and the mitotic index, an integral component of the histological grade.99
Histological grade
Differentiation is the process, or is the result of the process, where during development an organ or a body part is modified into a special form or for a specific function.100 Fully differentiated tissue is normal tissue with normal
structures and function; all tumours are less differentiated in one of these characteristics.100 The degree of
differentiation will be inversely related to the extent to which these characteristics have been lost.100 There is a
relationship between the extent of differentiation of a tumour and its biological behaviour for instance; poorly differentiated tumours tend to be more aggressive than well-differentiated tumours.101 The difference in differentiation
between the tumours relative to normal tissue can be assessed by the histological grade.5,98 Various methods to
evaluation has been improved over the years by adding standardized criteria to reduce subjectivity and improve concordance.73 Bloom and Richardson first improved the method by adding numerical scoring but clear criteria for
cut-offs was still lacking.102,103 Elston and Ellis then modified the Bloom Richardson systemg by establishing criteria,
and were able to achieve greater objectivity and concordance.73,102 The method, also known as Nottingham Grading
System, is considered reproducible and is recommended internationally as the reference method.98,104-106 Grade is
assessed under microscopy for three morphologic features: 1) degree of tubule or gland formation, 2) degree of
nuclear pleomorphism which is the change in size and shape of nuclei98,105 and 3) mitotic count which is used to
measure the degree of cellular proliferation by counting the number of mitotic bodies per 10 high power fields of view.98,107 These three features are scored individually on a scale from 1 to 3 (Table 2), and the three scores are then
added to obtain a total score ranging from 3 to 9. This total score is used to assign a grade ranging from Grade 1 to Grade 3.73,106 (Table 3)
Table 2. Features and related scores to evaluate histological grade according to the Elston-Ellis* grading
method.
Features Score
Tubule and gland formation
Majority of tumour (>75%) 1
Moderate degree (10-75%) 2
Little or none (<10%) 3
Nuclear pleomorphism
Small, regular, uniform cells 1
Moderate increase in size and variation 2
Marked variation 3
Mitotic count†
≤ 7 mitoses per 10 high power fields 1
8-14 mitoses per 10 high power fields 2
≥ 15 mitoses per 10 high power fields 3
* Elston-Ellis method 102
† Mitotic count criteria will vary depending on the field diameter of the microscope of the pathologist; criteria given for 0.50 mm field diameter.108
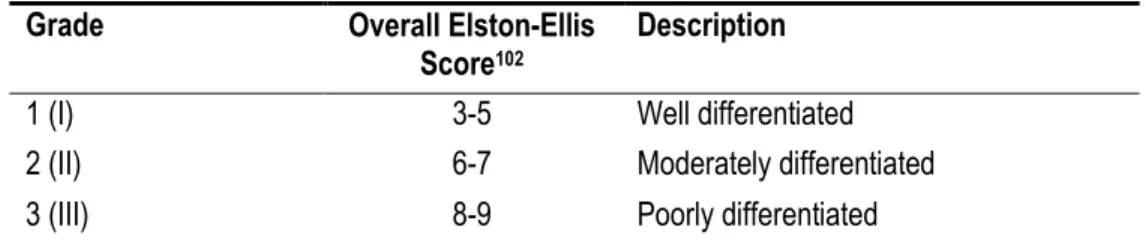
Table 3. Summary and description of Grade 1, 2, and 3.
Grade Overall Elston-Ellis
Score102 Description
1 (I) 3-5 Well differentiated
2 (II) 6-7 Moderately differentiated
3 (III) 8-9 Poorly differentiated
A grade 1 tumour is considered well-differentiated meaning that it retains features of normal breast tissue (Figure 3, Box B vs. Box A). Tumour cells grow following a slow and organized pattern.109 Grade 1 tumours are not considered
aggressive. Grade 2 tumours are moderately differentiated in that they show some tissue changes relative to normal breast tissue (Figure 3, Box C vs. Box A). They are considered moderately aggressive. Grade 3 tumours are poorly differentiated in that the tissue has lost any semblance to normal breast tissue. These tumour cells grow following a rapid and disorganized cell pattern (Figure 3, Box D vs. Box A), and the tumours are considered aggressive.
Normal Breast Grade I Grade II Grade III
Figure 3. Typical histological views of tumours by grade scores relative to normal breast tissue.
Grade I (B) tumour still possesses features of normal tissue (A) and is considered well-differentiated. Grade II (C) tumour shows some tissue changes relative to normal tissue (A). Grade III tumour (D) does not resemble normal tissue, and is considered less differentiated than normal breast tissue (A).
Sources: Diagnosis of breast cancer110 (A)
Breast cancer prognostic classification in the molecular era: the role of histological grade. 98 (B, C, D)
Ki-67
Ki-67 is a protein expressed in the nucleus in proliferating cells during all cell cycle phases, except at the resting state (G0).107 The function of the protein is not well known but seems to play a role in cell proliferation.111 The Ki-67 protein
can be assessed by IHC but may be difficult to interpret since its expression may be heterogeneous in tumours.99 It is
estimated as the percentage of tumour cells positively staining for Ki-67 protein.111 A consensus has yet to be
reached on relevant reference values but IHC staining of <10% of tumour cells generally represents a tumour that is low proliferative, 10-20% represents a borderline proliferative tumour, and >20% is considered highly proliferative.112
Although both the Ki-67 and S-phase fraction give an indication of cellular proliferation, the assessment of Ki-67 is less cumbersome than quantifying the S-phase fraction.96
S-phase fraction
S-phase fraction (SPF) is a measure of proliferation and refers to the fraction of cells engaged in DNA synthesis107
and is determined by flow cytometry.96,97 This method allows obtaining information on the number of cells synthesizing
DNA and their DNA content113 but the analysis can be hampered by pronounced intratumour heterogeneity.99 Like
Ki-67, there is no current agreement on relevant reference values. Tumours with SPF results of <6% are considered low proliferative, 6-10% moderately proliferative, and >10% highly proliferative.112
2.2.2 Breast cancer types and aggressiveness
Molecular studies revealed that breast cancers were heterogeneous diseases and could be classified according to subtypes each with distinctive gene profiles. These subtypes can be reproduced with immunohistochemistry by assessing the status of ER, PR and HER2 receptor expression. Molecular studies also showed that these subtypes had different levels of expression of proliferative genes; hinting that they could also vary in aggressiveness.
ER, PR, HER2 and Histological Grade
The relationship between ER, PR and histological grade is well established and has been the subject of numerous studies dating as far back as 1975.114 In two recent studies,38,39 ER-positive tumours were found to be more frequently
Grade I than Grade III. Indeed, Chen et al.38, reported that ER-positive were more frequently Grade I than Grade II
and Grade III tumours (90.4% vs. 71.9% vs. 44.2%, p<0.0001, respectively). Similarly, PR-positive tumours were more frequently Grade I (78.9%) than Grade II (69.3%) and Grade III tumours (46.2%), (P<0.0001), respectively. This study had a large sample size and also assessed histological grade according to the recommended Nottingham Grading System. Sarode et al.39 reported similar results despite using a smaller sample size and using lower
threshold of positivity for ER and PR (5%) compared to Chen et al. 38 who used 10% as a threshold. They similarly
report that ER and PR expression levels decrease with increasing grade, P<0.0001 and P=0.0051, respectively. However, none of these studies adjusted for possible confounders. But even adjusted studies40 reported that ER and
PR-positive tumours were inversely associated with high grade compared to ER and PR-negative tumours. However, although this study adjusted for tumour size, vascular invasion, lymph node status and mode of detection no point estimates were provided.
HER2-positive tumours have been generally associated with higher grade 115 but the evidence is not as consistent as
ER and PR. In a recent study,38 HER2-positive tumours were more often Grade III than Grade II or Grade I tumours
(29.2% vs. 25.5% vs. 4.2%, P<0.0001, respectively). Lesser quality studies also reported similar observations despite not providing quantitative information41 and classifying HER2 2+ as negative without FISH confirmation.42 Moreover, a
HER2-positivity was associated with higher grade when compared to HER2-negative tumours, but no point estimates were provided.40 On the other hand, Sarode et al.39 reported no statistical difference in mean HER2 amplification ratios
between Grades I, II and III tumours (mean FISH ratios 3.3, 5.2, and 4.3, respectively, P-value not provided). However, the authors performed FISH on tumour samples only scoring 2+ and 3+ in IHC. Since this pool of samples will be biased to HER2-positivity, it may explain the non-significance of the results.
Subtypes and Histological Grade
Studies (reporting both crude and adjusted results) examining the association between subtype and grade were consistent. 7,21,38,43-53 Compared to Luminal A, Basal-like and HER2-enriched subtypes were strongly associated with
high-grade tumours. An association between Luminal B and higher grade was also reported in one study when compared to Luminal A.45 In studies reporting adjusted results (Table 4), strong associations were reported between
grade and subtype, notably for HER2-enriched and Basal-like. In a well-cited study by Carey et al.,7 HER2-enriched
tumours and Basal-like were more likely high (III) than low/moderate grade (I/II) (adjusted OR= 6.2, 95% CI= 2.4-16.0 and OR=8.3, 95% CI= 4.4-15.6, respectively), compared to Luminal A but no difference was noted for Luminal B (adjusted OR 1.0, 95% CI= 0.5-1.7). A subsequent study using a larger sample size of 1018 cases, reported that compared to Luminal A, HER2-enriched and Basal-like were more likely high (III) than low/moderate (I/II) grade (adjusted OR=3.6, 95% CI=2.1-6.3 and OR=5.3, 95% CI= 3.5-8.1, respectively) and again no difference was noted for Luminal B (adjusted OR=1.4, 95% CI= 0.8-2.6).46 In a following study that included slightly more cases (1082 cases),
results concurred with those of Carey et al.7 and Tamimi et al.46 except for the Luminal B subtype. Luminal B,
HER2-enriched and Triple-negative were more likely poorly differentiated than well/differentiated tumours (adjusted OR= 3.1, 95% CI=2.0-4.8, OR 10.7, 95% CI=6.0-19.2, and OR=14.1, 95% CI=8.7-22.7, respectively) compared to Luminal A.45
The difference in these results may be due, at least in part, to the IHC criteria used to determine HER2 positivity since both Carey et al.7 and Tamini et al.46 used a lower threshold (2+ and 3+ are positive), than Onitilo et al. 45 (3+ positive,
2+ negative unless verified by FISH) and did not confirm amplification of the HER2 gene by FISH. Therefore cases that Onitilo et al.45 would have considered HER2-negative, Carey et al.7, and Tamini et al.46, would have considered
HER2-positive, and their Luminal B category may represent a group which includes Luminal A, a less aggressive subtype.
Table 4. Characteristics of studies reporting adjusted results for the relationship between subtypes and histological
grade. *
ER, PR, HER2 and S-phase Fraction and Ki-67
The S-phase fraction (SPF) has now been largely replaced by the histological grade to infer tumour aggressiveness, and much of the literature on this topic is not very recent. In a systematic review conducted in 1998116 the authors
retrieved 19 articles published in the span of 10 years (1987-1997) examining the association of SPF and hormone receptors. In general, most studies reported that hormone receptor positive (ER and PR) tumours were most likely low SPF tumours, despite using different techniques and cut points, with few studies refuting the findings. In the most recent study in 2001, 117 ER-negative tumours had higher levels of SPF (defined as the third SPF tertile) (62.7%) than
ER-positive tumours (27.5%) (P<0.00001). Similarly, negative tumours had higher levels of SPF (55.6%) than PR-positive tumours (26.0%) (P<0.00001). These results agree with past studies. All studies to date have only reported crude results.
Studies examining HER2 and SPF are scarce.118-120 In the most recent study published in 2001, which also included
the largest number of cases (295 cases), positive tended to have a high SPF (defined as ≥6.1%) while HER2-negative tumours tended toward lower SPF (P<0.001). This result concurs with others, and although it is difficult to draw conclusions based on these few studies, results are suggestive of a more aggressive profile for HER2-positive tumours. However, like ER and PR studies, these studies also only reported crude results.
Author Year Subtypes IHC Thresholds N Adjusted
OR (95% CI)† Grade III vs. I/II
Adj. Grade method Carey et al.7‡ 2006 Luminal A Luminal B HER2-enriched Basal-like ER+, PR+ if >5% stained HER2+ if ≥10% stained Cytokeratin+ if any stained
255 100 33 100 1.0 (Referent) 1.0 (0.5 – 1.7) 6.2 (2.4 – 16.0) 8.3 (4.4 – 15.6) Age, race, stage Nottingham I-III Tamimi et al.46§ 2008 Luminal A Luminal B HER2-enriched Basal-like ER+, PR+ if >10% stained HER2+ if >10% stained (2+, 3+)
Cytokeratin + if any stained
730 46 64 132 1.0 (Referent) 1.4 (0.8 – 2.6) 3.6 (2.1 – 6.3) 5.3 (3.5 – 8.1) Age Nottingham I-III Onitilo et al.45ǁ 2009 Luminal A Luminal B HER2-enriched TPN ER+, PR+ if >20% stained HER2+ if >10% stained or 3+ FISH if 2+ 781 116 85 152 1.0 (Referent) 3.1 (2.0 – 4.8) 10.7 (6.0 – 19.2) 14.1 (8.7 – 22.7)
Age Not available
* OR= odds ratio, CI=confidence interval, Adj=adjustments. † Bold results are statistically significant.
‡ Luminal A: ER+ and/or PR+ HER2-; Luminal B: ER+ and/or PR+ HER2+; HER2-enriched: ER- PR- HER2+; Basal-like: ER- PR- HER2- CK5/6+ and/or HER1+
§ Luminal A: ER+ and/or PR+ HER2-; Luminal B: ER+ and/or PR+ HER2+; HER2-enriched: ER- PR- HER2+; Basal-like: ER- PR- HER2- CK5/6+ ǁ Luminal A: ER+ and/or PR+ HER2-; Luminal B: ER+ and/or PR+ HER2+; HER2-enriched: ER- PR- HER2+; TPN: ER- PR- HER2-
Studies have also focused on ER, PR, HER2 and Ki-67. In a recent literature review conducted in 2005111, the
majority of studies (9 of 12 studies) suggested that ER and PR-positivity were associated with lower levels of Ki-67. The results for HER2-positivity and Ki-67, however, were less consistent than ER and PR. In five studies, three suggested an association between HER2-positivity and high Ki-67 expression. According to the author, discordances in results may be due mostly to differences in laboratory protocols between studies.111
Subtypes and S-phase fraction and Ki-67
Given the infrequent use of the SPF as a routine proliferative marker, there is a paucity of literature examining SPF and subtypes. However, there is some evidence to suggest that higher levels of SPF are more frequent in HER2-enriched and Triple-negative subtypes than in Luminal subtypes. In the only study retrieved, Del Casar et al.43
reported in 2008, luminal tumours (Luminal A and Luminal B tumours) had more frequently lower SPF values (<7.69%) than Basal-like and HER2-enriched tumours (P=0.03). However, there was a considerable amount of missing data for SPF that exceeded 35% and the results were limited to a crude analysis; therefore, they need to be interpreted carefully.
There were more studies of subtypes and Ki-67 but comparing results is difficult due to different definitions of subtypes used and lack of standardized Ki-67 cut-off.39,48,49,51 In the study classifying subtypes according to
recommended criteria using ER, PR, and HER2 receptor status,51 Luminal A tumours were more frequent in the low
(≤ 5%) and middle (5-20%) Ki-67 category while Luminal B, Triple-negative, and HER2-enriched tumours were more frequent in the high (>20%) Ki-67 category (P<0.0001).
2.2.3 Section summary
Aggressiveness when assessed by histological grade, SPF, and Ki-67 seems to vary by receptor status and subtype. In general, ER-positive and PR-positive tumours are less aggressive than their negative counterparts while HER2-positive tumours are more aggressive than HER2-negative tumours. Luminal A seems to be the least aggressive subtype when compared to Luminal B, HER2-enriched and Basal-like/Triple-negative. Luminal B seems to be moderately aggressive; it is more aggressive than Luminal A but less aggressive than HER2-enriched and negative tumours. Conversely, compared to luminal tumours, HER2-enriched and Basal-like/Triple-negative are very aggressive.
2.3 Breast cancer types and radiologic features
Since breast cancer subtypes have unique biological properties, these differences may influence the radiological appearance of the tumour on the screening mammogram.
2.3.1 Definition and description of radiologic features
A standardized lexicon is used by radiologists to describe features of suspected breast lesions on a mammogram, and depending on the lesion, or radiologic feature, it will be described according to its shape, margins, and morphology. The main radiologic features observed are masses, calcifications, architectural distortion and focal asymmetric density (Figure 4).121
Masses
A mass represents a cluster of cells that has volume and occupies space.122 On a radiological image, it generally
appears as a circular-like opacity on a mammogram (Figure 4, first box). Masses are typically described in terms of shape (round, oval, lobulated, or irregular) and margins (circumscribed microlobulated, obscured, indistinct, or spiculated) (Figure 5).121
Calcifications
Calcifications represent mineralization of cellular debris and degenerative tumour cells16 and are considered an
important tumour feature. Microcalcifications may represent one the earliest mammographic detectable changes in breast carcinomas in asymptomatic women.16,26,34,123 Calcifications may appear as opaque tiny circular shapes and
are often described in terms of morphology for instance, round, amorphous, pleomorphic, fine-branching or casting or clustered (Figure 5).121
Mass Microcalcifications Architectural Distortion Focal Asymmetric Density
Figure 4. Radiologic abnormalities of the breast.
From left to right, a breast mass (A), microcalcifications (B), architectural distortion (C), and focal asymmetric density (D).
Source: Breast abnormalities typically discovered by mammogram.122
D
B
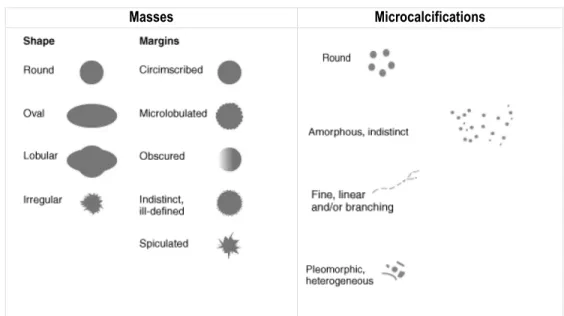
Masses Microcalcifications
Figure 5. Drawn representation of mass shapes and margins, and examples of
microcalcification morphologies.
Source: The Abnormal Mammogram in Holland-Frei Medicine 124
Architectural Distortion and Focal Asymmetric Density
Architectural distortion refers to a distortion or warping of breast tissue.122 On a mammogram, architectural distortion
will have the appearance of spicules (stellate lesion) without an accompanying mass (Figure 4, box C).122
Fibroglandular tissue is relatively symmetrical in both breasts but in focal asymmetric density an area of obscure tissue occurs in only one view (Figure 4, box D).122
2.3.2 Breast cancer types and radiologic features
The notion that tumour appearance at mammography may be related to tumour biology has been of interest for some time with the earliest study published in 1983 by Broberg et al.19 Several studies have subsequently followed
examining variation of radiologic features of tumours according to their ER, PR, HER2 receptor status and their subtype classification.
ER, PR, HER2 and radiologic features
Masses
In general, studies looking at ER, PR, and HER2 receptor status and radiologic features suggest that ER-positive tumours (invasive/DCIS) more frequently present as spiculated masses than do ER-negative tumours. This was a relatively consistent finding despite obtaining radiologic features from diagnostic mammograms,12-15 a mix of
screening and diagnostic mammograms,16 and unspecified mammograms.17-20 A single study published in 199115
adjusted for possible confounders (age and tumor stage) and agreed with crude results, and reported that ER-positive tumours were more likely than ER-negative tumours to present as spiculated masses than other features
(circumscribed masses, focal density, no lesion), (OR=1.30, 95% CI=1.00-1.68). One study22 disagreed and reported
no significant results. However, quantitative results and information on laboratory methods were not provided to compare findings.
The relation between PR and masses was less evident than ER. A few studies reported that PR-positive tumours were more frequently than PR-negative tumours to appear as spiculated masses12,20 than circumscribed and
non-visible masses;20 and compared to non-spiculated masses;12 but in others no significant findings were
reported.14,15,17,18,22
There were no studies reporting an association with HER2-positivivity and masses.12,13,18,22-26
Calcifications
Studies of ER and microcalcifications generally suggest that ER-negative tumours (invasive or invasive/DCIS) appear more frequently with microcalcifications than ER-positive tumours.14,15,19,20,27 But this is not always consistent, as
some studies reported that ER-positive tumours appear more frequently with microcalcifications than ER-negative26,
and others found no association between ER status and microcalcifications.16-18,24,28 Discordances in results may be
in part related to laboratory variability and differences in test cut-offs which tended to vary between studies.
In general, studies do not suggest an association between PR status and microcalcifications. Few reported an association with PR-negative tumours (invasive or invasive/DCIS) and microcalcifications,20,27 while others reported
that PR-positive tumours appear frequently with microcalcifications.14,26 The majority of studies did not report any
significant differences between receptor status and microcalcifications.15,17,18,24,28
Unlike PR, the relation between HER2 and calcifications was more consistent in the literature. Generally, compared to HER2-negative tumours, HER2-positive tumours (invasive or invasive/DCIS) tended to appear with microcalcifications22,23,25,26,28-32 and few studies did not report any significant findings between HER2 receptor status
and microcalcifications.18,24 Unfortunately, the study by Ildefonso et al.18 did not provide method information, and
Månsson et al.24 did not provide numerical information to compare studies.
Architectural distortion and focal asymmetric density
The relation between ER, PR, and HER2 and architectural distortion and focal asymmetric density has not been as studied as other radiologic features. There is some evidence that suggests that hormone receptor-negative tumours (ER-negative, PR-negative) appear more frequently as architectural distortions or focal asymmetric densities than hormone receptor-positive tumours.15,18,19 More studies are needed to be able to draw some definitive conclusions
Subtypes and radiologic features
The relation between subtypes and radiologic features has not been extensively studied and there is still a paucity of data. Nevertheless, there is some evidence to suggest a difference in radiologic appearance amongst subtypes. In studies comparing Basal-like tumours to non-Basal tumours,33,34 Luck et al.33 reported that Basal-like tumours were
more likely to appear as ill-defined masses than non-Basal tumours (61% vs. 49%, P<0.001). Wang et al.34 also
similarly reported that Basal-like were more frequently indistinct masses than non-Basal tumours (36% vs. 9%,
P=0.035). In Luck et al.33, non-Basal tumours appeared also more frequently as spiculated masses than Basal
tumours (49% vs. 15%, P<0.001) which is in disagreement with Wang et al.34 who did not find any significant
differences between the two subtypes (P=0.48). The results for architectural distortion also differed between the two studies. Wang et al.34 reported that Basal-like tumours appeared more frequently as architectural distortions than
non-Basal tumours (33% vs. 12%, P=0.02), but this was not significant in Luck et al.33(P=0.302). One possible contributing
factor that may explain the disagreeing findings between both studies is the type of mammograms used to obtain radiologic features. Luck et al.33 included only screening mammograms from screen-detected cancers while Wang et
al.34 included only diagnostic mammograms. Screening mammograms of screen-detected cancers may over
represent radiologic features that are more conspicuous while diagnostic mammograms may represent cancers that were missed at screening such as interval cancers; therefore, the tumours may have less visible features.
There were few studies that included all subtypes.31,35,36 However, Taneja et al.35 used a subtype classification based
on mucin and E-cadherin that is not standard classification, and Tamaki et al.36 did not provide statistics for all
comparisons. Taneja et al.35, reported that compared to Luminal subtypes (defined as ER+PR+, mucin+, nuclear
BRCA+, HER2-, p53-), Basal tumours (defined as ER-PR-, HER2-, p53+) were more frequent as ill-defined masses (47% vs. 26%, P=0.001). This observation is similar to the findings obtained by Luck et al.33 and Wang et al. 34
despite using different comparison groups and subtype definitions. Taneja et al.35 also reported significantly more
spiculated lesions in Luminal subtypes than in Basal and HER2a and HER2b subtypes. Ko et al.31 also reported a
higher proportion of masses in Triple-negative tumours (49%) than in Luminal A (45%) and HER2-enriched tumours (11%), (P<0.0001). However, because no margin descriptors were used in the analyses it is difficult to compare to others. In a study of young premenopausal women, Yang et al.13 reported that compared to HER2-positive and
ER-positive tumours, Triple-negatives were overrepresented in masses with circumscribed, obscured, and indistinct margins (P<0.0001) which is in agreement with Luck et al.33 and Wang et al.34 In addition, one study31 found that focal
asymmetry was more frequent in Triple-negatives (22%) than in Luminal A (8%) and HER2-enriched tumours (6%), (P=0.0030). In this same study, calcifications were overrepresented in HER2-enriched tumours when compared to Triple-negative and Luminal A tumours, (P<0.0001).
A recently published study37 is the first to provide results adjusted for race, age, stage, tumour size and histology. The
CI=1.3-14.1) than other features, a finding not described elsewhere and contrary to Wang et al.34 Luminal B and
HER2-enriched subtypes were also more likely than Luminal A to appear with, rather than without calcifications (OR=2.8, 95% CI=1.7-4.8 and OR=3.1, 95% CI=1.7-5.5, respectively) which is in agreement to crude findings in Ko et al.31 Lastly, Triple-negatives were more likely than Luminal A to appear as a mass (OR=2.5, 95% CI = 1.4-4.4) but like
Ko et al. 31 no margin descriptors were used and HER2-enriched was less likely to manifest as a mass (OR =0.51,
95% CI = 0.3-0.9)
2.3.3 Section summary
Studies examining tumour types (ER, PR, and HER2 and subtypes) in relation to radiologic features suggest that certain types present more frequently with certain radiological appearances. ER-positive tumours and to a much lesser extent Luminal A, appear more often as spiculated masses. Conversely, ER-negative tumours and Basal-like/Triple-negative subtypes are more likely to appear as masses with indistinct or ill-defined margins. Studies also suggest an association with positive tumours and microcalcifications. There are fewer studies of the HER2-enriched subtype but like HER2-positive tumours, the evidence seems to suggest an association with microcalcifications. Results for Luminal B are scarce but a recent study suggests a possible association between this subtype and microcalcifications. This is biologically plausible given the HER2-positive component of this subtype.
Architectural distortion and focal asymmetric density do not seem to be associated with tumour types and there are few studies of this subject. However, a recently published article reported a strong association between architectural distortion and Luminal A which has not been reported elsewhere.
The fact that tumour types may appear differently on mammograms may have implications for screening since features more conspicuous than others may facilitate the detection of the tumour. This means that some tumour types may not be as easily detected by screening mammography as others which may impact the ability of screening to reduce breast cancer mortality.
2.4 Screening Sensitivity
2.4.1 Definition
The end-goal of breast cancer screening is to detect and then treat the cancer early in order to reduce breast cancer mortality. For screening to reach its end-goal the test should have a high sensitivity.5 Screening mammography
sensitivity is defined as the capacity of the test to detect breast cancers among asymptomatic women who are in the preclinical stage of the disease (Figure 6). Therefore, identifying factors that may interfere with sensitivity is imperative to optimize early-disease detection.125
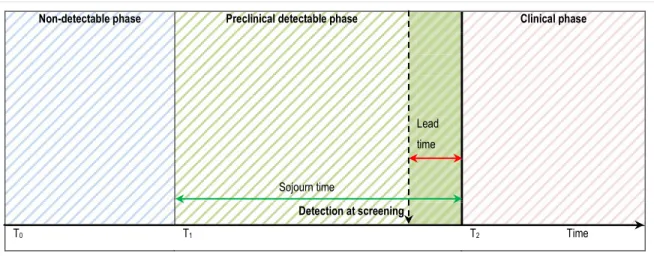
Non-detectable phase Preclinical detectable phase Clinical phase Lead time Sojourn time T0 T1 T2 Time
Figure 6. Representation of the natural history of breast cancer: the non-detectable phase, the preclinical
detectable phase and the clinical phase.
Lead-time (red arrow, dark green box) is the period of time between detection at screening (dashed black arrow) and the time where cancer would have been diagnosed in the absence of screening (bold black line). Sojourn time (green
arrow) is the period that a tumour spends in the preclinical detectable phase, and may be detected by screening.
Adapted from IARC Handbooks of Cancer Prevention: Breast Cancer and Screening73
Sensitivity is the ability of the screening test to designate people in the preclinical detectable phase of the disease as positive. It is the proportion of individuals with detectable pre-clinical cancer whom the screening test labels as positive1 (see Eq. 1). Screen-detected cases are labelled "true positives" while cases with a negative result are
deemed "false-negatives".1
Direct estimation of sensitivity at a population-level is not possible since it is impossible to know the number of women who are in the preclinical detectable phase of the disease126 at screening unless a perfect diagnostic test i.e. 100%
sensitivity, is applied to all women participating in screening. Such a test does not exist.1 Therefore, true sensitivity
can never be known but estimates, or measures of sensitivity, can be obtained.127h Measures of sensitivity are
calculable with observable data with some assumptions. Observable data include interval cancers, which are cancers detected in a determined time period following a normal screening (a predetermined inter-screening interval) and represent the failure of screening.128 In theory, interval cancers may represent a false-negative result from a previous
screen or a cancer that was not in the detectable preclinical period at screening but became clinical in the specified inter-screening interval. We can use data on interval cancers to estimate sensitivity by assuming that they were all in
hIn this work, theoretically we will be estimating measures of sensitivity. To be coherent with the literature, we will simply refer to these as sensitivity for ease of understanding.
Sensitivity = Number of women with preclinical breast cancer who are detected at screening (Eq. 1) Total number of women who have preclinical breast cancer