HAL Id: hal-02432266
https://hal-mines-albi.archives-ouvertes.fr/hal-02432266
Submitted on 8 Jan 2020
HAL is a multi-disciplinary open access
archive for the deposit and dissemination of
sci-entific research documents, whether they are
pub-lished or not. The documents may come from
teaching and research institutions in France or
abroad, or from public or private research centers.
L’archive ouverte pluridisciplinaire HAL, est
destinée au dépôt et à la diffusion de documents
scientifiques de niveau recherche, publiés ou non,
émanant des établissements d’enseignement et de
recherche français ou étrangers, des laboratoires
publics ou privés.
Supporting group decision makers to locate temporary
relief distribution centres after sudden-onset disasters:
A case study of the 2015 Nepal earthquake
Hossein Baharmand, Tina Comes, Matthieu Lauras
To cite this version:
Hossein Baharmand, Tina Comes, Matthieu Lauras.
Supporting group decision makers to
lo-cate temporary relief distribution centres after sudden-onset disasters: A case study of the 2015
Nepal earthquake. International Journal of Disaster Risk Reduction, Elsevier, 2020, 45, pp.101455.
�10.1016/j.ijdrr.2019.101455�. �hal-02432266�
International Journal of Disaster Risk Reduction 45 (2020) 101455
Available online 23 December 2019
2212-4209/© 2019 The Authors. Published by Elsevier Ltd. This is an open access article under the CC BY license (http://creativecommons.org/licenses/by/4.0/).
Supporting group decision makers to locate temporary relief distribution
centres after sudden-onset disasters: A case study of the 2015
Nepal earthquake
Hossein Baharmand
a,*, Tina Comes
a,b, Matthieu Lauras
caDepartment of ICT, University of Agder, 4879 Grimstad, Norway
bFaculty of Technology, Policy and Management, TU Delft, 2628 BX Delft, the Netherlands cIMT Mines Albi, Industrial Engineering Department, University of Toulouse, 81000 Albi, France
A R T I C L E I N F O
Keywords:
Humanitarian response Group decision-making Multiobjective facility location Monte Carlo simulation 2015 Nepal earthquake
A B S T R A C T
In the humanitarian response, multiple decision-makers (DMs) need to collaborate in various problems, such as locating temporary relief distribution centres (RDCs). Several studies have argued that maximising demand coverage, reducing logistics costs and minimising response time are among the critical objectives when locating RDCs after a sudden-onset disaster. However, these objectives are often conflicting and the trade-offs can considerably complicate the situation for finding a consensus.
To address the challenge and support the DMs, we suggest investigating the stability of non-dominated al-ternatives derived from a multi-objective model based on Monte Carlo Simulations. Our approach supports determining what trade-offs actually matter to facilitate discussions in the presence of multiple stakeholders. To validate our proposal, we extend a location-allocation model and apply our approach to an actual data-set from the 2015 Nepal earthquake response. Our analyses show that with the relative importance of covering demands �0:4, the trade-offs between logistics costs and response time affects the numbers and locations of RDCs considerably. We show through a small experiment that the outputs of our approach can effectively support group decision-making to develop relief plans in disasters response.
1. Introduction
The response to sudden-onset disasters is typically characterised by the influx of many organisations and individuals that rush to help the people in need. The humanitarian community thus relies on collabora-tion and coordinacollabora-tion, which require joint or aligned decision-making within and across organisations [1]. There is strong evidence that decision-making on the front-line of humanitarian operations is a social process [2,3]. Therefore, group decisions are very common in the hu-manitarian disasters response, specifically in the United Nations (UN) cluster coordination system [4].
According to Wu & Xu [5]; conflicting objectives can challenge and prolong the process of finding a consensus in group decisions. This challenge is specifically prominent in international disaster response, characterised by many actors working under pressure, and examples have been observed for instance in inter-organisational forums, such as inter-cluster or clusters [2,6]. Observations show that humanitarian
organisations (HOs) often have different preferences and sometimes follow conflicting objectives [7]. In such contexts, the larger the decision-making group, the more difficult and time-consuming it is to come to decisions [8,9].
Incorporating the preferences and objectives of multiple actors is specifically necessary for problems in sudden-onset natural disasters response such as locating temporary relief distribution centres (RDCs) [10]. The choice of locations sets the basis for other decisions, like transportation or routing [11,12]. Including the interests of all stake-holders improves the sense of ownership among responders and facili-tate planning [1,6].
However, attempts to address challenges of group decisions regarding location problems are scarce (e.g, Maharjan & Hanaoka [1] and Maharjan & Hanaoka [9]) where the multi-objective optimisation approach has mainly been followed. In this approach, decision Makers’ (DMs’) preferences can be applied either before the optimisation (a priori approach) or thereafter (a posteriori approach), and several * Corresponding author. Jon Lilletuns vei 9, 4879 Grimstad, Norway.
E-mail address: hossein.baharmand@uia.no (H. Baharmand).
Contents lists available at ScienceDirect
International Journal of Disaster Risk Reduction
journal homepage: http://www.elsevier.com/locate/ijdrrhttps://doi.org/10.1016/j.ijdrr.2019.101455
methods have been used for eliciting such preferences (e.g., goals [13], weights [1] and priorities [9]).
A priori methods require that an agreement on preferences need to be available as input for a decision. While there are many dedicated preference elicitation techniques, they are subject to well-known biases (such as anchoring) and distortions, even if the decision-makers try to reveal their true preferences [14]. Furthermore, applying preferences before optimisation may result in neglecting some non-dominated al-ternatives1 (specifically in non-convex problems) [15].
In contrast, an a posteriori approach presents decision-makers with the full set of non-dominated solutions, allowing them to identify the most satisfactory solution. This approach allows decision-makers to explore trade-offs among objectives and the robustness of performance (e.g., Baharmand et al. [16]). The main problem with a posteriori ap-proaches is typically that the Pareto set can be very large. That said, field-based DMs do not normally have enough time and resources in the response phase to run deliberative processes to elicit the preferences of stakeholders and converge to a consensus among non-dominated alter-natives [9,17].
Research gap: an approach is required to support group decisions in disasters response while incorporating an effective a posteriori articu-lation of preferences.
In fact, much has been written about the humanitarian cluster sys-tem, and the competitive or power-related behaviour that it sparks [18, 19]. However, one of the keys to humanitarian management is infor-mation that is to enable core of timely and effective decision-making [20]. We therefore here focus on the informational over the behav-ioural aspects of decision-making, and assume that decision-makers are rationale, i.e., we assume they follow their mandate and preferences, and do not engage in tactics and political decisions.
To address the research gap, we adapt the findings from Baharmand et al. [16]’s study and suggest a model that determines the Pareto al-ternatives for the number and location of RDCs based on demand coverage, response time, and logistics costs under constrained resources. The model parameters have been informed by an empirical study con-ducted after the 2015 Nepal earthquake. Furthermore, we suggest calculating an overall (performance) value for each Pareto alternative and thereafter, running a sensitivity analysis based on Monte Carlo Simulations to reveal tipping points.
As such, the contribution of our study is threefold. First, our model contributes to the literature by addressing three objectives simulta-neously to locate RDCs in disasters response which, to the best of our knowledge, have not yet been covered in the literature. We benchmark our findings against UN World Food Programme (UN WFP)’s operations and examine the sensitivity of model suggestions to changes in the main parameters. Second, the suggested approach contributes to under-standing what trade-offs actually matter in a given logistics decision. This information offers DMs an indication of where they might need further discussions in the presence of several non-dominated location alternatives. We support this contribution by applying our proposal to the UN WFP’s real dataset for the 2015 Nepal earthquake response. Third, we add to the existing body of research about the value of Monte Carlo Simulations to address the uncertainties and ambiguities [21] regarding the preferences of multiple DMs in disasters response. To validate our proposal and support the second contribution, we conduct a group decision-making experiment based on the described case with participants from multiple HOs.
The remainder of the paper is structured as follows. We provide background regarding the criteria for location problems and methods to address DMs’ preferences when such criteria are modelled in Section 2. In Section 3, our multi-objective location–allocation model is briefly
presented. The sensitivity analysis approach is explained in Section 4. We apply our model to the Nepal case and analyse the trade-offs through our approach in Section 5. We discuss our analysis and experimental results in Section 6. Finally, conclusions are presented in Section 7. Formulation of the model, input data information, study’s question-naire, and the sensitivity analysis of the model are provided in Appendix A, Appendix B, Appendix C and Appendix D respectively.
2. Background
In this section, we first demonstrate the challenges of group decision- making in disasters through the findings of empirical studies in the humanitarian contexts. Then, we review operations research (OR) models to identify relevant criteria for our study. Finally, we investigate what techniques have been used in the literature to address the prefer-ences of multiple stakeholders in group decision-making processes.
2.1. Group decision-making in the disasters
Decision-making after sudden-onset disasters is a challenging task because of ‘ill-structured problems; uncertain dynamic environments; shifting, ill-defined, or competing goals; time stress; high stakes; [and] multiple players’ [22]. To cope with this complexity, humanitarian decision-making guidelines suggest that ‘decisions should be made by a group rather than by individuals’ [2,23–25]. Group decisions are based on a broader information foundation, thus tending to be of better quality [24]. However, group decision-making, particularly where it relies on consensus, can be slow and cumbersome [26–28].
Decision analysis and optimisation-based approaches rely on struc-tured, analytical processes that make important assumptions as to the nature of the problem. However, such assumptions are often not fulfilled [3,29]. Analytical approaches have also been criticised for being rela-tively difficult to converge when the group of DMs is large [25]. As a result, DMs typically find themselves engaged in intuitive forms of decision-making. Such naturalistic decision-making [30] and the connection between sensemaking and decision-making are poorly un-derstood [3,31]. Thus, any attempt to facilitate group decision-making within the analytical approaches can contribute to quicker and easier decisions in the field.
In our study, we focus on an analytical group decision-making approach regarding the location decision. This approach tries to fulfil the requirements of different stakeholders by making the optimal choice with regard to considered criteria systematically. To the best of our knowledge, Maharjan & Hanaoka [9] and Ghavami et al. [17] are the only two studies that discusses group decision-making for logistics de-cisions in disasters response. Maharjan & Hanaoka [9] focus on locating distribution centres after sudden-onset disasters and propose a fuzzy factor rating system to determine the relative importance of minimising unsatisfied demands vs. logistics costs. However, Maharjan & Hanaoka [9] do not provide justification for model assumptions (e.g., uncapaci-tated fleets/facilities) as well as choices to address DMs’ requirements (e.g., considered objectives) and to model preferences (e.g., weights) for managing conflicting objectives. In the other study, Ghavami et al. [17] suggests three phases (pre-negotiation, automated negotiation, and evaluation) to reach a consensus on the relative importance of consid-ered criteria by using software agents. However, Ghavami et al. [17]’s approach (a) do not address the problem of time constraints for eliciting DMs’ preferences, and (b) cannot guarantee the convergence of the negotiation phase. In the following two sections, we further review the literature to identify gaps for supporting DMs.
2.2. OR models for locating RDCs in disasters response
In the humanitarian logistics (HL) literature, OR models have been widely used to address location problems for shelters, medical facilities, warehouses/distribution centres, vehicle hubs, and debris containers in
1 A non-dominated solution or a Pareto optimal solution is the one where an
objective function cannot be improved without reducing the other objective function. [79].
different contexts [32,33]. In this section, we provide an overview of the most important recent publications that have proposed OR models for locating distribution centres and/or warehouses in the contexts of sudden-onset disasters response. Literature reviews with wider scopes can be found in Galindo & Batta [34]; Anaya-Arenas et al. [32]; Habib et al. [35]; and Boonmee et al. [33].
Table 1 shows the list of reviewed papers. We distinguished multi- objective, goal programming and single-objective modelling ap-proaches (cf. Section 2.3). The latter category also includes those papers that transform multiple objectives into a single-objective problem through weights and penalty functions. Interestingly, there are a few objectives that have been frequently used. Several empirical studies have confirmed that minimising the unsatisfied demand (UD), response time (RT) and logistics costs (LC) are of high priority for HOs in sudden- onset disasters response [65–68]. However, as Table 1 shows, these objectives have been rarely addressed simultaneously.
Furthermore, considered assumptions and constraints in the reviewed location models often hardly represent the environment and challenges of the relief operations in the field. According to Galindo & Batta [34] and Anaya-Arenas et al. [32]; considering unlimited fleets capacity, unlimited facility capacity, single commodity and single transportation mean makes the proposed models hardly applicable in reality.
Moreover, to the best of our knowledge, only Baharmand et al. [16]’s consider a distinction between the immediate response and the relief phases after sudden-onset disasters. Baharmand et al. [16] propose a bi-objective model for locating RDCs in the immediate response. Pedraza-Martinez & Van Wassenhove [69] and Kunz et al. [7] highlight that recognising the context is important in order to bridge the gap between research and practice. The immediate response phase is the first
chaotic phase after a disaster, and typically covers the first 72 h after the incident and can last up to two or three weeks. Thereafter, the relief phase covers the time after the immediate response up to the early re-covery [70]. In this phase, as a result of rapid needs assessments, de-mands and beneficiaries are often prioritised and hence, relief operations are more structured [71].
Such distinction not only affects the choice of addressed objectives (time- and cost-efficiency vs. efficiency þ effectiveness) and constraints (scarce vs. more available resources) but also impacts on the nature of input data parameters (stochastic vs. deterministic) [72]. The data is modelled by stochastic and robust approaches in %50 of the reviewed papers that address multiple objectives. Although stochastic and robust methods are strongly recommended for uncertain contexts, it has been proven that they have a limited applicability in sudden-onset disasters response even in the relief phase, owing to a lack of access to (a) probability distributions (for stochastic approaches) and (b) data/-computational resources (for robust approaches) [73].
Moreover, it is interesting that only two of the reviewed papers [16, 59] have benchmarked their outcomes with a real operation although several used a case study. Other reviewed research papers confine their research to numerical analyses based on randomly generated datasets. However, benchmarking results with real operations can provide helpful insights for practitioners, and eventually contributes to convincing HOs, as the final users of proposals, to use decision support systems for a more efficient and effective response [7].
2.3. Modelling preferences in multi-criteria location models
The number of multi-objective location models for the context of sudden-onset disaster response has increased considerably over the Table 1
Characteristics of OR models in the literature for locating facilities in sudden-onset disasters response.
Relevant studies Type of facility Objective(s) Data modelling type Problem modelling method Case study
Horner & Downs [36] DC LC Det SOP ✓
Zhan & Liu [37] DC UD,RT Sto GP
Vitoriano et al. [38] DC RT,LC,OO,FE Det GP
Lin et al. [39] W SC,LC Det SOP ✓
Abounacer et al. [40] DC LC Det SOP
Barzinpour & Esmaeili [41] DC UD,LC Sto GP ✓
Manopiniwes et al. [42] W LC Det SOP ✓
Bell et al. [43] W RT Det SOP ✓
Rath & Gutjahr [44] W UD,LC Det MOP
Khayal et al. [45] DC LC,SC Det SOP
Ahmadi et al. [46] W UD,RT,LC Sto MOP ✓
Najafi et al. [47] DC RT,LC Det MOP
Ransikarbum & Mason [13] W UD,LC,FE Sto GP ✓
Rath et al. [48] DC UD,LC Sto MOP
Zokaee et al. [49] DC LC Rob SOP ✓
Bastian et al. [50] DC UD,LC,RT Sto GP
Gutjahr & Dzubur [51] DC UD,LC Det MOP ✓
Haghi et al. [15] DC UD,LC,SC Rub MOP
Mohamadi & Yaghoubi [52] DC RT,LC Sto MOP ✓
Cao et al. [53] DC UD,RT,FE Det MOP
Nedjati et al. [54] DC UD,RT Det MOP
Golabi et al. [55] DC RT Det SOP ✓
Fereiduni & Shahanaghi [56] DC UD,LC Rob MOP ✓
Timperio et al. [57] DC UD,LC,OO Det MADA ✓
Prabowo et al. [58] W LC Det SOP ✓
Dufour et al. [59] DC UD,RT,FE Det SOP ✓
Maharjan & Hanaoka [1] DC UD, LC Det SOP ✓
Loree & Aros-Vera [60] DC LC,SC Det SOP
Mahootchi & Golmohammadi [61] W UD,LC Sto MOP ✓
Fikar et al. [62] DC UD,LC Det MOP ✓
Vahdani et al. [63] DC RT,LC Rob MOP
Noyan & Kahvecio�glu [64] DC UD,RT Sto MOP ✓
Baharmand et al. [16] DC RT,LC Det MOP ✓
Maharjan & Hanaoka [9] DC UD Det SOP ✓
Distribution Centres (DC); Warehouses (W); Medical Centres (MC); Unsatisfied Demand (UD); Response time (RT); Logistics Costs (LC); Fairness/Equity (FE); Social Costs (SC); Other Objectives (OO); Deterministic (Det); Stochastic (Sto); Robust (Rub); Goal Programming (GP); Single-objective Programming (SOP); Multi-objective Programming (MOP); Multi-attribute decision analysis methods (MADA).
course of the last five years (cf. Table 1). To consolidate conflicting objectives, optimisation should involve a trade-off between two or more objectives. This trade-off can be made before (or after) optimisation through a priori (or a posteriori) articulation of preferences [74]. As a posteriori method offer a Pareto-optimal set to potential decision-makers before their final choices, it can reinforce their confi-dence in the final decision [75]. The Pareto-optimal set consists of all alternative solutions in which one or more objectives cannot be improved without deteriorating the performance of one or of the more other objectives [76]. However, this selection process has proven to be challenging in disasters due to time and resource constraints.
In HL literature, several scholars use methods from multiple criteria decision analysis (MCDA) to address stakeholder’s preferences and model trade-offs between conflicting criteria [77]. The strength of MCDA methods is that they help to achieve consensus and make trade-offs transparent when there are several stakeholders. Common MCDA methods in the HL literature and their ‘decision rules’ are shown in Fig. 1. Generally, MCDA methods can be classified into multiple objective decision analysis (MODA) and multiple attribute decision analysis. A decision rule is a procedure to select one or more from a set of alternatives [78].
The location problem is often addressed with MODA methods. Table 1 from the previous section shows that goal programming and transforming multiple objectives into a single-objective (through pen-alty functions and weights) are the most commonly used methods for addressing location problems in sudden-onset disasters response. There may be two reasons behind this. First, goal programming allows DMs to incorporate pre-specified environmental, organisational and managerial consideration into a model through goal levels and priorities more transparent than other approaches [37]. Second, solving single-objective models is easier and requires fewer computational re-sources than multi-objective models [79]. As shown by darker boxes in Fig. 1, we further examined which preference parameters may need to be elicited from DMs for MODA methods. Table 2 explains if these pa-rameters can be used in a priori and/or a posteriori approach to model DMs’ preferences and address conflicting objectives. Some instances are also provided (if available in HL literature).
All MODA methods in Table 2 that have been used in the literature imply some challenges when it comes to group decision-making. Goal programming and penalty functions imply preference articulation before the optimisation (i.e. a priori articulation of preferences). Weights, costs, goals and penalty functions need to be justified in close collaboration with experts and stakeholders [66], though empirical studies confirm that this is hardly feasible during the response phase [2]. Maharjan & Hanaoka [1] propose using fuzzy factor rating system by a group of DMs to facilitate determining weights for multiple objectives (minimising costs and unsatisfied demand). However, there is an issue with combining a priori articulation of preferences and the weighted sum method. The location problem is typically non-convex (because some variables are often constrained to be integers) [15] and there may exist non-dominated solutions that cannot be found using the weighted sum method [81]. Furthermore, as mentioned earlier, eliciting prefer-ences (although through fuzzy parameters) can add to the length of the decision-making process which is not desirable in the contexts of sudden-onset disasters response.
In a different context, Bertsch & Fichtner [82] suggest that combining sensitivity analysis with multi attribute value theory (MAVT) can provide valuable assistance to help decision-makers in the energy sector. They present a multi-dimensional sensitivity analysis with weight intervals through Monte Carlo Simulation that allows for simultaneous variation of preference parameters to check the stability of a set of five alternatives. They use a posteriori weighted sum approach and address the deficiency of deterministic analysis in dealing with uncertainty of preferences. In general, the deterministic analysis is able to look for the most affecting preference (weight) on the overall value over a few scenarios. However, it is easier in Monte Carlo Simulation
with thousands of scenarios to find preferences showing the largest impact on the final results.
We note that adopting Bertsch & Fichtner [82]’s approach to the location problem after sudden-onset disasters is ineffective. MAVT is often criticised for the risks of cognitive and motivational biases [83] which have been specifically noted among humanitarian DMs [3]. The main challenge is that MAVT may not be able to determine the majority of non-dominated alternative networks (i.e., sets of distribution centres locations). Overall, our review shows that literature lacks a posteriori approach to effectively support locating temporary distribution centres. Having such an approach can facilitate group decision-making significantly.
2.4. Research contribution
Group decision-making processes can be thought of as the series of activities or steps by which information is collected, a decision is made and action is taken on the basis of the decision [73]. Fig. 2 shows a typical group decision-making process in the humanitarian context [2, 8].
We showed in Table 1 that several OR location models support DMs ‘generating decision alternatives’ in the second step. However, some gaps still exist between research proposals and practice requirements for locating temporary distribution centres (cf. Sections 2.1 and 2.2) due to unrealistic assumptions and/or constraints (e.g., Maharjan & Hanaoka [1]. We adapt Baharmand et al. [16]’s findings and develop a model to support the location decision in the relief phase. Our model addresses minimising response time, logistics costs, and unsatisfied demands while considering different assumptions and constraints that have been vali-dated by practitioners. We use multi-objective approach (cf. Section 2.3) to develop our model because it is assumed that identifying non-dominated alternatives with respect to conflicting objectives con-tributes to preparing a strong basis to start the group decision-making process.
In addition, our study contributes to Steps 3 and 4 by presenting a sensitivity analysis approach to test the performance of non-dominated alternatives. We use Monte Carlo Simulation to explore the potential impact of uncertainties in stakeholders’ preferences on the location decision after non-dominated alternatives are determined. Our contri-bution is to help DMs to identify where the important thresholds in the preferences (i.e., weights) are so that they can position themselves with respect to these thresholds. The information from the sensitivity analysis should help DMs to manage conflicting objectives and converge to a consensus quicker in a group decision-making.
3. Multi-objective location–allocation model for generating decision alternatives
We describe the relief distribution network in the affected region during the response as in Fig. 3. A temporary distribution centre, i.e., a staging area (SA), refers to a place which receives relief items from main entry points (MEPs) (e.g. airports, ports), regional warehouses, or local supply points (if any) for temporary storing, additional sorting, and further distribution to the points of demands (PODs). In the 2015 Nepal and the 2016 Ecuador earthquakes response, SAs were a key part of relief distribution networks [6,84].
As depicted in Fig. 3, Baharmand et al. [16] distinguish three layers in the in-country relief distribution network depending on the topog-raphy of the affected region:
i Locations that remain accessible by MEPs through highways or main roads. Relief items are normally sent to these locations by high ca-pacity trucks and/or trailers.
ii Locations that are not accessible by MEPs through highways or main road. These places can be reached from temporary SAs in layer 1
using smaller trucks (like 4 � 4 trucks or tractors). If necessary, air transport can be utilised to support these locations.
iii Remote and hard-to-reach locations; ground transportation is impossible or too risky. The only way to reach beneficiaries in these locations is through air transport, porters, or a combination thereof from SAs in layer 1.
Our model determines the optimum location of SAs and the number of mobile storage units (MSUs) to be erected, the flow of commodities between different layers and inventory at SAs such that the total logistics costs, response time, and unsatisfied demands are minimised. The objective functions of the model have conflicting natures. For the sake of brevity, we only describe the objective functions and constraints in informal terms in this section. The detailed explanations of notations, indices, parameters, decision variables and formulas of objective func-tions and constraints are presented in Appendix A.
First objective: The minimisation of logistics costs is the first objec-tive which consists of ground transportation cost Eq. (A.1), air trans-portation cost Eq. (A.2), recurring cost Eq. (A.3) and human resource cost Eq. (A.4), as formulated below. The ground transportation cost includes the transit cost from MEPs to SAs, MEPs to PODs in layer 1 and SAs to PODs in Layers 1 and 2. Air transportation cost consists of costs related to shipping items from SAs to PODs in level 2 and 3 through air fleets. Recurring cost and human resource cost per location are rough estimations for the duration of the project.
Minimize total logistics costs ¼ Ground transportation cost
þAir transportation cost
þRecurring cost
þHuman resource cost
Second objective: The second objective is the minimisation of response time and consists of two components. The first component consists of the required time for setting up MSUs at located staging areas Eq. (A.5). It includes the result of multiplying required days for erecting one MSU (or multiple MSUs simultaneously) and the summation of the binary variable Et. This variable is calculated by constraints and refers to every attempt to erect one MSU (or multiple MSUs simultaneously). The second component refers to the busy time steps during the operation Eq. (A.6). It represents the summation of the binary variable Lt. This vari-able counts every time step in the network that includes a shipment from MEPs to SAs/PODs and/or from SAs to PODs. The binary variable Lt is determined through the constraints (cf. Appendix A).
Fig. 1. Classification of common MCDA methods in HL literature [77] and preference parameters in MODA.
Table 2
Common methods for modelling preferences in MODA approaches.
Method Brief explanation A priori
(example article)
A posteriori (example article)
Penalty functions Each objective is
formulated in terms of costs. Penalty functions refer to estimated costs of optimising alternative objectives.
✓ (Khayal et al. [45]
Weighted sum The relative importance
of each objective is represented by a weight between 0 and 1. If objectives have different scales, normalisation (weights or objectives) is required. ✓ (Maharjan & Hanaoka [1] ✓ (Maharjan & Hanaoka [9] ε-constraint or lexicographic ordering
Objectives are prioritised and the most priority objective will be optimised while the rest are kept as constraints.
✓ (Laguna- Salvad�o et al. [80] ✓ (Baharmand et al. [16] Goal
programming Certain goals would be considered for each objective and then objectives would be optimised in order to have the least deviation from goals.
✓ [13]
Minimize total response time ¼ MSU setup time þ Operation time
Third objective: This objective minimises the total unsatisfied de-mands, as formulated below. It consists of the summation of differences between the sent relief items to PODs in layers 1, 2 and 3, Eq. (A.8) and their relevant quantity of demands Eq. (A.7). Our model considers that multiple commodities have to be sent to PODs while the minimum amount of demand coverage has to be decided by the DM(s).
Minimise total uncovered demand ¼ Total demands Total shipped items
We included those parameters in the model that related information could be easily reached in disasters response. In fact, disasters are not any more totally data lacking contexts: HOs normally have access to maps, distances and logistics prices through information sharing plat-forms such as Relief Web,2 Logistics Cluster,3 and Humanitarian Data
Exchange4 in rather early days of disasters response. Our interviewees also informed us that in situations where data is not available or it is incomplete, practitioners use estimates.
4. Approach to examine the impact of trade-offs
Fig. 4 shows the proposed approach. The set of Pareto optimal so-lutions, sð1Þ … sðnÞ, refers to all alternatives that, from the mathematical point of view, are equally acceptable as a non-dominated solution. The overall performance value, vðsðnÞÞ, will be calculated for every Pareto optimal solution to enable further analysis of alternatives. This value is assumed to be calculated by an (additive) aggregation formula [78], as shown in Equation (1). vðsðnÞ Þ ¼X n i¼1 wi�ð1 NfiðsðnÞ Þ Þ wi�0; Xn i¼1 wi¼1 (1) In this equation, NfiðsðnÞÞ and wi refer to the normalised value of objective functions and their weights, respectively. Note that the nor-malised values should be deducted from 1 to compensate for the mini-misation direction of objective functions [82] (not needed for maximisation). The normalisation of objectives is necessary due to their different magnitudes and scales. While there are several normalisation
schemes, we suggest using Equation (2), as it is widely referred to as an effective, practical approach [85].
NfiðsðnÞÞ ¼ fiðsðnÞÞ zUi zN i zUi (2) In Equation (2), zU
i and zNi refer to Utopia and Nadir values of the objective function. While details and formulas regarding how to calcu-late these values are provided in detail by Grodzevich & Romanko [85]; they are often calculated according to the best and worst possible result of an objective per alternatives.
The final step, cf. Fig. 4, refers to comparing alternatives through the sensitivity of scores. Multidimensional sensitivity analysis means simultaneous variations of weight parameters which helps to investigate the stability of the alternatives and supports consensus building in group decision-making process. It refers to inserting different combination of weights into Equation (1) and see which combinations have a significant impact on the overall score of alternatives. Such insights should help DMs to have an effective overview regarding where they need more discussions in a set of non-dominated alternatives. To this end, using intervals instead of exact weights, IðwiÞ, enables the opportunity for simultaneous variation of all weights while their summation equals to 1. According to Bertsch & Fichtner [82]; in the case of group decision-making, intervals can be computed by first, eliciting individual Fig. 3. Schematic presentation of key locations in a relief distribution network [16].
Fig. 4. Approach to check the stability of alternatives and investigate the
impact of trade-offs.
2 https://reliefweb.int/. 3 https://logcluster.org/. 4 https://data.humdata.org/.
weights from practitioners and second, defining the supersets of elicited weights regarding each criterion as the intervals, or ½0 1�. After con-structing the weight intervals, Monte Carlo Simulation with uniform distributions is suggested to draw samples within the intervals. When the samples are ready, the rest of the calculation is straightforward for each alternative following Equation (1).
Using the proposed approach supports group decision-making in two aspects. First, as our approach considers uncertainty in modelling pref-erences (using intervals instead of exact values), it can contribute to bypassing the lengthy discussion among stakeholders regarding the relative importance of each objective. Second, it transparently shows the performance of alternatives and reflects information regarding the trade-offs that actually matter. This information can set a starting point in DMs’ discussions regarding where they need to argue about in the set of alternatives. Therefore, it can help a group of DMs to converge to one alternative quicker and easier while it ensures the quality of the deci-sion. In the next section, we demonstrate the application of our method through the Nepal case study.
5. Case study
To test and validate the proposed approach, we apply it to the 2015 Nepal earthquake data from the UN WFP. The UN WFP is the leading agency of the Logistics Cluster and as such often coordinates the logistics activities in the humanitarian response. The stakeholders for UN WFP’s decision can be representatives from other HOs who normally partici-pate in the Logistics Cluster decision-making meetings and may have different aims, mandates and priorities [18]. Reports published after multiple recent disasters since the Haiti Earthquake in 2010 confirm that majority of responders coordinate under the UN Cluster System. These organisations include UN agencies, IFRC societies, local or international NGOs, and volunteers. For instance, in the 2015 Nepal earthquake response, “as of 20 June [2015], over 250 participants from around 110
organisations attended coordination meetings in Kathmandu, Deurali and Chautara” [86].
5.1. Overview of Nepal case
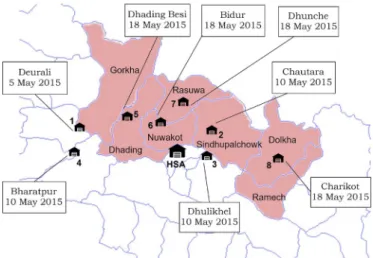
Due to the high magnitude of the 2015 Nepal earthquakes, approx-imately 9000 people lost their lives, nearly 22,500 people were injured, and more than half a million houses collapsed or were damaged [87]. To distribute food items among severely affected people (see Fig. 5), who lost their household food stocks or did not have access to markets, UN WFP proposed Emergency Operation Plan 200,668 that had two phases: the immediate and the structured relief [88]. In the structured relief phase, UN WFP aimed at delivering 20-day food rations to approxi-mately 1.1 million people in two months starting from June 2015 [88].
The Humanitarian Staging Area (HSA), which was located at Kath-mandu International Airport, served as the main entry point for relief items. In addition, UN WFP established eight SAs across the country before the structured relief phase. The sequence and approximate opening times of each location are depicted in Fig. 5. According to Ref. [89]; they used mainly two SAs (Deurali and Chautara) for their distribution. The remaining SAs were used either for strategic purposes (for instance Dhulikhel and Bharatpur to decrease the pressure on the HSA in Kathmandu) or to support partner HOs through the Logistics Cluster (Dhading Besi, Bidur, Dhunche, and Charikot) [88]. More details regarding the input data for the Nepal case is provided in Appendix B.
5.2. Model results
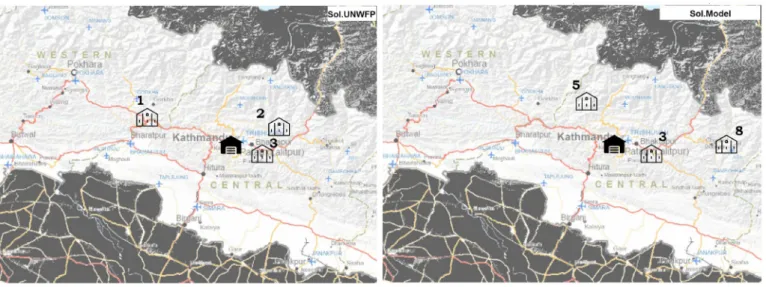
Fig. 7 compares the performance of models’ results with the UN WFP’s network for the Nepal relief phase. We fix the UN WFP’s SAs in the model constraints and solve the model by using Mavrotas & Florios [90]’s algorithm, which is called augmented epsilon constraint method version 2 (known as AUGMECON2). The algorithm has been
demonstrated to be very efficient for providing the set of Pareto optimal solutions in multi-objective mixed-integer problems compared to the alternative methods in the literature. Then, we order alternatives based on the demand coverage, response time and logistics costs. The empty cells in Fig. 6 mean that the solution algorithm could not find any non-dominated alternative for the specific response time. For the Nepal case, the algorithm could solve the model in 115 min using a personal laptop with Intel Core i5-4300U processor at 1.90 GHz and 8 GB of RAM operating under Windows 10. We note that the solution time may vary with changes to the input data for the model parameters (e.g., number of locations, estimated demand, etc.).
As Fig. 6 shows, UN WFP’s network suggests approximately %4 more logistics costs compared to the Pareto solution for the same number of delivery days (60 days). By extending the operation’s timeline (see for instance the column for 66 days), we found that this divergence de-creases gradually. For further analysis, the model’s suggested network for delivering items in 60 days (Sol.Model) is compared with UN WFP’s network (Sol.WFP) in Fig. 7. Both networks have one location in com-mon, Dhulikhel. These networks show that targeted demands could be addressed by three SAs located in the western, eastern, and central parts of the affected region in Nepal (in addition to HSA in Kathmandu). Indeed, the travelling distance and travelling time from locations 1 and 2 (SAs in Sol.WFP) to densely populated PODs impose more costs comparing to locations 5 (Dhading Besi) and 8 (Charikot) in Sol.Model. The road access from/to Dhading Besi and Charikot were constrained during the immediate response [91] and this affected the UN WFP’s decision when they first decided to locate their SAs. However, since UN WFP used MSUs as storage facilities in SAs, which were erected easily and quickly [92], the location decision could have been revised. This could be carried out by using other locations to enhance the efficiency of relief network (given that 8 locations were already opened when UN WFP started the relief phase). To compensate for a potential lack of transportation fleets in the new SA locations, the UN WFP could use partnerships logistics service providers.
A detailed sensitivity analysis of the model is given in Appendix D. Providing an explanation regarding the divergence between our model’s results and the choice of practitioners is not in the scope of our study. However, we think that the divergence could be discussed in three di-rections: (a) lack of application of a formal and transparent approach to model location problems in the field, (b) a different approach to model the problem, and (c) not adequately representing the decision situation or logisticians’ real circumstances due to missing objectives or con-straints. More investigation on the divergence can be a future research direction.
Fig. 5. An overview of affected districts and the location of UN WFP
5.3. Results of the proposed approach
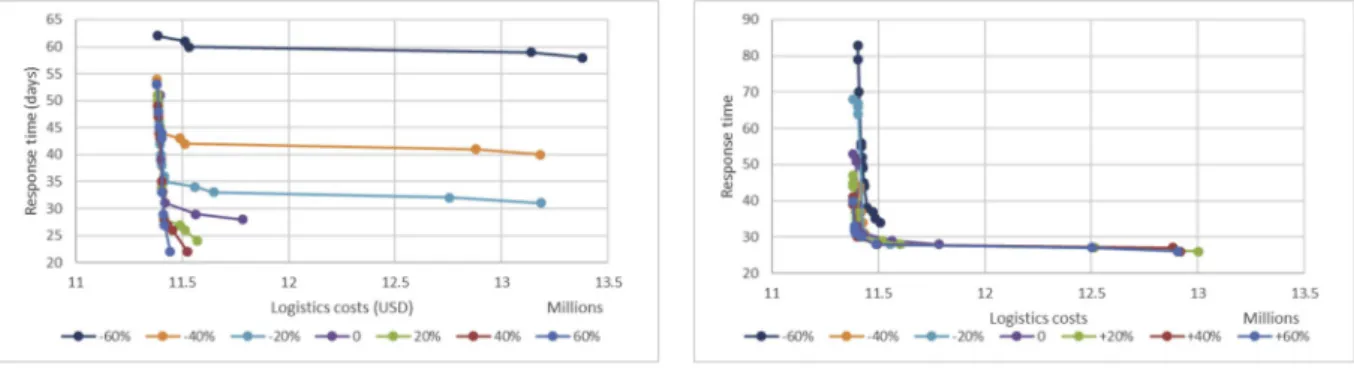
Fig. 6 depicts the very common challenge that DMs often face in group decision-making; trade-offs between demand coverage, response time, and logistics costs. As this figure shows, for instance, within a 60- day timeline, a range of %86 to %100 of targeted demands in our case could be addressed. However, the latter could have %15 more logistics costs than the former. Interestingly, according to the model, covering % 100 of targeted demands in less than 60 days (targeted timeline for UN WFP operations) was unfeasible given the fleet and capacity constraints in Nepal case. Also, by extending the coverage values to higher than % 100, the divergence between the Pareto optimal solutions and values for UN WFP solution increased considerably. However, if covering %86 of demands was targeted, the operation could be carried out in a range of 54–57 days with different logistics costs. In all scenarios of targeted demands in our case, logistics costs would decrease if the operations timeline was prolonged.
We begin by analysing the impacts of trade-offs with those solutions that can correspond to %85 demand coverage (we have justified this choice before). This means given the solutions presented in Fig. 6, we have 22 non-dominated alternatives (among the total 27 alternatives that the solution algorithm could provide). From now on, we refer to a solution in Fig. 6 by Sol.[coverage percentage]-[response time]; for instance Sol.86-60 means the solution that corresponds to %86 demand coverage within 60 days.
To elicit the preferences of our participants regarding the weights, we sent an online questionnaire to 30 experts. These experts were mainly those who participated in our Nepal interviews, in addition to some logisticians with similar backgrounds. We asked the participants to
carry out pairwise comparisons for the proposed criteria (i.e. demand coverage, response time, and logistics costs) to extract judgement matrices with a nine-point scale as suggested by Saaty [93]. We did not make any specific reference to a concrete disaster case in the question-naire. The questionnaire presented to experts is given in Appendix C. In total, 17 practitioners responded. We removed two preference state-ments, as they were identified inconsistent, and then we constructed the weight intervals. The intervals are the supersets of consistent weights. Although the elicited weights had variations and peaks in the lower and the upper parts of the respective intervals, they were evenly distributed. The weights’ intervals are shown in Table 3.
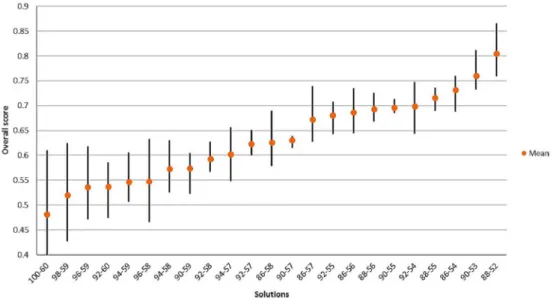
To perform the multidimensional sensitivity analysis (cf. Section 4), we first normalised the values of objective functions for each solution. Then, we used MATLAB software to draw random weight vectors. The spread of results for multiplying 1000 samples of random weight vectors to normalised objective function values of every solution is shown in Fig. 8. As this figure shows, the solution with the highest score suggests covering %88 of demands in 52 days. On the other hand, solutions with longer response times (for instance 100-60, 98-59, 96-59, 92-60, 94-59) got lower overall scores. This trend can be explained by the assigned weight interval to each criterion, although it is not the only reason.
To better explain another reason, we prepared Fig. 9 which shows the normalised values for the top-5 and the worst-5 solutions based on the overall scores. The three top-scored solutions had relatively better values for response time and logistics costs (more than 0.7) compared to demand coverage (less than 0.6). However, this is vice versa for the least-scored solutions which highlights the impact of trade-offs between response time and logistics costs when certain demand coverage level (more than %86) is considered.
Fig. 6. Pareto front solutions for the relief phase vs. UN WFP’s network (green ¼ more preferred).
We also considered uncertain weights to show the performance of the proposed approach when access to DMs’ is constrained. We exam-ined the sensitivity of alternatives’ scores by substituting all weight in-tervals with ½o 1� and running the same Monte Carlo Simulation analysis. Despite the changes in intervals, as Fig. 10 shows, Sol.88-52 maintained the top-scored solution. Our investigation shows that major changes in the overall scores are due to the differences between the values of the response time objective. In the set of Pareto alterna-tives, Sol.90-53 suggests the same network as Sol.88-52. Although the Sol.90-53 requires only þ1 day and it covers %2 more demands, it got a lower overall score compared to the Sol.88-52. This result could mean that the response time objective has more impact than the demand coverage counterpart.
Fig. 10 also shows that although Sol.88-52 is quite robust, other solutions are sensitive to weights. For instance, comparing the perfor-mance of Sol.90-53 and Sol.86-54 across the 1000 samples shows that these two alternatives took the second top-scored solution inter-changeably, as divergences are highlighted by green circles. The changes in the ranks of Sol.90-53 and Sol.86-54 are due to the differ-ences between the values of logistics costs and response time in these two solutions. Sol.90-53 offers one day quicker response time while Sol.86-54 suggests %3.3 fewer logistics costs. Hence, throughout the analysis, when the corresponding weight for the logistics costs was greater than the weight for the response time, the solution with fewer costs got a better overall score. This observation was true when the weight of minimising unsatisfied demand was � 0:4. We also observed this trend when we examined other solutions. This suggests a consid-erable trade-off between logistics costs and response time in a certain level of demand coverage.
5.4. Validating the proposed approach
During the Humanitarian Innovation Day 2018, which was held on May 23, 2018 in Oslo, eight DMs from different HOs (IFRC, Norwegian Red Cross, Norwegian Refugee Council, Norwegian Church Aid, Save the
Children, Oxfam, UN HRC, and UNICEF) were asked to participate in a group-decision making exercise for the purpose of our study. All par-ticipants had logistics backgrounds and were deployed to humanitarian response operations at least two times. They were divided into two groups randomly (each group included four DMs), namely Group A and B, and one author of this paper acted as a facilitator for both groups.
In a briefing session, the same Nepal case as described in this study was presented to both groups, and participants’ questions were answered to ensure a clear understanding of the decision situation. Both groups had to imagine their organisation as a part of the Logistics Cluster and they had to converge to a plan regarding where to locate SAs in Nepal while considering response time, demand coverage, and logistics costs. Based on observations from the Nepal field study, further efforts were made to simulate the decision-making situation, like access to fa-cilities (e.g., laptops, boards, and maps), available information (data-set of this study) and time-pressure (only 1 h to make the final decision) to be similar to field situation as far as possible.
Both groups had access to the set of non-dominated alternatives and Fig. 6. However, only Group B had access to the tipping points as well as Fig. 8–10 (the specific outcomes of the proposed approach in our study). Both groups started to make a decision at the same time and the facili-tator measured decision-making time in the background.
Although this exercise had few similarities to the real situation (in terms of stress, time pressure, workload, number and combination of DMs), interesting insights were obtained. Decision-making time for Group B was %73 less than Group A. Also, Group A selected Sol.92-55 which received a middle-range overall score in Fig. 8, compared to the selection of Group B, Sol.90-53, which is the second top scored alter-native. Surprisingly, no group selected Sol.88-52, which could have several reasons. The reason could be the concern of our participants to cover as many demands as possible while selecting one of the top-scored plans. Further investigation regarding other potential reasons is addressed as a future research direction.
6. Discussion
In this section, first, we discuss our findings from four aspects: originality, commensurability of criteria, number of objectives and scalability. Then, we elaborate on the impact of trade-offs, insights from the validation experiment, the missing criteria, and implications for practice.
Originality By considering weight intervals, we assumed that the
relative importance of considered criteria in the model (response time, Table 3
Weight intervals elicited from practitioners.
Criterion IðwiÞ
Effectiveness (demand coverage) ½0:25 0:50�
Cost efficiency (logistics costs) ½0:15 0:40�
Time efficiency (response time) ½0:30 0:60�
demand coverage, and logistics costs) may change over the timeframe of response. To the best of our knowledge, this assumption has not been yet considered in similar studies in the HL literature. We examined the potential impact of shifting in preferences on the relief distribution network by considering random weights. Our analysis shows that if we address more than %86 demand coverage, the main issue would be to manage trade-offs between logistics costs and response time.
Commensurability of criteria Considering trade-offs between
criteria assumes commensurability which allows to compare criteria and compensate one with the other. We addressed this challenge by not allowing exchanges between conflicting criteria, e.g. logistics costs and demand coverage, unless minimum achievements or standards are accomplished. For instance, we focused only on those solutions that could address certain demand coverage (� %86), as noted relevant by our interviewees.
Number of objectives We think that our proposed approach can be
used for several multi-objective decision problems in the humanitarian
response. However, we have to note that the number of objectives may hinder the effectiveness of our proposed approach and outcomes. Our study considers a location model with three conflicting objectives. Ac-cording to our experiments, for mathematical models with ‘number of objective functions � 2’, we suggest replacing Equation (1) by weighted Chebyshev approach [94]. We have not tested the weighted Chebyshev approach; however, it has proven to work effectively with two objectives [79]. More investigation for using the weighted Chebyshev approach (or any other approach that would work effectively for situations with bi-objective models) is addressed as a future research direction.
Scalability Although group decision-making in humanitarian
con-texts has been criticised in the literature for being time-consuming and hard-to-converge [28,95], we showed that incorporating Monte Carlo Simulations can bring helpful managerial insights for improving the speed and transparency of decision-making. As Monte Carlo Simulations are notorious for being resources intense, we argue for solving the multi-objective model and carrying out Monte Carlo Simulations in back Fig. 9. Objective functions’ values for the (a) top-5 solutions and (b) the least scored solutions, in the relief phase.
offices (like headquarter offices outside of the affected region) and then, presenting the identified tipping points, to the DMs.
While this approach shifts computation to a back office, it leaves the decision-making authority and agency with the operational responders. As such, it is different from remote management which has been criti-cised by several scholars (e.g., Donini & Maxwell [96]; Duffield [97]; and Comes et al. [98]). Here, we support field-based DMs in managing the complexity of their choices by providing the tipping points that are specifically important as they indicate areas, where a small change in preferences will lead to different set of locations.
Trade-offs Monte Carlo analysis showed that trade-offs between
response time and logistics costs can have a significant impact on location decision. This has been noted in Baharmand et al. [16] for the immediate response phase. For our problem, results showed that when the relative importance for minimising unsatisfied demands is consid-ered � 0:4, this is the tipping point at which DMs confront the trade-offs between logistics costs and response time. Our study revealed that combining this information with the overall value score analysis could facilitate group decision-making to a high extent.
Validation experiment The DMs who participated in our
experi-ment selected a network from the best-scored alternatives quicker. This means combining a formal decision support system with transparent steps for selecting one .alternative not only facilitates converging to a decision but also improves the quality of decisions specifically in con-strained and uncertain contexts. Our experiment also highlights the importance of validation of proposals in real settings, which is currently lacking in the literature [33].
Missing criteria and/or constraints - The mathematical model that
we adapted in our study aims at locating RDCs based on logistics costs, response time, and demand coverage. Although we validated these ob-jectives for the Nepal case with our interviewees, we note that there might be some other criteria or constraints for different contexts. For instance, our model did not account for staff security [99] or fairness [100] although both aspects would probably affect the logistics decision in disasters response (such as locating RDCs or routing convoys). We argue that some concerns (such as staff security) highly depend on the context (conflicts vs. natural disasters) [69] and can differ from case to case [7]. Our observations in the aftermath of the 2013 Typhoon Haiyan and 2015 Nepal earthquake show that staff security was not practi-tioners’ concern while some studies note staff security as a critical issue after the 2010 Haiti earthquake [101,102]. For fairness, Baharmand et al. [16] contend that practitioners’ approach to consider it in opera-tions was not found clear in the observaopera-tions (e.g., priority of regions vs.
targeted groups vs. timeliness of the deliveries). Although some con-cerns cannot be modelled, DMs need to be aware of the consequences to make properly informed decisions. As such, a future research direction can be to develop a framework for selecting appropriate objectives and constraints for HL decisions in distinct contexts (conflicts vs. natural disasters) or cases (Asia vs. Africa).
Implications for practice The proposed approach supports
identi-fying tipping points (i.e., the main discussion points between multiple decision-makers with neutral backgrounds) for HL problems that often inevitably have multiple conflicting criteria [65]. Although we applied the approach to a location problem, we think that HOs could adapt our work to a wide range of problems in HL. However, the naturalistic decision-making approach is more common than analytic approaches in HL [4]. Therefore, one important aspect would be to consider and to realise the training and education that would be required to shift from naturalistic to analytic approaches for a more effective and efficient response. As such, Lu et al. [103] have proposed a framework that can facilitate the learning process in HOs.
7. Conclusions
This study has combined multi-objective optimisation with a poste-riori preference articulation approach to support decision-makers (DMs) in a sudden-onset disaster response. Our research has targeted locating temporary relief distribution centres (RDCs), which has been referred to as one of the first critical decisions for an effective and efficient response [9]. A location-allocation model has been adapted to minimise uncov-ered demand, response time, and logistics costs, and this research offers an approach based on Monte Carlo Simulation to facilitate group decision-making by investigating the stability of the non-dominated alternatives. Our approach supports finding the tipping points which can assist DMs to focus group discussions and converge to a consensus quicker. The proposed methodology has been applied to a real dataset from UN WFP’s operations after the 2015 Nepal earthquake and then validated by representatives from humanitarian organisations (HOs) through a small experiment.
Our analysis for the Nepal case revealed that when the relative importance of demand coverage was � 0:4, DMs confronted a consid-erable trade-off between logistics costs and response time. The experi-ment showed that providing information about tipping points and the overall performance of networks can decrease decision-making time up to %70. The methodology has therefore proven its ability to generate effective and efficient location plans for sudden-onset disasters response Fig. 10. Scores averages for all drawn parameter combinations for the top-3 solutions vs. Sol.100-60.
given the presence of multiple DMs, time pressure, and constrained resources.
The contributions of our study are threefold. First, we illustrate the impact of trade-offs in disasters response that we elaborate from the case study. This adds to the existing body of research by formalising and increasing understanding on this issue and complements the broader research stream dealing with the multi-criteria problems in HL (e.g. Gralla et al. [66]. Second, we develop an effective methodology to address uncertainties and ambiguities regarding DMs’ preferences while multiple conflicting objectives have been considered for locating RDCs. We provide further insights into the potential impact of different pref-erences on the number and location of RDCs. Third, this study is in line with recent works challenging the importance of group decisions in di-sasters response (e.g. Maharjan & Hanaoka [9] and Ghavami et al. [17] and calling for deeper investigation of supporting approaches that can be implemented in the field [16,33]. We contribute to this research stream, trying to shed light on the potentials of Monte Carlo simulations, by discussing which trade-offs have greater impact on a given location-allocation decision to facilitate group decisions in the presence of multiple stakeholders and several alternatives. Such information can be used for investigating other approaches that can support decision-making in the field.
However, it is important to note that locating RDCs can be affected by other criteria. Investigating reasons that caused a difference between participants’ decision and the top scored alternative of our approach requires a dedicated study which can be our first future research di-rection. Furthermore, we tested the performance of our approach on a limited set of criteria which can be another limitation of our study. We address other investigations with different criteria as the second future research direction. Moreover, our findings regarding the impacts of trade-offs are based on the Nepal case and they should not be general-ised. Further case studies are required to support the findings of our study regarding the impact of trade-offs between response time and logistics costs compared to demand coverage in the location decision.
Acknowledgements
We would like to thank reviewers for their constructive comments. We express our sincere gratitude to the experts working at UN WFP and IFRC for sharing their insights. We are grateful to the participants of Humanitarian Innovation Day 2018 who took part in our experiment. We also thank our team members in the Nepal field research and all practitioners who participated in our interviews there.
Appendix A. Model formulations
Indices
B Set of main entry points ðb 2 B ¼ f1; 2;…;BgÞ
I Set of potential locations for staging areas ði 2 I ¼ 1; 2;…;IgÞ P Set of demand points in POD layer 1 ðp 2 P ¼ f1; 2;…;PgÞ J Set of demand points in POD layer 2 ðj 2 J ¼ f1; 2;…;JgÞ H Set of demand points in POD layer 3 ðh 2 H ¼ f1; 2;…;HgÞ T Set of time steps ðt 2 T ¼ f1; 2;…;TgÞ
C Set of relief commodity types ðc 2 C ¼ f1; 2;…;CgÞ
G Set of ground transportation types available at field ðg 2 G ¼ f1; 2;…;GgÞ A Set of air transportation types available at field ða 2 A ¼ f1; 2;…;AgÞ
Model parameters
db;i Distance from the bth MEP to ith SA in km
db;p Distance from the bth MEP to pth POD layer 1 in km
di;p Distance from the ith SA to pth POD layer 1 in km
di;j Distance from the ith SA to jth POD layer 2 in km
tb;i Transit time from the bth MEP to ith SA in minutes
tb;p Transit time from the bth MEP to pth POD layer 1 in minutes
ti;p Transit time from the ith SA to pth POD layer 1 in minutes
ti;j Transit time from the ith SA to jth POD layer 2 in minutes
αa Estimates air transportation costs in USD=tour αg Estimated ground transportation costs in USD=km
υ Estimated human resources (HR) costs during the operations in USD per one SA
ϕ Estimated recurring costs including the costs for rental, equipment, utilities, and supplies in USD per one MSU during the operations mc
h Demand of commodity c in the hth POD layer 3 in kg
mc
j Demand of commodity c in the jth POD layer 2 in kg
mc
p Demand of commodity c in the pth POD layer 1 in kg
βt Maximum possible number of MSUs that can be erected simultaneously in tth time step
γ Estimated required time for setting up an MSU in timesteps ζ Volume capacity of every MSU in m3
πi Maximum number of MSUs that can be erected in the ith SA in units σ Total number of available MSUs in units
capa Weight capacity of an air transportation of type a in mTons
capg Weight capacity of a ground transportation of type g in mTons
τai Number of helicopters of type a available in the ith SA in units τgb Number of trucks of type g available in the bth MEP in units
τgi Number of trucks of type g available in the ith SA in units δ Maximum allowed driving time in minutes
ω Maximum allowed distance for every helicopter tour in km
kc Weight of the cth commodity in kg=m3
U A very big number
M Minimum demand coverage level Decision variables
Binary variables
LOCi 1, if the ith candidate SA is opened; 0, otherwise
Xb;p 1 if there is ground shipment between the bth MEP and pth POD (layer 1); 0 otherwise
Xb;i 1 if there is ground shipment between the bth MEP and ith SA; 0 otherwise
Yi;p 1 if there is ground shipment between the ith SA and pth POD (layer 1); 0 otherwise
Yi;j 1 if there is ground shipment between the ith SA and jth POD (layer 2); 0 otherwise
Zi;j 1 if there is air shipment between the ith SA and jth POD (layer 2); 0 otherwise
Zi;h 1 if there is air shipment between the ith SA and hth POD (layer 3); 0 otherwise
Lt 1 if there is an operation in the tth time step; 0 otherwise
Et 1 if at least one MSU is erected in the tth time step; 0 otherwise
Continuous variables Fc
t;b;p Amount of cth item to be shipped from the bth MEP to pth POD (layer 1) by ground transportation in m3
Mc
t;b;i Amount of cth item to be shipped from the bth MEP to ith SA by ground transportation in m3
Oc
t;i;p Amount of cth item to be shipped from the ith SA to pth POD (layer 1) by ground transportation in m3
Oc
t;i;j Amount of cth item to be shipped from the ith SA to jth POD (layer 2) by ground transportation in m3
Rc
t;i;j Amount of cth item to be shipped from the ith SA to jth POD (layer 2) by air transportation in m3
Rc
t;i;h Amount of cth item to be shipped from the ith SA to hth POD (layer 3) by air transportation in m3
Wt;i Available inventory at SA at the end of t in m3
Integer variables
Nt;i Number of MSUs in the ith SA at tth time step in integers
Sgt;b;i Number of ground shipment of type g from the bth MEP to the ith SA
Sg
t;b;p Number of ground shipment of type g from the bth MEP to the pth POD (layer 1)
Sg
t;i;p Number of ground shipment of type g from the ith SA to the pth POD (layer 1)
Sg
t;i;j Number of ground shipment of type g from the ith SA to the jth POD (layer 2)
Qa
t;i;j Number of air shipment tours of type a from the ith SA to the jth POD (layer 2)
Qa
t;i;h Number of air shipment tours of type a from the ith SA to the hth POD (layer 3)
Objective functions
Minimize total logistics costs ¼ Ground transportation cost
þAir transportation cost
þrecurring cost
þHuman resource cost
where
Ground transportation costs ¼X
G g¼1 αg� XT t¼1 XB b¼1 XI i¼1 Sgt;b;idb;iþ XT t¼1 XB b¼1 XP p¼1 Sgt;b;pdb;pþ XT t¼1 XI i¼1 XP p¼1 Sgt;i;pdi;pþ XT t¼1 XI i¼1 XJ j¼1 Sgt;i;jdi;j � (A.1)
Air transportation costs ¼X A a¼1 αa� X T t¼1 XI i¼1 XJ j¼1 Qa t;i;jþ XT t¼1 XI i¼1 XH h¼1 Qa t;i;h � (A.2) Recurring cost ¼ ϕX T t¼1 XI i¼1 Nt;i (A.3)
Human resource costs ¼υX I
i¼1
LOCi (A.4)
Minimize total response time ¼ MSU setup time þ Operation time
where
MSU setup time ¼ γX
T t¼1 Et (A.5) Operation time ¼X T t¼1 Lt (A.6)
Minimise total uncovered demand ¼ Total demands Total shipped items
where Total demands ¼X C c¼1 � XP p¼1 mc pþ XJ j¼1 mc jþ XH h¼1 mc h � (A.7)
Total shipped items ¼ kc� XT t¼1 XI i¼1 XP p¼1 Oc t;i;pþ XT t¼1 XB b¼1 XP p¼1 Fc t;b;pþ XT t¼1 XI i¼1 XJ j¼1 Oc t;i;j þX T t¼1 XI i¼1 XJ j¼1 Rc t;i;jþ XT t¼1 XI i¼1 XH h¼1 Rc t;i;h � (A.8) Subject to constraints Fc t;b;p�UXb;p 8t 2 T; c 2 C; b 2 B; p 2 P (A.9) Mc
t;b;i�UXb;i 8t 2 T; c 2 C; b 2 B; i 2 I (A.10)
Xb;i�LOCi 8b 2 B; i 2 I (A.11)
Constraints (A.9) and (A.10) ensure that relief items can be transferred from MEPs to PODs (first layer) and SAs only if MEP is connected to these locations respectively. Similarly, Constraint (A.11) makes sure that the MEP can be connected to a SA only if the SA is located there.
XC c¼1 XP p¼1 Oc t;i;pþ XC c¼1 XJ j¼1 Oc t;i;jþ XC c¼1 XJ j¼1 Rc t;i;jþ XC c¼1 XH h¼1 Rc
t;i;h�Wt;i 8t 2 T; i 2 I (A.12)
Constraint (A.12) shows that the amount of relief items transferred from established SAs is less than or equal to the maximum inventory available at given SA during that time step.
Oc
t;i;p�UYi;p 8t 2 T; c 2 C; i 2 I; p 2 P (A.13)
Oc
t;i;j�UYi;j 8t 2 T; c 2 C; i 2 I; j 2 J (A.14)
Rc
t;i;j�UZi;j 8t 2 T; c 2 C; i 2 I; j 2 J (A.15)
Rc
t;i;h�UZi;h 8t 2 T; c 2 C; i 2 I; h 2 H (A.16)
Constraints (A.13)–(A.15) and (A.16) imply that relief items can be shipped from SAs to PODs only if they are connected.
Yi;p�LOCi 8i 2 I; p 2 P (A.17)

![Fig. 1. Classification of common MCDA methods in HL literature [77] and preference parameters in MODA](https://thumb-eu.123doks.com/thumbv2/123doknet/11641404.307218/6.892.163.735.83.333/classification-common-mcda-methods-literature-preference-parameters-moda.webp)