HAL Id: hal-03011586
https://hal.archives-ouvertes.fr/hal-03011586
Submitted on 26 Feb 2021HAL is a multi-disciplinary open access
archive for the deposit and dissemination of sci-entific research documents, whether they are pub-lished or not. The documents may come from
L’archive ouverte pluridisciplinaire HAL, est destinée au dépôt et à la diffusion de documents scientifiques de niveau recherche, publiés ou non, émanant des établissements d’enseignement et de
Stéphane Hoang, Simon Olivier, Stéphane Cuenot, Agnès Montillet, Jérôme
Bellettre, Eléna Ishow
To cite this version:
Stéphane Hoang, Simon Olivier, Stéphane Cuenot, Agnès Montillet, Jérôme Bellettre, et al.. Mi-crofluidic Assisted Flash Precipitation of Photocrosslinkable Fluorescent Organic Nanoparticles for Fine Size Tuning and Enhanced Photoinduced Processes. ChemPhysChem, Wiley-VCH Verlag, 2020, �10.1002/cphc.202000633�. �hal-03011586�
Microfluidic Assisted Flash Precipitation of Photocrosslinkable
Fluorescent Organic Nanoparticles for Fine Size Tuning and
Enhanced Photoinduced Processes
Stéphane Hoang,[a] Simon Olivier,[a],[b] Stéphane Cuenot,[c] Agnès Montillet,[d] Jérôme Bellettre,[e] and Eléna Ishow*[a]
[a] S. Hoang, Dr. S. Olivier, Pr. E. Ishow
CEISAM–UMR CNRS 6230, Université de Nantes, 2 rue de la Houssinière, 44322 Nantes, France E-mail: elena.ishow@univ-nantes.fr
[b] New affiliation: Dr. S. Olivier, Air Liquide, Air Liquide Facility, 28 Wadai, Tsukuba, Ibaraki 300-4247, Japan [c] Dr. S. Cuenot
Université de Nantes, CNRS, Institut des Matériaux Jean Rouxel, IMN, F-44000 Nantes, France [d] Pr. A. Montillet
GEPEA UMR CNRS 6144, IUT Saint Nazaire, Université de Nantes, 58 rue Michel Ange, 44600 Saint Nazaire, France
[e] Pr. J. Bellettre
LTeN UMR CNRS 6607, Polytech Nantes, Université de Nantes, rue Christian Pauc, 44306 Nantes, France
ABSTRACT. Highly concentrated dispersions of fluorescent organic nanoparticles (FONs),
broadly used for optical tracking, bioimaging and drug delivery monitoring, are obtained using a newly designed micromixer chamber involving high impacting flows. Fine size tuning and narrow size distributions are easily obtained by varying independently the flow rates of the injected fluids and the concentration of the dye stock solution. The flash nanoprecipitation process employed herein is successfully applied to the fabrication of bicomposite FONs designed to allow energy transfer. Considerable enhancement of the emission signal of the energy acceptors is promoted and its origin revisited as a result of polarity rather than steric effects. Finally, we exploit the high spatial confinement encountered in FONs and their ability to
Accepted
encapsulate hydrophobic photosensitizers to induce photocrosslinking. Increase in the photocrosslinked FON stiffness is evidenced d by measuring the elastic modulus at the nanoscale using atomic force microscopy. Such results pave the way toward the straightforward fabrication of multifunctional and mechanically photoswitchable FONs, opening novel potentialities in terms of sensing, multimodal imaging, and theranostics.
1. INTRODUCTION
For the past two decades, the technical development of scientific instruments has been accompanied by an increasing demand of miniaturization to gain spatial and time resolution and access to novel phenomena related to size reduction down to the nanometer scale. Assessing flow velocimetry in microfluidics,[1] sensing local temperatures[2], pH[3] or chemicals[4], and tracking cell[5] or nanomedicine[6] require nanometer-sized materials to follow local evolutions as a function of external parameters. In this context, emissive nanoparticles have been considered as attractive tools since they can easily been monitored by widespread wide-field or confocal fluorescence microscopes, offering high detection sensitivity and versatile implementation of the investigated devices or (bio)chemical systems.[7] The search for bright but biodegradable and heavy-metal free nanoparticles is thus becoming a pressing demand, requiring progressive replacement of the broadly used luminescent silica nanoparticles and quantum dots, facing the abovementioned limitations. For these reasons, engineering bright fluorescent organic nanoparticles with large colloidal stability, low polydispersity index and additional functionality, stimulates a large area of investigations. Fluorescent nanolatexes, namely submicrometer-sized crosslinked polymer particles incorporating fluorophores, represent the most regarded family of
Accepted
organic nanoparticles. Usually, they are synthesized by resorting to emulsion or dispersion-based fabrication processes.[8] Their transformation into fluorescent nanolabels can be achieved by entrapping fluorophores before polymerization,[9] or by inducing self-assembling of preformed amphiphilic block copolymers in the presence of hydrophilic or hydrophobic fluorophores.[10] Another approach relies on polymer networks incorporating fluorophores as covalent side chains, which requires complementary reactive functions.[11] However, the first approach faces extensive dye release in the aqueous media in the long term, especially for ionic and hydrosoluble fluorophores, thereby leading to false-positive. As for the second approach, the risk of self-quenching upon aggregation for hydrophobic dyes or the natural electrostatic repulsions between dyes of similar charges requires diluted dyes concentrations, leading to low-payload nanolabels. In this case, prolonged irradiation tends to conduct to the rapid loss of emission signal due to the weak density of dyes, amenable to photobleaching in the presence of singlet oxygen. To circumvent this issue of a low functionalization rate, an alternative approach has been proposed, based on the formation of non-doped fluorescent nanoparticles, resulting from the self-assembly of a high amount of small hydrophobic and fluorescent molecules, promoted by water addition. Two main structural strategies have been developed to still obtain emission after dye aggregation into nanoparticles. The first one led to the coined aggregation-induced-emissive (AIE) nanomaterials where emission arises from blocked intramolecular rotations of the dyes within the nanoparticles upon stacking,[12] or from the formation of H- and J-aggregates.[13] The second one involves bulky or twisted fluorophores that emit in solution and keep emitting as nanoparticles thanks to the large intermolecular distance introduced by sterically hindered substituents, prohibiting the formation of dark states.[14] Whatever the adopted synthetic method, the resulting fluorescent organic nanoparticles (FONs) are formed upon solvent shifting,
Accepted
namely essentially through manual injection into a large volume of water of a diluted solution of fluorophores dissolved in a water-miscible solvent. Such a fabrication process tightly depends on the operator and geometry of the precipitation container, which suffers from diluted solutions, small preparation volumes, and a lack of reproducibility and size control. To solve such issues, smart micromixers have been developed to ensure quick mixing and achieve high supersaturation and nucleation rate that are prerequisites for nanoparticle formation in the millisecond range following a nucleation-growth or nucleation-aggregation process.[15] Two mixer geometries have been proposed by B. K Johnson and R. K. Prud’homme et al., named confined impinging jet (CIJ) mixer[16] and multi-inlet vortex mixer (MIVM)[17] to produce high turbulence, favoured by a high flow velocity or large Reynolds numbers above 1000. CIJ mixers consist in two sub-millimeter channels, placed face-to-face across a large mixing chamber and connected to gas-tight syringes that contain each water or organic solution and are attached with each other to exert equal injecting pressure (Figure S1A). Although CIJ mixers are simple and hand-operated, the momenta of the organic solution and anti-solvent (here water) are necessarily identical, limiting their contribution to the control of the resulting nanoparticle diameters and the use of concentrated solutions at the risk of causing dye precipitation. MVIM systems overcome these restrictions thanks to a conical mixing chamber connected to two or four flow inlets, placed in a symmetrical and tangent manner around the chamber, which affords separate control of the stream velocity, continuous fluorescent nanoparticle production and easy variation of the solution concentration (Figure S1B-C).[18] Although both CIJ and MVIM technical solutions are elegant, the mixer dimensions are still too large to be implemented in the future on a microscope stage and allow for straightforward optical follow-up to gain understanding in the mixing dynamics. Moreover, they all imply the use of surfactants or amphiphilic polymers in large concentrations
Accepted
to stabilize the generated nanoparticles,[10b] which can impact the flow dynamics and provide dye-free micelles in the case of bad mixing. In this respect, a novel compact micromixer, designated as Microsphere500, has been developed in the past for the fabrication of surfactant-free oil-in water emulsions at high flow rates and under highly impacting flows.[19] Its original geometry, largely detailed in previous studies,[19] is based on two opposing channels with distinct sections, enabling high-impact impinging flows. The mutual position of the channels, in a slight offset with regard to the longitudinal stream direction, creates a vortex stream that superimposes the flow instabilities due to the high energy impact, hence very efficient mixing of biphasic mixtures is obtained.[20] We thus want to demonstrate that FONs with controllable diameter can easily be obtained out of small fluorophores by resorting to the simple Microsphere500 micromixer, combining the advantages of both CIJ and MVIM systems, namely high flow momenta, continuous nanoparticle production and technical simplicity. Issues regarding FON homogeneity and composition as a function of the experimental conditions of fabrication are addressed by steady-state and time-resolved photophysical studies. To validate the versatility of the current microfluidic device, we show that bicomposite FONs can be obtained by flash coprecipitation, allowing for tunable emission color thanks to the large structural confinement effects encountered in FONs and responsible for efficient photoinduced electronic energy or electron transfer.[21] Finally, we harness such confinement effects to show the possibility of chemical reaction within pre-formed FONs. To this aim, we perform photocrosslinking assays using FONs comprising bis-acrylate fluorescent monomers and tetrathiol crosslinker to offer in the future easily accessible
emissive nanotracers as an alternative to crosslinked polystyrene and silica nanoparticles.[22]
Accepted
2. EXPERIMENTAL SECTION
2.1. Chemicals and solution preparation
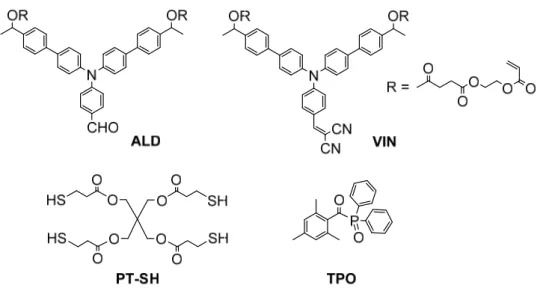
Both fluorophores employed in these studies, ALD (bis(2-(acryloyloxy)ethyl) O,O'-((((4-formylphenyl)azanediyl)bis([1,1'-biphenyl]-4',4-diyl))bis(ethane-1,1-diyl)) disuccinate) and
VIN (bis(2-(acryloyloxy)ethyl)
O,O'-((((4-(2,2-dicyanovinyl)phenyl)azanediyl)bis([1,1'-biphenyl]-4',4-diyl))bis(ethane-1,1-diyl)) disuccinate), were synthesized according to literature procedure.[23] Spectroscopic grade and inhibitor-free THF, used for all preparations and photophysical studies, and photocrosslinking respectively were purchased from Aldrich. Three
ALD solutions in THF with varying concentrations (0.5, 1 and 2 wt. %) were initially prepared
to cover all flash nanoprecipitation conditions. The bicomposite solutions comprising ALD and
VIN to generate FONs with tunable emission wavelength were prepared from two separate stock
solutions in THF, containing each ALD and VIN at a 0.5 wt. % concentration. The final solutions (2 mL) to be injected in the micromixer were prepared by adjusting the required volumes of the
ALD and VIN stock solutions and completing with 1 mL of THF, so that distinct ALD:VIN
ratios of 100:0, 95:5, 80:20 and 0:100 could be obtained with a total dye concentration fixed at 0.25 wt. %.
2.2. Flash nanoprecipitation
Manual method involving magnetic stirring. A solution of organic compounds (100 µL) was
added in one shot with a micropipette (Acura® manual 825) into a 18 mL-large amber glass vial, containing water (2.5 mL) while stirring with a vortex mixer (IKA VORTEX Genius 3) to afford FONs.
Accepted
Method involving the Microsphere500 micromixer. The nanoparticles were fabricated via a
microfluidic circuit including the Microsphere500[19] mixing chamber made from aluminum plates, pump syringes from Harvard Apparatus (Pump Elite 11) and single-use plastic syringes 2 or 5 mL, and 50 mL (HSW SOFT-Ject® Luer Lock) connected to the mixing chamber via Teflon tubing. The two smallest syringes were used for the fluorophore solution in THF and the 50 mL one for water. The organic solution was injected through the smaller square channel (300 µm wide) of the microcircuit while water was injected through the larger square channel (600 µm wide). Solution volumes of 2 mL were at least needed for each measurement due to the dead volume. FON dispersions were collected from the mixing chamber outlet via two Teflon tubes, placed in mutual opposite directions The microfluidic circuit was cleaned multiple times with THF and water between each measurement, except for experiment A where the concentrations were the same for every sample. The Microsphere500 mixing chamber could be used as many times as needed, and tubes were renewed only if fluorophore traces remained after thorough washing.
2.3. Photocrosslinking reaction
Preparation of solutions for photopolymerization as FONs and thin films. Three distinct solutions
of ALD (15.0 mg, 3.3 mmol), pentaerythritoltetrakis(3-mercaptoprioionate) (PT-SH) (8.1 mg, 3.3 mmol), and 2,4-6-trimethylbenzoyl-diphenylphosphine (TPO) (1.4 mg, 0.8 mmol) in THF (5 mL) were separately prepared. Three daughter solutions (A and B), completed to a 2 mL total volume with THF were made out of them following the TPO:PT-SH:ALD volume composition (in mL) as follows: P0) 0:0:1 in THF (1 mL), P1) 0.1:0.1:1 in THF (0.8 mL) and P5) 0.1:0.5:1 in THF (0.4 mL). Such solutions were directly deposited on a glass slide and let dry to form homogeneous thin films. Alternatively, FON0, FON0.1 and FON0.5 could be produced by manual
Accepted
addition in water (2.5 mL) under vortex stirring of a small amount (100 L) of solutions P0, P1 or P5 respectively.
Photocrosslinking conditions. Photocrosslinking was performed in 1 cm-wide quartz cell under
constant stirring, using a UV light source Xe-Hg lamp (Hamamatsu LC8) paired with a 365 nm bandpass filter. The lamp power used for all experiments was set at 30 mW.cm-2 and measured with a photodetector (UV-vis Nova II Ophir). Irradiation was performed for 5 min. Photocrosslinking in deoxygenated conditions was carried out via argon bubbling for 1 min. Then, a constant flow of argon was settled in the quartz cell for 2 min before photoirradiating the solution.
Photoirradiation of FONs, prepared here upon manual precipitation of a TPO:PT-SH:ALD mixture into water, was performed at 365 nm in a quartz cell under constant stirring using an irradiation lamp equipped with an interferential filter. FONs devoid of TPO or PT-SH were also prepared to serve as control samples. Two aeration conditions were examined: without and with preliminary deoxygenation for 2 min by argon bubbling of the FON suspensions. We fixed the irradiation time and power at 5 minutes and 30 mW.cm-2 respectively, which offered the best compromise in terms of photocrosslinking efficiency and persistence of fluorescence from preliminary solid-state experiments. After irradiation, all samples were diluted in the same way to yield absorbance such that the risks of inner filter effects in emission (less than 0.1 where the emission and absorption spectra overlap) and photoinduced photopolymerization during
excitation (excitation slits with limited width were set) were minimized.
Accepted
2.4. FON structural investigations
Dynamic light scattering (DLS). FON size measurements in aqueous dispersions were performed
via DLS using the VASCO Kin™ nanoparticle sizer provided by Cordouan Technologies, and
equipped with equipped with a 45 mW diode laser operating at 638 nm. The laser power was manually adjusted for each sample before any measurement to get satisfying results. All measurements were collected on aqueous FON dispersions at 25 °C in a backscattering mode at a 170° angle, over 2 min with a 5 Hz acquisition frequency, namely every 200 ms. Acquisitions and analyses were done with the Nano KinTM software, provided by Cordouan Technologies, Cumulant-based algorithm in intensity was privileged to infer size distributions. A logarithmic scale was adopted for clarity reason, improving visualization of all samples on the same scale, with no impact on the fitted parameters.
Zetametry. Measurements of surface potential ζ, were carried out by means of a Zetasizer Nano
ZS ZEN 3600 (Malvern). The samples were placed in disposable folded capillary cells (DTS1070). Two sets of three measurements were realized for each sample and the zeta potential was calculated from electrophoretic mobility dispersion fitted by the Smoluchowski model.
Transmission electron microscopy. FON size measurements as dry samples were performed
using a MO-Jeol 1230 microscope (80 kV) and diluted samples deposited on holey carbon-coated copper grids (300 mesh), purchased from Agar Scientific.
2.5. Photophysical studies
Steady-state measurements. UV−visible absorption spectra were recorded using a Varian Cary
5E spectrophotometer (Agilent). Emission spectra were recorded using a Fluorolog 3 spectrofluorometer (Horiba). Correction for the emission spectra with regard to the spectral
Accepted
response of the detector was automatically applied. Fluorescence quantum yields were determined in solution, referred to coumarine 540A in ethanol (Φf = 0.38).
Time-resolved fluorescence measurements. Fluorescence time decays were measured in water
using the fully automated spectrofluorometer (model Fluotime 300, PicoQuant) following the time-correlated single photon counting method. Excitation was performed using a pulsed laser diode (LDH-D-C-450B) working at 450 ± 10 nm (70 ps fwhm time resolution), or a pulsed LED (PLS 340) working at 340 nm ± 10 nm (500 ps fwhm time resolution). Fluorescence decays were recorded using a Hybrid-PMT detector combined with an acquisition temporal resolution up to 25 ps. Long-pass edged filter purchased from Semrock centered at 473 nm (BPL01-473R-25) or 355 nm (BPL01-355R-25) was used to discard any possible contribution of excitation light scattering by the organic nanoparticle dispersions. Time fluorescence decay modeling was performed with EasyTau 1 software developed by PicoQuant.
Resonance energy transfer (RET). Förster resonance energy transfer could reasonably be evoked
to explain the spectral evolution of the emission signals. The Förster radius can be estimated from the spectral overlap factor J between the energy donor (ALD) and acceptor (VIN) (Eq. 2).
0 4 A D 4 D 2 6 0 I ( ) ( ) d n 2108 . 0 R with
0 4 A D( ) ( ) d I J (2)°D: fluorescence quantum yield of the donor in the absence of acceptor, n: refractive index of the solution, orientation factor with 2 = 0.476 for dipoles in a rigid medium like FONs, I
D:
emission intensity of the donor, A: molar absorption coefficient of the acceptor.
Accepted
The energy transfer quantum efficiency FRET was calculated from the donor emission signal, through the expression FRET = 1-ID/I°D, where I°D and ID feature the emission intensity in the absence and presence of acceptor, respectively.
2.6. AFM quantitative mechanical measurements
Sample preparation. Freshly cleaved mica squared plates (1 inch, Bruker) were treated with a
0.01 % (w/v) poly-L-lysine solution (Aldrich) for 15 min, thoroughly rinsed with Millipore water and finally dried under a nitrogen flow. They were subsequently incubated for 30 min with FON dispersions that were previously diluted 100 times, and washed again with Millipore water. The dispersions were let dry in air before AFM measurements.
Atomic force microscopy (AFM). All AFM experiments were performed at room temperature (20
°C) using a NanoWizard® atomic force microscope (JPK, Germany) equipped with inverted optical microscope and x-y closed-loop control system. Cantilevers with calibrated spherical carbon-glassy tips (BiosphereTM series purchased from Nanotools) characterized by a 100 nm ± 10 nm tip radius and 2.8 N.m-1 spring constant were first used for imaging in intermittent contact mode to select nanoparticles to be probed. Force mapping using a scanning mode was privileged over repeated measurements on single nanoparticles to avoid tip positioning uncertainty relative to the nanoparticles. It offers the additional advantage to specifically select the force curves recorded at the nanoparticle center in a post-treatment procedure. Typically, 3232 force mapping curves were recorded around the selected nanoparticle (500 nm 500 nm) and force
versus piezo movement (F-Z) curves, located at the nanoparticle center, were extracted in an
offline procedure. The raw F-Z approach curves were converted into force versus tip-sample distance curves to apply a contact mechanics model for a sphere-sphere contact geometry. The
Accepted
resulting apparent elastic modulus E was then obtained by fitting these curves with the Hertz model.
3. RESULTS AND DISCUSSION
3.1. FON fabrication: manual addition vs microfluidic mixing chamber
In order to generate photocrosslinkable FONs out of small molecules following high impact-flow microfluidics, we resorted to push-pull structures ALD and VIN that had been designed to display both fluorescence and photocrosslinking properties in the solid state for solution-processed OLEDs (Figure 1).[23-24] Such compounds display large structural similarity and distinct emission ranges, namely greenish-blue for ALD and orange-red for VIN as a result of their aldehyde and dicyanovinylidenyl groups respectively, that will be exploited latter in the manuscript to fabricate color-tunable FONs.
Figure 1. Structures of fluorophores processed as color-tunable and photocrosslinkable FONs.
Accepted
The propeller shape of the triphenylamino core and the introduction of two unresolved chiral centers at the benzylic carbon atoms, yield racemic mixtures, and advantageously limit the formation of dark aggregates. In this way, fully amorphous material, characterized by a glass transition temperature Tg measured at 6.4 °C by differential scanning calorimetry, is obtained and
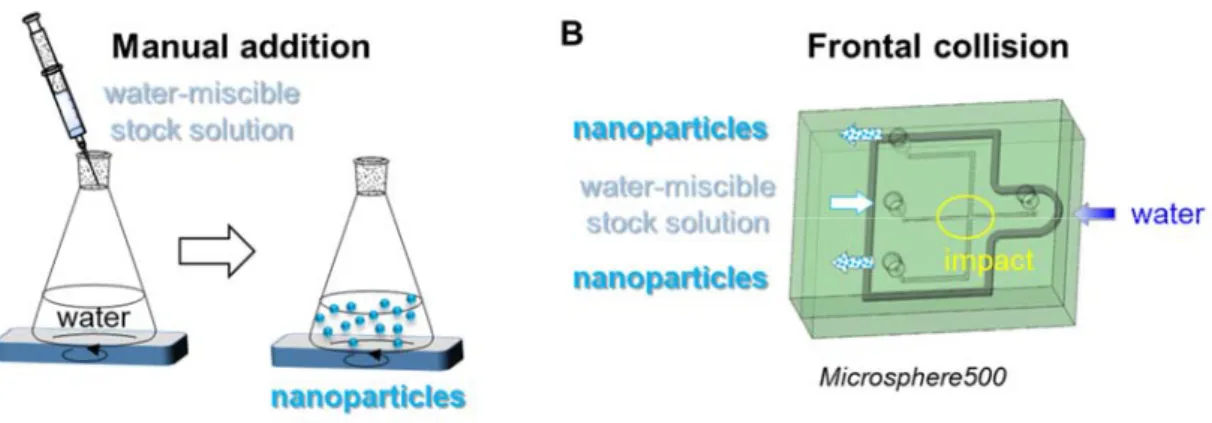
showed a thick oily-like state. This low glass transition helps in the formation of spherical organic nanoparticles upon nanoprecipitation in water to minimize surface tension effects and prevent recrystallization in the course of time that could impart FONs with undesirable aggregation effects or various crystalline phases.[25] FON nanoprecipitation typically proceeds at room temperature from the quick addition and mixing of a concentrated dye solution in tetrahydrofuran (THF) within a larger volume of water using magnetic stirring, to cause efficient dispersion (Figure 2A).
Figure 2. FON fabrication following flash precipitation. A) Quick manual addition of a stock
fluorophore solution into a large volume of water under vortex stirring. B) Transparent 3D-view of the Microsphere500 micromixer allowing for high-impact frontal collision of two opposite flows, containing respectively the stock solution (channel with a 300 m 300 m square section) and water (channel with a 600 m 600 m square section). The thicker gray line features the rubber seal, sandwiched between the two aluminum plates (green), to avoid leakage
Accepted
due to high-pressure injection, and the thinner line corresponds to the microfluidic circuit itself, etched in the bottom plate. All tubing inlets and outlets are fixed on the top plate and indicated by a circular aperture.
Controlling two main criteria like the concentration of the organic stock solution and the mixing rate thus appears crucial. In order to independently investigate their influence in a defined manner, we resorted to the Microsphere500 mixing chamber comprising one channel (600 m-large section), supplied with water and slightly up-shifted with regard to an opposite smaller channel (300 m-large section), funneling the organic stock solution (Figure 2B). On the basis of previous studies involving manual injection in water of a 0.1 wt. % dye solution in THF, we considered an initial 0.5 wt. % dye concentration as a median value and varied this mass fraction from 0.025 up to 1 wt. %. The mixing rate was indirectly tuned by changing independently the flow rates of each channel and the respective flow rate ratio, which controls the mass ratio. We thus carried out two distinct experiments A and B, corresponding to the conditions detailed in Table S1, namely variable organic solution (o) and water (w) flow rates (constant flow rate ratio (o:w) and stock solution concentration), and variable stock solution concentration (constant (o) and (w) flow rates, and flow rate ratio (o:w)) respectively. For each experiment A and B, the samples were collected 4 s after starting the mixing process to avoid composition inhomogeneity. FON size distribution was measured by dynamic light scattering (DLS) right after the sample collection. For experiment A, the FON Z-average size (diameter) DZ decreased from 193 to 86
nm (with a polydispersity index (PDI) averaged over the five measurements found around 0.215) when the flow rate increased by a factor of 5 (Figure 3A). In the same way, the DZ values for
experiment B decreased from 166 to 66 nm (with a similar averaged PDI around 0.219) along with the reduction of the injected stock organic solution (Figure 3B). Such evolution recalls
Accepted
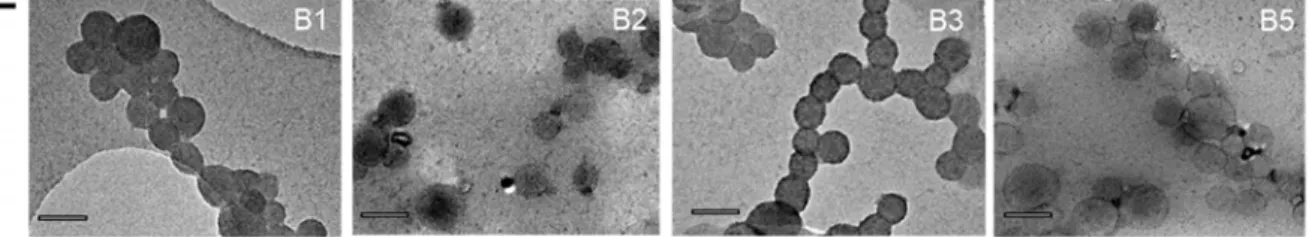
previous results obtained with a 3D flow focusing chamber although in the latter case, control of the size polydispersity was delicate to be achieved with high flow focusing ratios.[26]. By contrast to DZ hydrodynamic diameters, the dry diameter DTEM values, determined from statistical
numbering of TEM-imaged FONs for samples issued from experiment B (Figure 5E) were found quite constant at around 61-66 nm with a relatively narrow size dispersion (Table S2 and Figure S2). Such large distinct evolutions may appear quite puzzling at first sight and could suggest aggregation at higher concentration to explain the size increase, which appears quite incompatible with the well-defined nanoparticles observed by TEM or later on by AFM. As mentioned above, compound ALD displays quite a low Tg below room temperature. We suspect fragmentation in
the TEM chamber of the honey-like FONs into smaller nanoparticles with more stable geometry, hence very similar size distributions are obtained.
Accepted
Figure 3. DLS measurements of FON dispersions made of ALD fluorophores and obtained by
means of the Microsphere500 mixing chamber: A) experiment A, B) experiment B, and by means of vortex stirring: C) experiment C. D) Variation of the Z-average size (diameter) DZ of FONs as
a function of the water flow rate Qw (experiment A) and stock solution concentration (experiment
B); error bars were calculated using a 95% confidence interval. E) TEM imaging of FONs issued
from experiment B (sample B4, not represented here, gave intractable images). Scale bar: 100 nm.
As for the DZ values, , it was interesting to find that they decreased as a function of the
water flow rate Qw, following a power law DZ = 544Qw-0.424, as commonly reported for micromixers where one flow rate predominates, even in the case of systems with distinct geometry or smaller flow velocity.[27] By contrast, the DZ values evolve quite linearly as a
function of the stock solution concentration (Figure 3D). Hence, we can suggest that high flow rates favor efficient dispersion of the organic constituents and nucleation upon supersaturation, conducting to smaller nanoparticles with a narrow size distribution. Transmission electron microscopy imaging showed indeed smooth and well spherical nanoparticles whose size appears very homogeneous. Interestingly, compared to identical final ALD concentrations (experiment
B), nanoparticles obtained upon manual addition in water of ALD solutions with a distinct stock
solution concentration (experiment C) systematically showed larger mean size and size polydispersity (averaged PDI equal to 0.230) (Figure 3C, Table S1). Finally, we tested the
Accepted
reproducibility of experiment A where flow impact rather than stock solution concentration exerts higher influence on FON size. We found that the diameter evolution of the second series differs by only 5 % compared to the first one. All these elements let us propose that FON fabrication using the Microsphere500 mixing chamber yields high-quality and reproducible samples.
Size measurements were completed with surface potential measurements by means of zetametry to investigate FON colloidal stability in water. Surprisingly, largely negative values of -39 ± 8 mV were obtained. Given the FON size, values larger than -30 mV, indicate great colloidal stability in water which was indeed found over one year at least (Figure S3). This apparently surprising result, despite the large ALD hydrophobic character and absence of ionizable units, has already been observed and ascribed to the adsorption at the FON surface of traces of fatty acids, present as contaminants.[28]
To conclude on this part, it is worth noting that the rate of the impacting organic flow used in our case is significantly reduced by a factor of 4 to 5 comparatively to the CIJ and MVIM mixer geometries used in literature, while nanoparticles with size of similar Z-average (DZ
60-200 nm) are obtained.10b This comparison is based on literature data since we could not benefit from direct assay on the last two mixers. This lets us propose that the Microsphere500 mixer, allying ultrafast opposite impacting flows, vortex mixing and easy modulation of the kinetic energy, would represent an attractive setup to significantly limit the consumption of precious organic materials in the formulation of active nanoparticles.
3.2. Evolution of the FON photophysical properties as a function of the mixing rate
Since fabricated FONs in these studies are devoid of any additional surfactant or polymer, direct assessment of their photophysical properties as a function of their intrinsic size and method of
Accepted
preparation can be performed. All nanoparticle dispersions displayed bright bluish-green emission, centered at 500 nm upon excitation in the UV absorption band composed of a shoulder at 375 nm and a maximum at 345 nm that are related to charge transfer from the triphenylamino center to the formyl and biphenyl moieties, respectively.[23] Interestingly, this emission maximum is quite similar to that reported for non-doped thin films fabricated by spin-coating a 1 wt. % dye solution in chloroform and subsequently vacuum-dried,[23] thereby indicating that local polarity effects originate from the dyes themselves, independently of the surrounding hydration shell. The constant energy value for the emission signal of all nanoparticles lets us suggest quite similar dye spatial arrangements from one FON batch to another since any significant difference in local surroundings would cause notable energy shift of the transition. At this step, performing fluorescence microscopy imaging on single nanoparticles could be very stimulating to infer their proper responses, but such experiments represent an entire filed of investigations per se, beyond the scope of the current studies. However, particular attention paid to the emission intensity and dynamic relaxation of the excited state revealed significant difference between the fabrication methods A and B. Each sample was diluted with Millipore water in the same amount before measurements to limit inner filter effects, especially in excitation. In agreement with the constant concentration of fluorescent material in all samples of experiment A, the absorption and emission spectra display almost the same intensity, except for sample A5. The latter contains larger FONs formed under larger flow rates, and show significant contribution of light scattering (Figure 4A). At this step, we must admit that we have no reasonable explanation to support the observed bathochromic and hypochromic shifts. Formation of aggregates that is commonly evoked is indeed contradictory with the almost constant value of the fluorescence quantum yields f
measured to be 0.16 on average. As for the samples of experiment B where the concentration of
Accepted
injected fluorophores is twice as high from one sample to another, the intensity of the absorption and emission spectra logically increased proportionally (Figure 4B). No change in the general shape occurred, hence intermolecular interactions within the nanoparticles are similar between the different batches. The fluorescence quantum yield f was found very close to that for samples
A, namely at 0.17 on average. Since ALD fluorophores, characterized by strong charge transfer
in their radiative transitions,[23] are very sensitive to local polarity effects in their excited states, any strong structural changes in the fluorophore surroundings would be accompanied by notable modification of their emission energy and intensity as well. The constant value found for f tends to indicate similar dye self-assembling within FONs whatever the flow energy impact.
Accepted
Figure 4. ALD FON dispersions under ambient light and 365 nm excitation (top) and UV-vis
absorption and emission spectra (exc = 375 nm) (bottom) of aqueous ALD FON dispersions: A) issued from experiment A, B) issued from experiment B. Fluorescence time decays (middle) (exc = 340 nm, em = 501 nm) and evolution of the fractional amplitudes ai after reconvolution from
the excitation pulse response (gray trace) and global fitting following a three-exponential mathematical law (bottom) of aqueous ALD FON dispersions issued from: C-D) experiment A,
Accepted
and E-F) experiment B (residual traces of the global fitting are indicated on the bottom of the lifetime decays in Figures C and E).
Yet, accurate examination of the FON fluorescence decays revealed subtle evolutions with the FON diameter. The decays, obtained after excitation at 340 nm and recording the emission signal at 501 nm, required a multi-exponential fit and provided three distinct lifetimes using global fitting analyses (1 = 0.88 (A), 1.02 (B) ns; 2 = 3.17 (A), 3.45 (B) ns;3 = 6.58 (A), 6.77 (B) ns) for the samples of both experiments, recalling previous behaviors investigated in solid thin film (Figure 4C-D). The smaller lifetimes found overall for the samples A compared to those of samples B may be related to the slightly distinct surroundings in terms of water:THF composition in the final mixture since the injected THF volume increased from sample B1 through sample B5. As for the evolution of the lifetime fractional amplitudes ai along with the FON diameter, two opposite evolutions could clearly be observed (Figure 4E). The a2 contribution of the intermediate lifetime 2 globally increased with the FON size. Conversely, the a1 component of the shorter lifetime 1 decreased, even more neatly for samples B. Based on previous description of FONs in water, molecules at the interface undergo significant quenching in contact with water due to vibrational relaxations and would be representative of the shorter lifetime 1.[29] On the contrary, the intermediate lifetime 2, whose contribution dominates for fluorophores processed as neat thin films, would suggest a bulk origin. So, observing a raise of the shorter lifetime component 1 and a drop of the intermediate lifetime component 2 with the FON size reduction agrees with an increase in the surface-to-volume ratio, showing the sensitivity of ALD fluorophores toward their close surrounding.[30] We thus harnessed such sensitivity to show that bicomposite FONs can also be obtained using the high-impact Microsphere500 microfluidic
Accepted
chamber with little risks of demixing into separated components caused by high dye concentrations in stock solutions.
3.3. Bicomposite FONs with tunable color emission and amplified emission intensity as
a result of dye coprecipitation
To this aim, we targeted the generation of bicomposite FONs out of energy donors and acceptors, which can promote efficient energy transfer for spatially confined fluorophores. We thus employed the red-emissive fluorophore VIN, displaying large structural similarity with the bluish-green fluorophore ALD and yielding amorphous material (Tg = 11.9 °C), so that high
mixing entropy is favored in the final bicomposite FONs (Figure 1). Its absorption spectrum broadly overlaps the emission spectrum of the bluish-green emitter, yielding efficient Förster resonance energy transfer (FRET), with a Förster radius R0 valued to be 39 Å in tetrahydrofuran from calculations. To validate our approach, we prepared four stock solutions in THF with a varying ALD:VIN composition: 100:0, 95:5, 80:20 and 0:100 %. We fixed the flow rates of the microchannels funneling water and THF solution respectively at 50 and 2 mL.min-1, and
ALD:VIN solutions at a 0.25 wt. % total dye concentration, which represents a median value
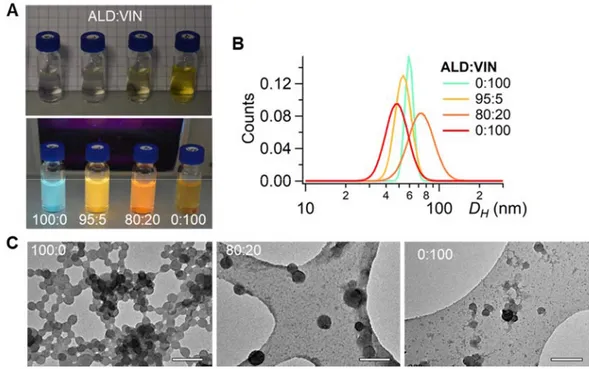
among the previous assays. All samples investigated by TEM formed well-defined nanoparticles, the VIN FONs being a little less defined (Figure 5C). Their zeta potential values were found to be around -42 ± 4 mV, supporting again large colloidal stability in water. Lower diameters could be noticed for all batches compared to the size distribution measured for experiment B2 involving a similar dye concentration. This is likely to be due to a dilution effect, slightly higher than expected during solution preparation, thereby generating smaller FONs. Nevertheless, this does not question the logic size evolution obtained through a series of samples, as demonstrated by the above reported reproducibility assay, provided that FON are generated in the row, using the same
Accepted
tubing, solvents and plastic syringes as experimented here. It is worth noting that the FON diameter varied despite the constant amount of injected organic material, which can be ascribed to distinct dipolar interactions established between the fluorophores and water molecules (Figure 5B).
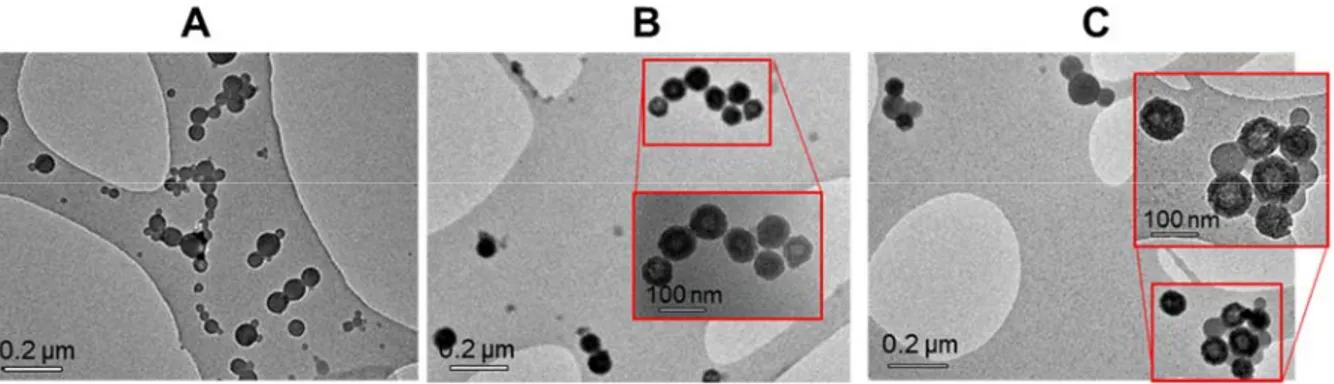
Figure 5. ALD:VIN FON dispersions obtained from the Microsphere 500 mixing chamber for
distinct compositions 100:0, 95:5, 80:20 and 0:100. A) Vials in transmission (top) and under 365 nm excitation (bottom). B) DLS distributions. C) TEM imaging using holey carbon-coated copper grids (sample 95:5 was not imaged for priority reasons). Scale bar: 200 nm.
In agreement with the increasing amount of compound VIN, an absorption band centered at 452 nm rose (Figure 6A), typical of the lower charge transfer excited state calculated from TDDFT computations.[23] Given the absence of spectral overlap in the visible between the absorption spectra of the ALD blue and VIN red emitters and the match at 375 nm between a maximal absorption for ALD and a minimal absorption for VIN, the emission spectra were
Accepted
recorded upon excitation at 375 nm and 452 nm to distinguish the contribution of both dyes and assess the extent of energy transfer. For exc = 375 nm, the emission band centered at 500 nm was typical of pure FONALD and dramatically shifted to 589 nm for FONs comprising only a 5 mol. % amount of VIN (Figure 6B), yielding bright sun yellow emission (Figure 6A).
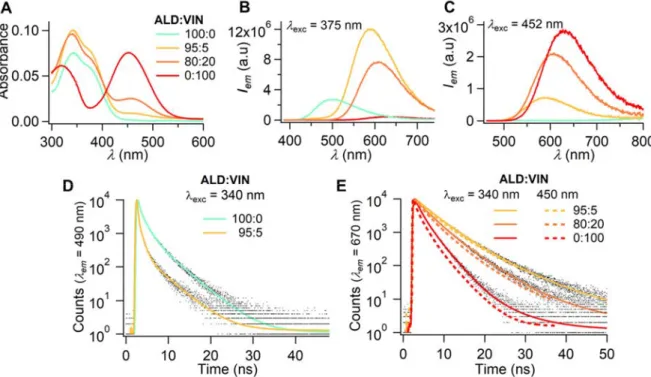
Figure 6. Aqueous ALD:VIN FON dispersions obtained using the Microsphere500 mixing
chamber with carrying composition 100:0, 95:5, 80:20 and 0:100: A) UV-vis absorption spectra, B) emission spectra upon excitation at exc = 375 nm where mainly ALD absorbs, C) emission spectra upon excitation where mainly VIN absorbs, D) Fluorescence time decays upon excitation at exc = 340 nm and recording at em = 490 nm where ALD exclusively emits light, E) fluorescence time decays upon excitation at exc = 340 and 450 nm and recording at em = 670 nm where VIN exclusively emits light.
Its intensity appeared to be 17 times higher compared to that obtained upon direct excitation at 452 nm and 700 times higher if VIN alone were excited at the same concentration (Figure 6C).
Accepted
From the donor emission spectra, the energy transfer quantum efficiency FRET from ALD to
VIN could be assessed to be 74 and 96 % for FON compositions of 95:5 and 80:20 respectively.
This large value could be confirmed through time-resolved fluorescence measurements, by exciting at two distinct wavelengths, namely 340 and 450 nm, and recording the fluorescence decays at 490 (Figure 6D) nm or 670 nm (Figure 6E). A strong decay of the blue-greenish signal was again noted for the 95:5 FON composition where the amplitude-averaged lifetime <>a
indeed decreased by 75 % from 0.81 to 0.23 ns. Very interestingly, the fluorescence decay at 670 nm shortened (<>a dropped from 4.46 to 1.45 ns) for increasing amounts of red emitter VIN,
whatever the excitation at 340 or 450 nm, whereas similar time constants would have been expected (Table 1). Unfortunately, we were not allowed to distinguish any negative time contribution in the fluorescence decay of VIN upon exciting at 340 nm, which features very efficient energy transfer from ALD to VIN molecules, namely less than a dozen of ps, since the instrumental response function of the acquisition card is not higher than 120 ps. This trend is actually to be related to distinct polar surroundings undergone by the red dyes as a function of the FON composition. This is illustrated by the progressive bathochromic shift (589, 607, and 630 nm) of the emission band undergone for larger amounts (5, 20 and 100 %) of VIN whose dipole moment was calculated to be 9.68 D against 7.93 D for ALD. Since VIN is strongly solvatochromic and known to be significantly quenched in polar surroundings (water included) upon strong twist in the excited state,[31] color tuning is here caused by the change in polarity[32] around the red emitters with the composition, rather than by overlapping emission signals.[21c] Nanoprecipitation of pure ALD or FVIN FONs out of fluorophore mixes could be ruled out on the basis of the above calculated Förster radius value, which is not compatible with the FON
Accepted
diameter, larger than 40 nm, and the almost quantitative energy transfer observed for only a 5 % amount of FVIN energy acceptors with regard to the ALD energy donors.
Table 1. Size distributions and photophysical properties of color-tunable FON dispersions made
of ADL:VIN of varying composition.
FON ALD:VIN DZ (nm) (PDI) λmax(abs) (nm) λmax(em) (nm)[a] Φf [b] <>a[c] (ns) exc =340 nm em = 490 nm exc =340 nm em = 670 nm exc =340 nm em = 670 nm 100:0 (0.019) 61 375, 342 500 0.13 0.93 - - 95:5 (0.069) 52 375, 342 452, 589 0.34 0.23 4.54 4.46 80:20 70 (0.250) 456, 375, 340 607 0.22 - 3.48 3.04 100:0 (0.142) 44 452, 320 630 0.10 - 1.93 1.45
[a] Excitation indifferently at 375 or 452 nm (except for neat ALD FONs). [b] Valued using coumarin 540A as a fluorescence standard (f = 0.38). [c] Fluorescence decays were modeled through a
triexponential law:
3 1 i i iexp( t/ ) ) t ( I with the fractional amplitudes
j j i i / a
3 1 i i i a a Comparative photophysical experiments performed on mixtures of pristine ALD FONs and
VIN FONs following the same ALD:VIN ratios than those reported for FON blends indeed
evidenced the absence of significant energy red shift upon exciting ALD FONs for a 95:5
ALD:VIN ratio (Table S3 – Figure S4). Only the 80:20 ALD:VIN composition may suggest
slight interactions between the separated FONs as a consequence of favorable hydrophobic
Accepted
interactions rather than any interactions between solvated individual dyes whose photophysical properties remain unchanged (Figure S5). Indeed, partial energy shift of the ALD emission band that broadens due to the VIN contribution and possible inner filter effects was observed (Table S3 – Figure S4B-C and associated comments), while the amplitude-averaged lifetime <>a of
the ALD units was reduced by half (Figure S6). However, in that case, energy transfer that would then operate at the interface between ALD and VIN FONs is by no way comparable to that observed for bicomposite FONs. All these observations thus support the fact that FRET operates within the bicomposite FONs as a result of ALD and VIN coprecipitation within the same nanoparticles that do not demix into separate FONs. Modeling the kinetics of such an energy process in FONs as a function of the amount of energy acceptors with respect to that of the energy donors would require more complex approaches, taking into account energy migration through space and through bond, namely through dipole-dipole interactions or hopping, as described in literature.[33]
To conclude on this part, diluting red-emissive dyes in hydrophobic matrices, serving as energy antenna, appears as a very attractive and ubiquitous approach to generate bright far-red FONs, thereby avoiding competitive radiationless deactivation of low-energy emitters in polar surroundings. Such observation echoes the recent theoretical developments on fluorescence quenching in solution and fluorescence recovery in AIEgene nanoparticles. Such studies point out the dramatic energy shift of the conical intersection (CI) between the S1 excited state and S0 ground state undergone along the potential energy surface for self-assembled fluorophores, thereby reducing the radiationless deactivation pathway.[12b] Based on previous transient absorption spectroscopy experiments carried out on a similar compound, we herein suspect that such CI shift may operate to explain the considerable dye emission amplification observed for
Accepted
VIN fluorophores embedded in ALD FONs compared to dyes dissolved in THF (Figure S5) or
self-assembled in “monocompound” FONs, which would result not from steric effects but from strongly exacerbated polarity effects. To go a step further and harness the high spatial confinement of dyes in organic nanoparticles, we finally tested the ability of photocrosslinkable fluorophores like ALD to be reactive after being processed as FONs, which to our knowledge as never been explored so far, despite the great interest in the generation of photopolymerized functional nanoarchitectures.[34],[35]
3.4. Photoreaction performed in pre-formed FONs
We here based our approach on the fact that ALD, processed as thin films, could undergo solid-state through a photoinitiated radical polymerization of its acrylate units.[23] In order to limit the action of oxygen acting as a radical scavenger, we privileged the well-documented thiol-ene reaction, highly compatible with water and ambient air and temperature conditions.[36] Pentaerythritoltetrakis(3-mercaptoprioionate) (PT-SH), containing four thiol units, was chosen as a crosslinker while 2,4-6-trimethylbenzoyl-diphenylphosphine (TPO) was retained as a hydrophobic photoinitiator (Figure 1). The latter choice was motivated by previous results showing high deactivation of TPO photodissociation upon competitive energy transfer toward low-energy lying red emitters like VIN.[24] Thanks to the aforementioned results emphasizing amplified energy transfer in FONs, we thus privileged the use of ALD instead of VIN, despite a TPO excitation in the UV range, namely at 365 nm, overlapping the ALD absorption spectrum. Based on preliminary assays performed on thin films to obtain efficient crosslinking within a reasonable irradiation time, two distinct PT-SH:ALD composition with a molar ratio of 0.1:1 and 0.5:1 (FON0.1 and FON0.5), corresponding respectively to a 20 % and equimolar content of thiol units compared to the acrylate ones, were tested while keeping constant at 2.5 mol. % the amount
Accepted
of TPO photoinitiator with regard to ALD. FONs devoid of TPO and PT-SH were also prepared to serve as control samples (FON0).
From the absorption and emission spectra before photoirradiation, the shape and intensity maxima of the bands were found to be almost the same, given the experimental uncertainty upon dilution or precipitation in water, showing weak impact of the additional components like PT-SH known to promote fluorescence deactivation upon reductive electron transfer (Figure 7B and 7D).[37] After photoirradiation in deoxygenated conditions, noticeable changes in absorption could be observed, especially for FON0.5 with a higher PT-SH content, where the low-energy shoulder at 375 nm, ascribed to the charge transfer excited state responsible for emission, is reduced in intensity (Figure 7C).
Figure 7. A) Schematic description of photocrosslinking of FONs made of TPO:PT-SHx:ALD
upon irradiation at 365 nm for 5 min. (30 mW.cm-2). UV-vis absorption spectra: B) before irradiation, C) after irradiation, and D) emission spectra (
Accepted
molar compositions of SH (ALD alone: x = 0; TPO:0.1 SH:ALD x = 0.1; TPO:0.5 PT-SH:ALD x = 0.5) where TPO is employed at a 2.5 mol. % ratio with respect to ALD. Irradiation was performed on deoxygenated FON dispersions by prior argon bubbling.
Particular focus on control FON0 made exclusively of ALD showed a similar reduction, albeit much less pronounced than for any other composition (Table 1). When looking at the emission spectra, all samples remained very emissive, even though the signal intensity appeared to be about 30-36 % of the initial value. Again, the most significant reduction is noticed for FON0.5 containing TPO and the higher amount of PT-SH crosslinker. We thus here suspect that photoredox processes assisted by UV irradiation or electron transfer from the thiol units, rather than the photocrosslinking reaction itself, are responsible for the photodegradation of the fluorophores promoted in their excited state. Indeed, photoirradiation of the FON dispersions in the absence of prior argon bubbling caused dramatic loss of the emission intensities to 6-16 % of their initial values.
In order to prove the reality of photocrosslinking, structural nanometer scale investigations were carried out first by resorting to TEM imaging. While the aspect of FON0 and FON0.5 appeared smooth and round before irradiation, it systematically evolved to a more grainy structure while keeping its overall spherical shape, which lets us again suggest homogeneous composition of the precipitated composite FONs during fabrication (Figure 8).
Accepted
Figure 8. TEM images of FON dispersions deposited on holey carbon-coated copper grids. A)
FON0,5 before irradiation, B) FON0,5 after irradiation, C) FON0 before irradiation at 365 nm. Interestingly, for sample FON0,5, all nanoparticles systematically appeared darker after photoirradiation, featuring a higher electronic contrast. This evolution could evoke denser systems, as a result of significant shrinkage due to photocrosslinking. When compared to model FON0, such geometry evolution is much less marked in agreement with little reactive species in the absence of TPO, indicating that dye degradation cannot be the sole pathway toward the noted structural change.
We thus performed atomic force microscopy measurements (AFM) to address at the nanometer scale some possible mechanical differences between non-photoirradiated and photoirradiated photocrosslinkable FONs. As FONs largely differ from rigid crosslinked polystyrene or silica nanoparticles often used as bioimaging probes, we decided to adopt an approach based on nanoparticle deformation upon compression rather than the common indentation method, especially valid on hard and non-deformable nanosystems.[38] We thus used calibrated spherical glassy carbon AFM probes with tip radius (100 ± 10 nm) comparable or higher than the radius of probed FONs, which favors compression instead of indentation during the conventional force curve measurements. In order to obtain reliable measurements, we carried
Accepted
out statistical analyses on a dozen of air-dried nanoparticles after deposition from highly diluted dispersions on cleaned mica surfaces, pretreated with lysine to favor FON attachment and avoid nanoparticle rolling effects. Under these controlled conditions, AFM force investigations of FON0.5 containing the higher PT-SH molar fraction before and after photoirradiation displayed significant mechanical differences in terms of E elastic modulus. E values increased by 62 % from non-photoirradiated FONs to photoirradiated ones, namely from 105 ± 11 to 170 ± 10 MPa (Figure 9).
Figure 9. FON0.5 (composition TPO:0.5 PT-SH:ALD) deposited on lysine-treated mica surface
before (1) and after irradiation (2) at 365 nm. A) AFM imaging of several nanoparticles. B) Elastic modulus E distribution upon force mapping investigations of one single nanoparticle (selected by a white square on Figure 9A).
Such significant changes well match the expected mechanical evolution when going from softer nanostructures to stiffer ones, as expected upon photocrosslinking. The revisited exploration method with compression rather than indentation presented here for quantitative mechanical measurements of quite soft nanoparticles by means of AFM, appeared as a nice approach to inform on FON rigidification, as a consequence of photocrosslinking.
Accepted
4. CONCLUSION
These studies have evidenced the versatile approach of generating FONs devoid of surfactant and displaying colloidal stability by means of a novel model of micromixer, Microsphere500, allowing for straightforward variation of the mean diameter as a function of the flow velocities or stock solution concentration. Compared to classical manual addition, this flash nanoprecipitation technique yields highly concentrated FON dispersions, characterized with much smaller size, narrower polydispersity, and high fabrication reproducibility without causing subsequent precipitation. The fabrication of monocomposite FONs has successfully been extended to the microfluidic production of bicomposite FONs without causing demixing or precipitation into separated nanoparticle despite the high concentration used. Such coprecipitation process was proved by implying energy donors and acceptors amenable to efficient electronic energy transfer that led to considerably enhanced emission of red emitters as a result of the tight confinement and mutual polarity effects. Finally, we harnessed such confinement effects for the first time to our knowledge to promote reaction within FONs containing fluorophores with photopolymerizable units, and therefore obtain photocrosslinked FONs based on photoinitiated thiol-ene reaction. The results point out the difficult balance between photoinitiation, and fluorophore photodegradation upon irradiation due to competitive excitation absorption. Quantitative mechanical studies performed at the nanometer scale by resorting to AFM revealed FON stiffening after photoirradiation, confirming the possibility to perform reaction with self-assembled molecules. Future studies will explore the possibility of trapping or post-grafting various molecules of interest using coupled microfluidic devices to impart FONs with theranostic properties and high colloidal stability in biological media if required. Further investigations of the mixing dynamics within the Microsphere500 chamber,
Accepted
beyond the scope of the current studies, will also be performed by replacing the aluminum plates with optically transparent windows and using a camera with ultra-high acquisition rate.
SUPPORTING INFORMATION
Supporting Information is available from the Wiley Online Library or from the author.
ACKNOWLEDGEMENTS
Camille Alvarado and Angelina d’Orlando from the BIBS platform of Nantes-Angers INRA (France) are gratefully acknowledged for their kind advices regarding TEM image acquisition. The Cordouan Technologies Company (Bordeaux, France) is strongly acknowledged for its constant and rich support regarding the analyses of nanoparticle samples. CNRS and Nantes University are finally gratefully acknowledged for their essential financial support through the Interdisciplinary Challenge in Mechanobiology (ENAMEL project) and interdisciplinary call within the NExT i-site excellence initiative (METCIN project) respectively. Finally, PicoQuant GmbH (Berlin, Germany) is warmly thanked for its exceptional remote scientific and technological support.
KEYWORDS. Fluorescent organic nanoparticles • microfluidics • size and control modulation •
photophysics • photochemistry
CONFLICTS OF INTEREST
There are no conflicts to declare.
REFERENCES
[1] a) S. J. Williams, C. Park, S. T. Wereley, Microfluid. Nanofluid. 2010, 8, 709-726; b) H. Ranchon, V. Picot, A. Bancaud, Sci. Rep. 2015, 5, 10128.
Accepted
[2] a) H. S. Peng, S. H. Huang, O. S. Wolfbeis, J. Nano. Res. 2010, 12, 2729-2733; b) H. Y. Zhou, M. Sharma, O. Berezin, D. Zuckerman, M. Y. Berezin, ChemPhysChem 2016, 17, 27-36.
[3] D. Wencel, T. Abel, C. McDonagh, Anal. Chem. 2014, 86, 15-29.
[4] a) M. Kanamala, W. R. Wilson, M. M. Yang, B. D. Palmer, Z. M. Wu, Biomaterials 2016,
85, 152-167; b) R. J. Gui, H. Jin, X. N. Bu, Y. X. Fu, Z. H. Wang, Q. Y. Liu, Coord. Chem.
Rev. 2019, 383, 82-103.
[5] A. C. Anselmo, M. W. Zhang, S. Kumar, D. R. Vogus, S. Menegatti, M. E. Helgeson, S. Mitragotri, ACS Nano 2015, 9, 3169-3177.
[6] S. Patel, J. Kim, M. Herrera, A. Mukherjee, A. V. Kabanov, G. Sahay, Adv. Drug Delivery
Rev. 2019, 144, 90-111.
[7] a) P. P. Mathai, J. A. Liddle, S. M. Stavis, Appl. Phys. Rev. 2016, 3, 011105; b) J. D. Keighron, A. G. Ewing, A. S. Cans, Analyst 2012, 137, 1755-1763; c) G. Chen, I. Roy, C. Yang, P. N. Prasad, Chem. Rev. 2016, 116, 2826-2885.
[8] a) R. Jenjob, F. Seidi, D. Crespy, Adv. Coll. Int. Sci. 2018, 260, 24-31; b) E. Lobry, F. Jasinski, M. Penconi, A. Chemtob, C. Croutxe-Barghorn, E. Oliveros, A. M. Braun, A. Criqui, RSC Adv. 2014, 4, 43756-43759.
[9] K. Landfester, Angew. Chem. Int. Ed. 2009, 48, 4488-4507.
[10] a) M. P. Robin, R. K. O'Reilly, Polymer Int. 2015, 64, 174-182; b) V. J. Pansare, M. J. Bruzek, D. H. Adamson, J. Anthony, R. K. Prud’homme, Mol. Imaging Biol. 2014, 16, 180-188.
[11] S. R. Mane, I. L. Hsiao, M. Takamiya, D. Le, U. Straehle, C. Barner-Kowollik, C. Weiss, G. Delaittre, Small 2018, 14, 1801571.
Accepted
[12] a) J. Mei, N. L. C. Leung, R. T. K. Kwok, J. W. Y. Lam, B. Z. Tang, Chem. Rev. 2015,
115, 11718-11940; b) S. Suzuki, S. Sasaki, A. S. Sairi, R. Iwai, B. Z. Tang, G.-i. Konishi,
Angew. Chem. Int. Ed. 2020, 59, 9856-9867.
[13] a) J. Gierschner, L. Lüer, B. Milián-Medina, D. Oelkrug, H.-J. Egelhaaf, J. Phys. Chem.
Lett. 2013, 4, 2686-2697; b) N. J. Hestand, F. C. Spano, Chem. Rev. 2018, 118, 7069-7163.
[14] a) E. Ishow, A. Brosseau, G. Clavier, K. Nakatani, P. Tauc, C. Fiorini-Debuisschert, S. Neveu, O. Sandre, A. Leaustic, Chem. Mater. 2008, 20, 6597-6599; b) J. Schill, A. Schenning, L. Brunsveld, Macromol. Rapid Commun. 2015, 36, 1306-1321; c) E. Genin, Z. H. Gao, J. A. Varela, J. Daniel, T. Bsaibess, I. Gosse, L. Groc, L. Cognet, M. Blanchard-Desce, Adv. Mater. 2014, 26, 2258-2261; d) J. Ochi, K. Tanaka, Y. Chujo, Angew. Chem.
Int. Ed. 2020, 59, 9841-9855.
[15] a) V. Privman, D. V. Goia, J. Park, E. Matijević, J. Coll. Int. Sci. 1999, 213, 36-45; b) W. S. Saad, R. K. Prud’homme, Nano Today 2016, 11, 212-227.
[16] B. K. Johnson, R. K. Prud'homme, AIChE J. 2003, 49, 2264-2282.
[17] a) N. M. Pinkerton, M. E. Gindy, V. L. Calero-DdelC, T. Wolfson, R. F. Pagels, D. Adler, D. Gao, S. Li, R. Wang, M. Zevon, N. Yao, C. Pacheco, M. J. Therien, C. Rinaldi, P. J. Sinko, R. K. Prud'homme, Adv. Healthcare Mater. 2015, 4, 1376-1385; b) Y. Liu, C. Y. Cheng, Y. Liu, R. K. Prud'homme, R. O. Fox, Chem. Eng. Sci. 2008, 63, 2829-2842. [18] M. Akbulut, P. Ginart, M. E. Gindy, C. Theriault, K. H. Chin, W. Soboyejo, R. K.
Prud'homme, Adv. Funct. Mater. 2009, 19, 718-725.
[19] a) A. Belkadi, A. Montillet, J. Bellettre, J. Energy Res. Tech. 2018, 140, 012202; b) E. A. Melo-Espinosa, J. Bellettre, D. Tarlet, A. Montillet, R. Piloto-Rodriguez, S. Verhelst, Fuel
2018, 219, 320-330.
Accepted
[20] A. Belkadi, D. Tarlet, A. Montillet, J. Bellettre, P. Massoli, Int. J. Multiphase Flow 2015,
72, 11-23.
[21] a) J. Boucard, T. Briolay, T. Blondy, M. Boujtita, S. Nedellec, P. Hulin, M. Grégoire, C. Blanquart, E. Ishow, ACS Appl. Mater. Int. 2019, 11, 32808-32814; b) J. Su, T. Fukaminato, J.-P. Placial, T. Onodera, R. Suzuki, H. Oikawa, A. Brosseau, F. Brisset, R. Pansu, K. Nakatani, R. Métivier, Angew. Chem. Int. Ed. 2016, 55, 3662-3666; c) E. Campioli, C. Rouxel, M. Campanini, L. Nasi, M. Blanchard-Desce, F. Terenziani, Small 2013, 9, 1982-1988.
[22] A. Kaeser, I. Fischer, R. Abbel, P. Besenius, D. Dasgupta, M. A. J. Gillisen, G. Portale, A. L. Stevens, L. M. Herz, A. Schenning, ACS Nano 2013, 7, 408-416.
[23] S. Olivier, L. Derue, B. Geffroy, T. Maindron, E. Ishow, J. Mater. Chem. C 2015, 3, 8403-8412.
[24] L. Derue, S. Olivier, D. Tondelier, T. Maindron, B. Geffroy, E. Ishow, ACS Appl. Mater.
& Interfaces 2016, 8, 16207-16217.
[25] P. J. Skrdla, J. Phys. Chem. A 2009, 113, 9329-9336.
[26] V. Genot, S. Desportes, C. Croushore, J. P. Lefevre, R. B. Pansu, J. A. Delaire, P. R. von Rohr, Chem. Eng. J. 2010, 161, 234-239.
[27] Y.-C. Tan, V. Cristini, A. P. Lee, Sens. Actuators B-Chem 2006, 114, 350–356. [28] K. Roger, B. Cabane, Angew. Chem. Int. Ed. 2012, 51, 5625-5628.
[29] J. Boucard, C. Linot, T. Blondy, S. Nedellec, P. Hulin, C. Blanquart, L. Lartigue, E. Ishow,
Small 2018, 14, 1802307.
[30] M. Breton, G. Prevel, J. F. Audibert, R. Pansu, P. Tauc, B. Le Pioufle, O. Francais, J. Fresnais, J. F. Berret, E. Ishow, Phys. Chem. Chem. Phys. 2011, 13, 13268-13276.
Accepted
[31] E. Ishow, R. Guillot, G. Buntinx, O. Poizat, J. Photochem. Photobiol. A: Chem. 2012, 234, 27-36.
[32] J. Schill, L. Ferrazzano, A. Tolomelli, A. Schenning, L. Brunsveld, RSC Adv. 2020, 10, 444-450.
[33] a) U. Gosele, M. Hauser, U. K. A. Klein, R. Frey, Chem. Phys. Lett. 1975, 34, 519-522; b) K. K. Pandey, H. C. Joshi, T. C. Pant, Chem. Phys. Lett. 1988, 148, 472-478.
[34] a) N. Corrigan, J. Yeow, P. Judzewitsch, J. Xu, C. Boyer, Angew. Chem. Int. Ed. 2019, 58, 5170-5189; b) E. Blasco, M. Wegener, C. Barner-Kowollik, Adv. Mater. 2017, 29, 1604005.
[35] T. E. Brown, K. S. Anseth, Chem. Soc. Rev. 2017, 46, 6532-6552.
[36] a) O. Z. Durham, D. V. Chapman, S. Krishnan, D. A. Shipp, Macromolecules 2017, 50, 775-783; b) D. W. Yee, M. D. Schulz, R. H. Grubbs, J. R. Greer, Adv. Mater. 2017, 29, 1605293.
[37] S. Dadashi-Silab, S. Doran, Y. Yagci, Chem. Rev. 2016, 116, 10212-10275. [38] M. E. Dokukin, I. Sokolov, Macromolecules 2012, 45, 4277−4288.
Accepted
TABLE OF CONTENTS GRAPHIC
Keywords: Fluorescent organic nanoparticles • microfluidics • size and control modulation •
photophysics • photochemistry
Authors: Stéphane Hoang, Simon Olivier, Stéphane Cuenot, Agnès Montillet, Jérôme Bellettre,
and Eléna Ishow*
Title: Microfluidic Assisted Flash Precipitation of Photocrosslinkable Fluorescent Organic
Nanoparticles for Fine Size Tuning and Enhanced Photoinduced Processes
Dispersions of bright fluorescent organic nanoparticles are fabricated at high concentration using high-impact mixing chamber allowing for fine size tuning and narrow size distribution. Dye spatial confinement within bicomposite nanoparticles enables amplified emission upon energy transfer due to polarity effects, and photopolymerization addressed at the nanoscale by atomic force microscopy.