HAL Id: hal-02378228
https://hal.archives-ouvertes.fr/hal-02378228
Submitted on 3 Nov 2020
HAL is a multi-disciplinary open access archive for the deposit and dissemination of sci-entific research documents, whether they are pub-lished or not. The documents may come from teaching and research institutions in France or abroad, or from public or private research centers.
L’archive ouverte pluridisciplinaire HAL, est destinée au dépôt et à la diffusion de documents scientifiques de niveau recherche, publiés ou non, émanant des établissements d’enseignement et de recherche français ou étrangers, des laboratoires publics ou privés.
Exploring the bottlenecks of anionic redox in Li-rich
layered sulfides
Sujoy Saha, Gaurav Assat, Moulay Tahar Sougrati, Dominique Foix, Haifeng
Li, Jean Vergnet, Soma Turi, Yang Ha, Wanli Yang, Jordi Cabana, et al.
To cite this version:
Sujoy Saha, Gaurav Assat, Moulay Tahar Sougrati, Dominique Foix, Haifeng Li, et al.. Exploring the bottlenecks of anionic redox in Li-rich layered sulfides. Nature Energy, Nature Publishing Group, 2019, 4 (11), pp.977-987. �10.1038/s41560-019-0493-0�. �hal-02378228�
Lawrence Berkeley National Laboratory
Recent Work
Title
Exploring the bottlenecks of anionic redox in Li-rich layered sulfides
Permalink
https://escholarship.org/uc/item/2n5061wmJournal
Nature Energy, 4(11)ISSN
2058-7546Authors
Saha, S Assat, G Sougrati, MT et al.Publication Date
2019-11-01DOI
10.1038/s41560-019-0493-0 Peer reviewedeScholarship.org Powered by the California Digital Library
1
Exploring the Bottlenecks of Anionic Redox in Li-rich Layered Sulfides
1 2
Sujoy Saha1,2,3†, Gaurav Assat1,2,3†, Moulay Tahar Sougrati3,4,5, Dominique Foix3,6, Haifeng Li7, Jean
3
Vergnet1,3, Soma Turi1, Yang Ha8, Wanli Yang8, Jordi Cabana7, Gwenaëlle Rousse1,2,3, Artem M. Abakumov9,
4
Jean-Marie Tarascon1,2,3*
5 6
1Collège de France, Chaire de Chimie du Solide et de l’Energie, UMR 8260, 11 Place Marcelin Berthelot, 75231 CEDEX
7
05 Paris, France
8
2Sorbonne Université, 4 Place Jussieu, F-75005 Paris, France
9
3Réseau sur le Stockage Electrochimique de l’Energie (RS2E), FR CNRS 3459, 33 Rue Saint Leu, 80039 Amiens, France
10
4Institut Charles Gerhardt - UMR 5253, 34095 Montpellier Cedex 5, France
11
5ALISTORE-European Research Institute, 33 rue Saint-Leu, 80039 Amiens Cedex, France
12
6IPREM/ECP (UMR 5254), Université de Pau, 2 Avenue Pierre Angot, 64053 Pau Cedex 9, France
13
7Department of Chemistry, University of Illinois at Chicago, Chicago, Illinois 60607, United States
14
8Advanced Light Source, Lawrence Berkeley National Laboratory, One Cyclotron Road, Berkeley, CA 94720, USA
15
9Center for Energy Science and Technology, Skolkovo Institute of Science and Technology, Nobel Str. 3, 143026
16
Moscow, Russia
17
† These authors contributed equally to this work.
18 *e-mail: jean-marie.tarascon@college-de-france.fr 19 20
Abstract
21To satisfy the long-awaited need of new lithium-ion battery cathode materials with higher energy
22
density, anionic redox chemistry has emerged as a new paradigm that is responsible for the high capacity in
23
Li-rich layered oxides, for example, in Li
1.2Ni
0.13Mn
0.54Co
0.13O
2(Li-rich NMC). However, their
market-24
implementation has been plagued by certain bottlenecks originating intriguingly from the anionic redox activity
25
itself. To fundamentally understand these bottlenecks (voltage fade, hysteresis and sluggish kinetics), we
26
decided to target the ligand by switching to isostructural Li-rich layered sulfides. Herein, we designed new
27
Li
1.33-2y/3Ti
0.67-y/3Fe
yS
2cathodes that enlist sustained reversible capacities of ~245 mAh·g
–1due to cumulated
28
cationic (Fe
2+/3+) and anionic (S
2–/ S
n–, n < 2) redox processes. In-depth electrochemical analysis revealed
29
nearly zero irreversible capacity during the initial cycle, very small voltage fade upon long cycling, with low
30
voltage hysteresis and fast kinetics, which contrasts positively with respect to their Li-rich NMC oxide
31
analogues. Our study, further complemented with DFT calculations, demonstrates that moving from oxygen
32
to sulfur as the ligand is an adequate strategy to partially mitigate the practical bottlenecks affecting anionic
33
redox, although with an expected penalty in cell voltage. Altogether the present findings provide chemical
34
clues on improving the holistic performance of anionic redox electrodes via ligand tuning, and hence
35
strengthen the feasibility to ultimately capitalize on the energy benefits of oxygen redox.
2
Introduction
37
Over the past three decades, Li-ion batteries (LIB) have revolutionized the portable electronics 38
industry, while more recently reorienting the automotive industry by enabling electric vehicles.1,2 To comply
39
with the ever-growing demands of energy for such applications, increasing the energy density of LIBs has 40
become a formidable challenge. For many years, the cathode materials in LIBs relied solely on the transition 41
metal (cationic) redox, until the recently discovered anionic redox, i.e., electrochemical participation of the 42
oxygen ligands, became a new approach for designing higher energy cathode materials. Li-rich Mn-based 43
layered oxides, for example, Li1.2Ni0.2Mn0.6O2 and Li1.2Ni0.13Mn0.54Co0.13O2 (Li-rich NMC) hold the highest
44
promises in this regard, as these cathodes can deliver a specific energy approaching ~1000 Wh·kg–1 at the 45
material-level. These materials can potentially replace the currently used NMCs (e.g. LiNi0.6Mn0.2Co0.2O2,
46
~700 Wh·kg–1). Thanks to a decade of intense research, it is now well established that the anomalous extra 47
capacity of Li-rich cathodes arises from the redox of O2– anions, more specifically the ‘non-bonding’ O 2p
48
orbitals that point towards excess-Li in the metal layers.3–8 Invigorated by this fundamental understanding,
49
solid-state chemists have extended the concept of oxygen redox to cation-disordered Li1+yM1−yO2 (M = Nb,
50
Mn, Ti, Fe, V …) as well as Na-based layered oxides.9–11 Despite this rich materials design-space, certain
51
practical issues, such as voltage fade, poor kinetics, voltage hysteresis, and irreversible O2 loss, have delayed
52
the commercialization of Li-rich NMCs.12 Although the crucial role of oxygen redox towards these issues
53
was clearly highlighted by detailed investigations on a ‘practical’ Li-rich NMC and also on a ‘model’ 54
Li1.33Ru0.5Sn0.17O2 electrode, much remains to be understood for further fundamental insights that will
55
ultimately lead to implementable solutions.12–14 Therefore, time has come to reinject the Li-rich systems
56
with a fresh perspective towards the above-mentioned practical roadblocks observed in oxides. So far, only 57
two materials-composition parameters were explored in Li-rich layered oxides, i.e. (i) going down from 3d 58
Mn to 4d Ru and 5d Ir for stabilizing oxygen redox and (ii) increasing the Li-rich character to access higher 59
capacity (e.g. Li3IrO4).15–17 More recently, a third approach with mild success has emerged, that is to tune
60
the ligand by increasing electronegativity of the anionic sublattice via substituting fluorine for oxygen, but 61
so far limited only to disordered rocksalt structures.18,19 Herein, we decided to explore a fourth direction by
62
replacing the ligand oxygen with sulfur to design new Li-rich layered sulfides. Because sulfur is larger, 63
softer and less electronegative compared to oxygen, anionic redox in sulfides can be expected to behave 64
differently and possibly provide clues towards better performances. 65
Early sulfide electrodes, although long forgotten after the emergence of layered oxide cathodes, 66
played a crucial historical role. To recall, the path towards modern Li-ion technology was paved by attempts 67
of commercialization of Li-free layered transition-metal chalcogenides, such as TiS2, MoS2 etc., way back
68
in the 1970s, which was rapidly terminated because of safety issues due to Li-metal dendrite formation.20,21
69
Interestingly, unlike oxides, stable ligand-hole chemistry was well-known in sulfides, e.g., TiS3 (believed
70
to exist as Ti4+S2–(S
2)2–), Fe2+(S2)2–, etc., since the pioneering works by Rouxel et al.22,23 In such materials,
71
S exists fully or partially as dimerized S–—S– pairs and undergoes breaking of S—S bonds to regain the 72
standard S2– state upon electrochemical insertion of Li.24–29 However, Li (de)intercalation is only partly
73
reversible in such materials besides rapid capacity fading.30–32 Further studying the poly-sulfides such as
74
TiS4 and VS4, mainly for their conversion-type mechanism leading to large capacities at low potential,
75
researchers have noted that such compounds were also enlisting sulfur redox activity.33–37 Similarly, by
76
reinvestigating the crystalline LiMS2 (M = Ti, V, Cr, Fe) layered sulfides directly prepared from solid-state
77
reactions, scientists also found that in some of these phases, both Li removal and insertion are possible, but 78
it remains unclear whether the process involves anionic besides cationic redox activity.38–40 Thus,
3
deciphering the sulfur redox process in such compounds could be of paramount importance to further 80
understand the oxygen redox in Li-rich layered oxides. 81
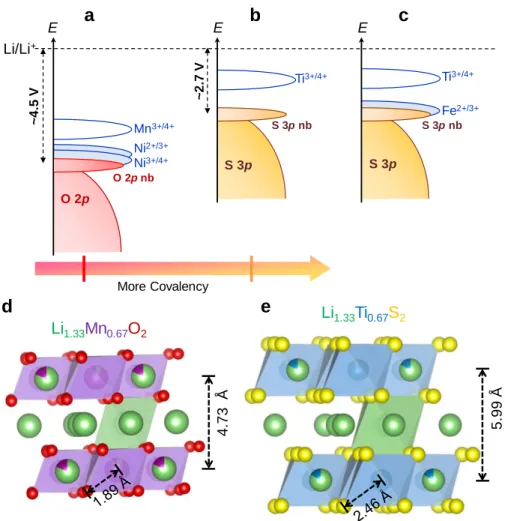
Li-rich NMCs are derived from the layered Li1.33Mn0.67O2 (commonly written as Li2MnO3) with
82
their anionic redox activity being a function of the competition between U (d-d coulomb interaction) and 83
(charge transfer) terms.41 Preparing a similar Li-rich Mn-based layered sulfide is not possible, simply
84
because the S 3p band is situated much closer to the Li/Li+ reference than the O 2p band, leaving the Mn3+/4+
85
redox band too low-lying, see Figure 1a,b. Hence to design an analogous layered sulfide Li1.33M0.67S2, an
86
appropriate transition metal M needs to be chosen first. Amongst 3d metals, M = Ti4+presents the best
87
choice for sulfides, because the Ti3+/4+ redox band is located above the S 3p band. However, since Ti4+ has
88
3d0 electronic configuration, Li
1.33Ti0.66S2 is apparently electrochemically inactive, as shown recently, even
89
though it has a high theoretical capacity of 339 mAh·g–1 (considering removal of all Li’s).42 This situation
90
reminds that of the Li1.33Mn0.67O2 phase (poor electrochemical performance without nano-sizing) that
91
required partial substitution with Ni2+ to instigate electrochemical activity (Figure 1a).43–45 A first hint to
92
address this problem in sulfides consists, as discussed by Li et al., in using Co2+ as a substituent (owing to
93
its large U and small ) to initiate reversible anionic redox.42 Pursuing their idea, the authors succeeded in
94
preparing Li1.2Ti0.6Co0.2S2 showing anionic redox activity.42 Other successful strategies to adjust proper band
95
positioning have consisted in either preparing Ti3+-doped Li
1.33-y/3Ti4+0.67–2y/3Ti3+yS2, or triggering antisite
96
occupation as shown for NaCr3+S
2, or preparing Li1.33Ti4+0.67S2 and Li1.5Nb5+0.5S2 having disordered
rock-97
salt structures.46–49 We herein demonstrate the feasibility to activate the anionic redox activity in Li-rich
98
layered Li1.33–2y/3Ti4+0.67–y/3Fe2+yS2 via the use of Fe substitution. This situation is favourable for reversible
99
sulfur redox, since the Fe2+/3+ redox couple with available electrons (3d6) is expected to be pinned at the top
100
of the S 3p band (Figure 1c).38 We isolate the Li
1.13Ti0.57Fe0.3S2 compound showing, based on cumulated
101
cationic and anionic redox activity, a sustained reversible capacity of ~245 mAh·g–1 at an average voltage 102
of ~2.5 V, hence leading to a specific energy of ~600 Wh·kg–1 that compares favorably with LiCoO2.
103
Moreover, we demonstrate the advantages of choosing a softer ligand in partially mitigating both voltage 104
fade and hysteresis without any compromise in kinetics, hence providing confidence about the feasibility of 105
better capitalizing on the benefits of the anionic redox. 106
4 107
Figure 1. Moving from Li-rich layered oxides to sulfides. Schematic band structure of Ni2+ substituted Li
1.33Mn0.67O2
108
(a) and Li1.33Ti0.67S2 (b) and its Fe2+ substituted derivative (c). The relative band positions areestimated based on Ref
109
3,38. The label nb stands for non-bonding. The crystal structures of Li
1.33Mn0.67O2 (d, adapted from the Ref 50) and
110
Li1.33Ti0.67S2 (e, this work), indicating the layer gap and the average metal-ligand bond distance.
111 112
Results
113
Nominal compositions of Li1.33–2y/3Ti0.67–y/3FeyS2, with y = 0 - 0.5, were prepared by reacting Li2S,
114
TiS2 and FeS in stoichiometric amounts in vacuum-sealed quartz tubes at 750 °C (see the Experimental
115
Section for details). The X-ray diffraction (XRD) patterns are gathered in Figure S1a for all the 116
compositions. The XRD pattern of the unsubstituted Li1.33Ti0.67S2 (without Fe, y = 0) phase could be refined
117
in the in C2/m space group alike for Li1.33Mn0.67O2. The Rietveld refinement of its synchrotron XRD (SXRD)
118
pattern is shown in Figure S1b with the obtained parameters summarized in Table S1. This crystal structure 119
is similar to honeycomb-ordered Li-rich layered oxides, however with an expectedly larger unit cell to 120
accommodate the bulkier S atoms, see Figure 1d,e. Upon increasing the Fe content y, there is a progressive 121
shift of the Bragg peaks (Figure 2a) indicating the existence of a solid solution. Moreover, Fe-containing 122
compositions (y = 0.1 - 0.5) do not show the superstructure peaks (Figure S1a), most likely because Fe2+
123
disrupts the honeycomb Li+/Ti4+ ordering. Therefore, the Fe-containing phases could be fitted in a hexagonal
124 O 2p Mn3+/4+ Li/Li+ S 3p Ti3+/4+ Fe2+/3+ ~ 4 .5 V ~2 .7 V More Covalency E Ni2+/3+ E 4 .7 3 Å 5 .9 9 Å S 3p Ti3+/4+ E Li1.33Mn0.67O2 Li1.33Ti0.67S2
a
b
c
d
e
O 2p nb S 3p nb S 3p nb Ni3+/4+5
R3̅m description analogous to the well-known Li-rich layered Li1+yM1–yO2 phases, with the obtained lattice
125
parameters shown in Figure 2b. With increasing Fe content, we observe a monotonic increase in the c 126
parameter that is accompanied by a decrease in the a parameter, such that the overall effect is a monotonic 127
decrease in unit cell volume (V). Since among the Li1.33–2y/3Ti0.67–y/3FeyS2 series, the compound with y = 0.3
128
will be the center of interest in this study, we also performed the Rietveld refinement of its SXRD pattern 129
(Figure 2c), which confirms that Fe, Ti and Lioccupy same site in the metal layer (see the structural model 130
in Table S2). This structure was further confirmed by Rietveld refinement of its neutron powder diffraction 131
(NPD) pattern (see Figure S5a). 132
133
Figure 2. Structural behavior of the Li1.33–2y/3Ti0.67–y/3FeyS2 series. (a) SXRD patterns and (b) variation of lattice 134
parameters (obtained from the Rietveld refinement of the SXRD patterns). In (b), for the y = 0 composition, the lattice
135
parameters have been converted to the R𝟑̅m description. (c) Rietveld refinement of the SXRD pattern of the
136
Li1.13Ti0.57Fe0.3S2 sample. The red circles, black continuous line, blue line, and green tick bars represent the observed,
137
calculated and difference patterns, and Bragg positions, respectively. Note that minor Li2TiO3 impurity (indicated with
138
*) was detected in the SXRD pattern, probably due to minor air-leakage during the preparation of the sample-capillary
139
prior to the acquisition of SXRD patterns.
6
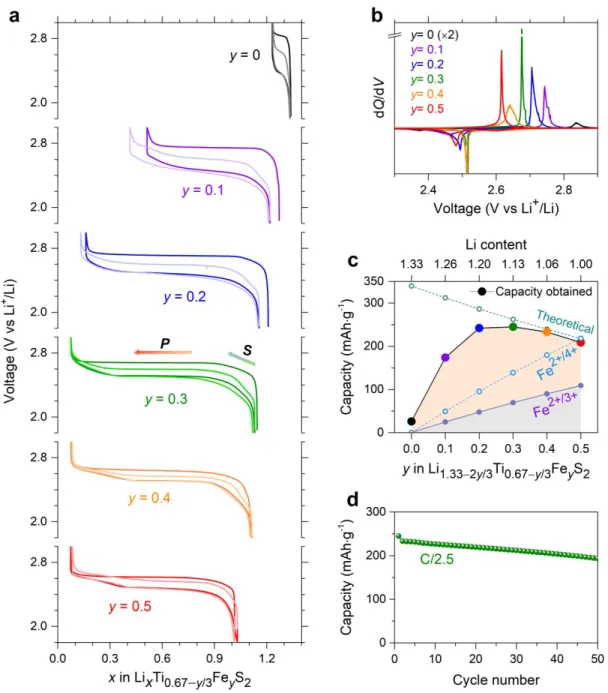
The electrochemical performances of the Li1.33–2y/3Ti0.67–y/3FeyS2 samples were tested in Li-half cells
141
between 1.8 V and 3 V at a rate of C/20 and the voltage profiles are summarized in Figure 3a and S2a. The 142
unsubstituted Li1.33Ti0.67S2 (y = 0) shows very poor electrochemical activity sinceonly 0.1 Li could be
143
extracted reversibly. Attempts to enhance the activity by either ball milling the samples or by adding larger 144
amounts of carbon additive were unsuccessful, hence leading us to conclude that such a non-activity is 145
intrinsic to the phase and most likely nested in the fact that the Ti3+/4+ redox band is empty and is situated
146
far above the S 3p band, hence unable to stabilize oxidized sulfur (Figure 1b). This contrasts with the Fe2+
-147
containing phases (Figure 1c) that are electrochemically active, which show a specificity that is nested in 148
the second cycle’s charge trace which mismatches the first one because it occurs at a lower potential (Figure 149
3a). Note also the appearance of a short sloped voltage (marked by ‘S’ in Figure 3a) at the early stage of 150
charge, and most likely related to Fe redox activity. This contrasts with a long plateau-like (marked by ‘P’) 151
activity on further oxidation. Lastly, the corresponding dQ/dV profiles are shown in Figure 3b and S2c, 152
which clearly highlights that the respective oxidation potentials shift to lower voltage with a systematic 153
decrease in hysteresis (Figure S2e) upon increasing the Fe content. After the first cycle, note that the 154
subsequent charge and discharge profiles are very similar (see Figure S2b for Li1.13Ti0.57Fe0.3S2) with the
155
polarization gradually reducing to ~100 mV for the y = 0.3 composition, instead of ~220 mV during the first 156
cycle. This indicates that the first cycle acts as an ‘activation’ cycle alike the Li-rich NMC oxides. The 157
variation of capacity as a function of the Fe-content shows a bell-shape type behaviour which peaks at 245 158
mAh·g–1 for the composition Li1.13Ti0.57Fe0.3S2 (y = 0.3). Even by assuming full utilization of the
multi-159
electron oxidation of Fe2+ to Fe4+, which is quite unlikely to occur in sulfide frameworks, we cannot account
160
for all the measured capacity, hence implying the activity of the anionic network, see Figure 3c. The capacity 161
decrease beyond y > 0.3 is simply due to the lower amount of available Li in the Li1.33–2y/3Ti0.67–y/3FeyS2
162
samples when the Fe content (y) increases. In contrast the raise noted until y = 0.3 is most likely nested in 163
the gradual amelioration of the band positioning with introduction of Fe content that triggers reversible 164
anionic redox activity. Among the various Fe compositions studied, the y = 0.3 sample not only shows the 165
largest capacity, but also a respectable capacity retention (Figure 3d and S2d) with also barely noticeable 166
irreversible capacity in the first discharge. Thus, we chose this composition for further investigation, starting 167
by exploring whether the activation process over the first cycle is related to structural aspects. 168
7 169
Figure 3. Electrochemical behavior of Li1.33–2y/3Ti0.67–y/3FeyS2. (a) Voltage profiles of the compositions obtained over 170
cycling vs Li at C/20 for the first two cycles. The curves in lighter colors denote the second cycles. The arrows marked
171
by ‘S’ and ‘P’ denote the slope and the plateau, respectively. (b) dQ/dV curves obtained in the first cycle for the
172
various compositions. (c) Theoretical capacity (considering total Li-removal) and the actual discharge capacity
173
obtained for the compounds over cycling at C/20. The capacity expected from cationic Fe2+/3+ and hypothetical Fe2+/4+
174
redox is also shown. (d) Cycling performance of a Li1.13Ti0.57Fe0.3S2/Li half-cell at a rate of C/2.5 (except the first
175
formation cycle at C/20). The material was cycled as powder (mixed with 20 wt% C, see Figure S2d inset) in a Swagelok
176
type cell, without any further optimization.
8
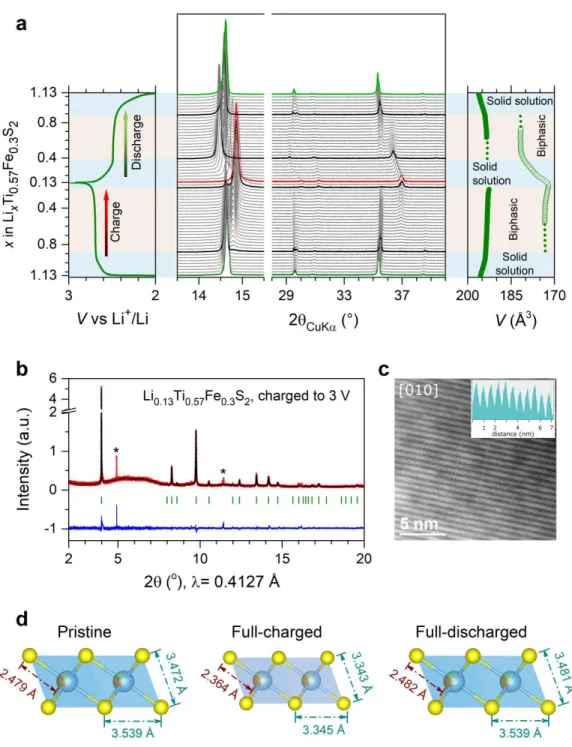
To better understand the structural evolution pertaining to the Li1.13Ti0.57Fe0.3S2 phase during the Li
178
uptake-removal process, operando XRD measurements were conducted and XRD patterns were collected 179
for every change in lithium stoichiometry of ~0.1 (Fig. 4). Upon charge,we observed a slight initial shift of 180
the main peaks, indicating solid-solution behaviour. Over this regime, the unit cell volume decreases as a 181
consequence of an anisotropic variation of the a and c lattice parameters (see also, Figure S3a). Then, as the 182
voltage reaches the first plateau, there is a gradual change in the intensity of the peaks with some peaks 183
disappearing at the expense of new ones, which sharpen to give a well-defined XRD powder pattern at the 184
end of the full charge, hence suggesting a two-phase de-intercalation process. This new phase with 185
approximate composition Li0.13Ti0.57Fe0.3S2, whose structure remains as layered one as described in detail in
186
the next paragraph, has a lower unit cell volume (by ~12.2%) than the pristine one. On discharge, the 187
compound undergoes first a solid-solution process for which both the a and c lattice parameters strongly 188
increase (Figure S3a). Then, a biphasic process is observed with the growth of a phase with increased 189
volume, followed again by solid-solution behaviour. We therefore have, for the first cycle, charge and 190
discharge processes that proceed through different structural paths, even though the pattern returns close to 191
the one for the pristine phase (see Figure S3b). This path-difference can be clearly observed from the 192
evolution of the unit cell volume (Figure 4a) and of the a and c lattice parameters (see Figure S3a). On the 193
other hand, over the 2nd cycle, the XRD patterns indicate more symmetric, although not perfect, pathways
194
on charge and discharge (Figure S4). Overall, throughout cycling the phase remains crystalline with well-195
preserved long-range layered crystal structure. 196
Next, an in-depth exploration of the crystal structures at different states of charge (pristine, fully-197
charged and fully-discharged after first cycle) was undertaken using SXRD. In agreement with the lab XRD 198
data, the patterns can be indexed in the R3̅m space group. The pristine Li1.13Ti0.57Fe0.3S2 (V = 196.384(2) Å3)
199
presents an average Ti–S bond-length of 2.4792(3) Å, with average S–S distances of ~3.505 Å (see the 200
structural model in Table S2). The Rietveld refinement of the SXRD pattern of the fully-charged 201
Li0.13Ti0.57Fe0.3S2 phase (Figure 4b) indicates a much smaller unit cell (V = 172.338(6) Å3) (see Table S3 for
202
the structural model). Moreover the average Ti–S bond length was found to shrink to 2.3635(1) Å, leading 203
to decreased average S–S distances of ~3.344 Å. 204
In parallel, we collected the selected-area electron diffraction (SAED) of the fully-charged phase 205
which could again be successfully indexed with an R3̅m unit cell (Figure S5b). The corresponding high 206
angle annular dark field scanning transmission electron microscopy (HAADF-STEM) image shows only 207
the (Ti/Fe)S2 layers. The HAADF intensity profile (inset, Figure 4c) clearly demonstrates no scattering
208
density between the (Ti/Fe)S2 layers and thus discards the possibility of transition-metal migration to the
209
interlayer sites (Figure 4c). The Rietveld refinement of SXRD pattern (Figure S5c, Table S4) of the fully-210
discharged sample is very similar to the pristine phase (V= 196.896(2) Å3) with an average Ti–S bond length
211
of 2.4825(3) Å and average S–S distance of 3.51(2) Å. Worth mentioning is that such S–S distances are 212
quite larger than the (S–S)2– bond lengths reported early on for TiS
3 (2.04 Å) (Figure 4d) suggesting either
213
an absence of complete dimerization in Li0.13Ti0.57Fe0.3S2 or a possible error in the reported TiS3 structure.51
214
Further investigations focusing specifically on the local structure of such sulfide compounds are hence 215
planned. 216
9 217
Figure 4. Structural evolution upon Li (de)intercalation. (a) Evolution of the in situ XRD patterns in the first cycle of a 218
Li1.13Ti0.57Fe0.3S2 /Li half-cell at a rate of C/20. The left panel shows the corresponding voltage profile and the right panel shows
219
the evolution of the unit cell volume (V), as obtained from the Rietveld refinements of the XRD patterns. Note that the dotted
220
lines represent extrapolations, where the XRD patterns could not be refined because of poor intensity of the peaks. (b-c) Rietveld
221
refinement of the SXRD patterns (b) and the HAADF-STEM image (c) of the full-charged phase. The peaks denoted by * in (b) show
222
minor Li2TiO3 impurity. The inset in (c) shows the HAADF intensity profile. (d) The bond-lengths observed in the pristine,
full-223
charged and full-discharged phase (as obtained from the Rietveld refinement of the corresponding SXRD patterns).
10
To grasp some insights on the charge compensation mechanism, the cationic Fe2+/3+ redox process
225
was probed by operando Mössbauer spectroscopy using an electrochemical cell designed in-house.52
226
Spectra were collected while charging and discharging a Li1.13Ti0.57Fe0.3S2/Li cell at a rate of C/70 (Figure
227
5).The Mössbauer spectra for pristine Li1.13Ti0.57Fe0.3S2,that can neatly be fitted with four doublets (see
228
Table S5), highlights the presence of a distribution of high-spin (HS) Fe2+, as already encountered for FeS
229
and various other iron (II)-based sulfides.53,54 The necessity of four doublets is simply due to different local
230
arrangements of intermixed Ti/Li/Fe cations around a given Fe site. The evolution of the spectra obtained 231
during in situ cycling is shown as a contour plot in Figure 5b, with the spectra analyzed using principal 232
component analysis (PCA), as described in Supplementary Note S1. All measured spectra could be 233
adequately fitted as linear-combinations of three reconstructed spectral components. As expected, the first 234
component (Comp. 1) is identical to the pristine material’s spectrum. The Comp. 2 can be fitted using at 235
least two doublets, see Figure 4a and Table S5. The major one (90%) has an isomer shift of 0.48 mm/s 236
which stands between what is expected for HS Fe2+ and HS Fe3+, alike what has been seen in Fe
3S4 and
237
FeV2S4.53 The second doublet with a 10 % contribution to the overall spectrum is indicative of the HS-Fe3+
238
signature, as seen in NaFeS2.53 Overall, the average oxidation state of Comp. 2 is higher than Fe2+ but not
239
fully reaching Fe3+. Note that Comp. 2 reaches its maximum around x
Li = ~0.93, just before the voltage
240
plateau. During the plateau, the Comp. 2 converts progressively to the Comp. 3 (fully-charged, 3 V), as 241
shown in Figure 4c, in which can be fitted as low-spin Fe3+ state in agreement with previous reports (Figure
242
4a and Table S5).40 On discharge, the evolution of the components is reversed, except for a much lower
243
contribution from the Comp. 2 (Figure 4a). This is fully consistent with the path dependence observed above 244
with XRD. Overall, these data indicate the progressive oxidation of Fe2+ to Fe3+ on charge and its full
245
reduction back to Fe2+ on discharge.
246
Furthermore, Fe L2,3-edge X-ray absorption near edge structure (XANES) spectra were taken to
247
confirm the participation of Fe and are shown in Figure S6b. The spectra for the pristine material is similar 248
to that of FeS confirming the presence of Fe2+.55,56 It enlists two main peaks corresponding to 2p
3/2 → 3d
249
(L3) and 2p1/2 → 3d (L2) transitions. These peaks shift to higher energy upon charge indicating gradual
250
conversion to Fe3+. After discharge, the Fe L
2,3 edge is restored completely. The position and shifts of the
251
Fe L2,3-edge observed upon oxidation are consistent with observations of S-containing species with Fe2+ and
252
Fe3+ in literature,57 indicating consistency with conclusions from Mössbauer spectroscopy. The Ti L
2,3-edge
253
XANES spectra were also recorded for the aforementioned samples (Figure S6c). As expected, the spectrum 254
for pristine Li1.13Ti0.57Fe0.3S2 is identical to that of Ti4+S2, confirming the formal oxidation state of Ti as 4+.58
255
Moreover, no changes in the position of L2 and L3 peaks could be observed, irrespective of the sample state
256
of charge, hence indicating the invariance of Ti4+ throughout the charge/discharge cycle.58
11 258
Figure 5. Spectroscopic characterizations to identify the redox processes. (a) Typical Mössbauer spectra and their deconvolution 259
for the pristine (comp. 1), comp. 2, comp. 3 (fully charged) and the fully-discharged product. (b) Contour plot of evolution of the
260
Mössbauer spectra collected during in situ cycling of a Li1.13Ti0.57Fe0.3S2/Li half-cell at a rate of C/70. For reference the voltage
261
profile is shown in the top panel. The lowest panel shows the evolution of the reconstructed components during the cycling. (c-f)
262
The EELS spectra of the S L-edge (d), mRIXS of the S L-edge with integrated PFY spectra on the bottom (e) and S K-edge XANES
263
spectra (f) collected ex situ on the pristine (black curves), partially-charged (2.66 V, only EELS, orange curve), fully-charged (3 V,
264
red curves) and fully-discharged phase (green curve) as shown in the voltage profile in (c).
12
To check the electrochemical activity of S within the Li1.13Ti0.57Fe0.3S2 phaseduring the Li uptake
266
and removal process, ex situ electron energy loss spectroscopy (EELS) spectra at the S L2,3 edge were
267
collected (Figure 5d) for pristine, partially-charged (2.66 V, after removing ~0.16 Li), fully-charged (3 V) 268
and fully-discharged (1.8 V) samples. The spectra consist of a weak pre-edge and an intense broad edge 269
feature that correspond to a series of transitions from the S 2p core levels to unoccupied states.59 The S L 2,3
270
edge for the pristine material is similar to that of FeS indicating the predominance of S2– state (Figure 5d
271
and S7a).59 It remains nearly alike for the partially charged sample (at 2.66 V) with the exception of minor
272
alterations that could be ascribed to a probable decrease of the Ti/Fe–S bond covalency. In contrast, for the 273
fully-charged sample (at 3 V), the S L2,3 rising-edge shifts by ~1.6 eV towards higher energies and this is
274
indicative of a partial oxidation of S2–.55 However the S L
2,3 pre-edge does not show the typical peak splitting
275
seen in pyrite-FeS2 or elemental S0 (Figure S7b).56 Lastly, it is worth mentioning that the initial shape as
276
well as the energy of the rising-edge of the S L2,3 edge are fully recovered towards the end of the discharge,
277
further indicative of the reversibility of the sulfur redox process. 278
279
To complement the EELS data that were collected locally on individual electrode particles (see 280
Methods), we further probed the S L-edge by soft X-ray absorption spectroscopy (sXAS) performed in 281
fluorescence mode which provides bulk-sensitive information about sulfur redox activity. However, direct 282
measurements of the electrodes on the S L-edge through conventional sXAS turned out to be challenging, 283
because of interfering background signals from the carbon present in the electrodes which contributes an 284
overwhelming background through 2nd order harmonic around 140 eV, right below the S-L signals around 285
160 eV (Figure S7c,d). We could successfully distinguish the S signals from the strong C background, by 286
employing high-efficiency mapping of resonant inelastic X-ray scattering (mRIXS), see Methods and Figure 287
S7e for details. This advanced technique, which has emerged as a seminal technique for detecting oxygen 288
redox, further resolves the emitted photon energy, called emission energy, after each sXAS excitation 289
process.60 Figure 5e displays these S-L mRIXS signals collected from the pristine, charged, and
fully-290
discharged electrodes. The integration of all the signals within the emission energy range (142 - 151 eV) 291
provides the partial fluorescence yield (PFY) signals of the clean S-L sXAS, as summarized in the bottom 292
panel. The pristine Li1.13Ti0.57Fe0.3S2 without carbon additive displays the strongest S-L features. The
293
relatively sharp features in mRIXS at 163 and 164.1 eV excitation energies correspond well with the pre-294
edge peaks observed in EELS. The sharp features suggest these are dominated by the localized TM 3d 295
character that is hybridized with S orbitals.59 At higher excitation energy, the continuous band-like feature
296
corresponds to the intrinsic sulfur states hybridized with TM 4s/4p orbitals. It is clear that the leading edge 297
of these sulfur band-like feature shifts towards high energy for over 1.2 eV in the full charged phase, in 298
complete agreement with EELS and indicating the oxidation of sulfur states. Furthermore, the leading edge 299
position completely recovers after discharge, suggesting a reversible redox reaction of the sulfur. 300
301
S K-edge XANES spectra were equally collected for the aforementioned samples (except partially 302
charged) and they are reported in Figure 5e. The spectrum presents two main regions. The pre-edge feature, 303
below 2471 eV, arises generally from unoccupied S 3p/TM 3d hybridized states. Their position and intensity 304
depend on their occupancy, the relative contribution of S and TM, and their position with respect to the core 305
level, thus being a general measure of covalence of the TM-S bond.61 Above this energy, the signals
306
correspond to transitions to higher states, such as S 3p/TM 4s, p or those involving S 4p, and the 307
photoionization of S atoms, involving complete ejection of the core electron to the continuum. Therefore, 308
the position of the absorption threshold is strongly dependent on the effective nuclear charge (Zeff) on S,61
13
being a measure of redox transitions at the ligands. The spectra for pristine Li1.13Ti0.57Fe0.3S2 consists in a
310
weak pre-edge at ~2465 eV (denoted as A) and a broad edge jump (denoted as B) located at ~2472 eV 311
similar to what is observed in amorphous rocksalt Li2TiS3 and hence characteristic of S2−.48 For the fully
312
charged state (~Li0.1Ti0.57Fe0.3S2), the spectrum (red curve in Figure 5e) undergoes notable changes with an
313
increase in amplitude of the pre-edge A and a ~1.2 eV shift of the B edge towards higher energy, and bears 314
resemblance to TiS3 (dashed purple curve).62 Similarly, the opposite shift in the edge B is observed during
315
re-lithiation, as was reported for TiS3, and VS4.36,63 The 1.2 eV shift in B is therefore a clear indication of
316
the oxidation of S2− into Sn−, n < 2. Similarly, the increase in intensity of pre-edge A is indicative of the 317
increase in density of unoccupied states just above the Fermi level with an S character, in agreement with 318
the expectation that the redox change is compensated by S 3p/Fe 3d electrons. The shift of the main 319
absorption edge also suggests that this compensation, and the resulting states, have a significant S character. 320
This unambiguously confirms the participation of S in the overall electrochemical activity of 321
Li1.13Ti0.57Fe0.3S2 together with its reversibility sincethe S K-edge XANES spectra of the fully-discharged
322
and pristine samples nearly superimpose (Figure S6d). 323
To confirm the above observations S 2p core X-ray photoelectron spectroscopy (XPS) spectra 324
were also taken and are shown in Figure S6e. Clear variations of the spectra are observed upon charging-325
discharging the samples. The S 2p3/2-1/2 XPS core spectrum can be fitted with a single doublet (160.7 - 161.9
326
eV) attributable to S2– for the pristine material, as in the TiS
2 reference.64 As the sample gets oxidized, the
327
spectrum markedly changes, with namely the appearance of one extra doublet at higher binding energies 328
(161.8 - 163.0 eV), which is indicative of the presence of oxidized Sn– (n < 2), in light of early previous 329
studies on TiS3 that is well-known to contain partially oxidized sulfur.32,64 On discharge, the XPS spectrum
330
is almost restored to the pristine-like state, confirming the reversibility of the anionic redox process. 331
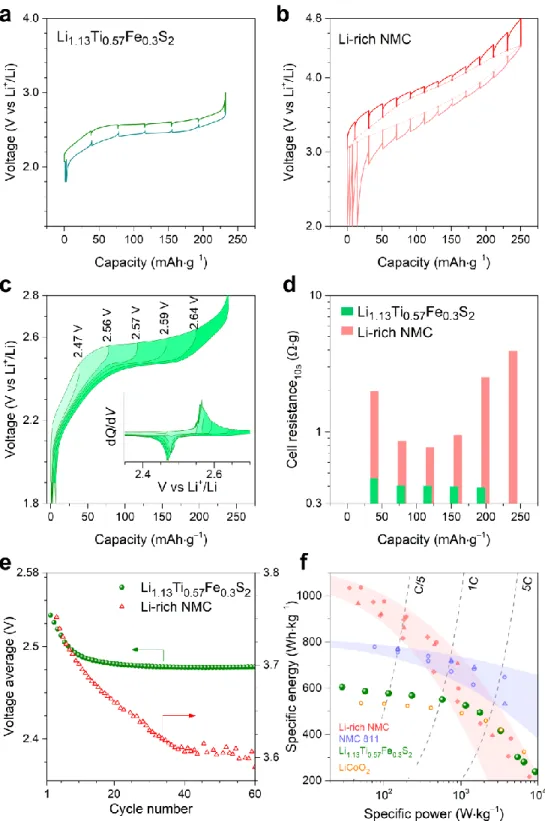
At this stage, mindful of the strong involvement of anionic redox in the charge compensation 332
mechanism of Li1.13Ti0.57Fe0.3S2, the next legitimate question pertains to the practicability of anionic redox
333
in sulfides. Using these newly designed Li-rich sulfides as model compounds, we investigated whether some 334
of the practical issues (large voltage hysteresis, sluggish kinetics and gradual voltage fade) that have so far 335
plagued the commercialization of analogous Li-rich layered oxides showing anionic redox activity12,6, still
336
persist when oxygen is replaced by sulfur. To assess the practical figures of merit in Li-rich sulfides, we 337
first performed a galvanostatic intermittent titration technique (GITT) experiment (Figure 6a) after initial 338
seven cycles to stabilize the voltage profile. Li1.13Ti0.57Fe0.3S2 shows the disappearance of voltage hysteresis
339
in the open-circuit voltage (OCV) throughout the cycle (only ~30 mV gap remains after just 30 mins of 340
relaxation). This is a significantly better scenario than in Li-rich NMC (Li1.2Ni0.13Mn0.54Co0.13O2), where a
341
severe OCV hysteresis up to 300 mV has been reported and further shown to be associated with oxygen 342
redox (Figure 6b).14 This performance is also better than the ~100 mV OCV hysteresis in 4d metal-based
343
Li2Ru0.75Sn0.25O3 and approaches the favorable hysteresis-free situation experienced in 5d metal-based
β-344
Li2IrO3.13,16 This observation clearly highlights that voltage hysteresis can be effectively mitigated by tuning
345
the ligand, and not just by choosing appropriate transition metals. The hysteresis was further studied by 346
progressive opening of voltage-windows during charge in subsequent cycles and the voltage profiles are 347
summarized in Figure 6c. Increasing the voltage cut-off does not lead to any noticeable increase in voltage 348
hysteresis. This contrasts with similar experiments on Li-rich NMC showing an onset of large hysteresis 349
upon full charging accompanied with lowering of the discharge potential around mid-SoCs (Figure S8a). 350
Furthermore, the corresponding dQ/dV curves (in the inset, Figure 6c) reveal that irrespective of upper cut-351
off of charging voltage, in discharge the oxidative capacities are mostly recovered at ~2.5 V, therefore not 352
triggering any voltage hysteresis. This is quite contrary to Li-rich NMC, where oxidative capacities obtained 353
14
from anionic redox (i.e., charging above ~4.1 V) are only recovered partially at similar voltage upon 354
discharge (down to ~4 V). Further discharge to a lower voltage (below ~3.6 V) is necessary to regain the 355
remaining capacity, as the reduction of the oxidized On− species is split between high and low voltages, 356
causing a large voltage hysteresis (Figure S8b).14
357
Concerning the next issue of kinetics, we have previously shown how oxygen redox displays 358
sluggish kinetics.13,14 Hence, to check the same in sulfides, cell resistance was deduced from the voltage
359
drop during the first 10 s of the relaxation steps of the GITT experiment (Figure 6b). As revealed for 360
Li1.13Ti0.57Fe0.3S2, the electrochemical resistance remains quite low throughout the whole cycle (Figure 6d).
361
Whereas for Li-rich NMC, the resistance is significantly larger at all SoCs and increases at low and high 362
SoCs, which corresponds to the regions involving oxygen redox.14 Furthermore, electrochemical impedance
363
spectra (EIS) were collected at different SoCs of Li1.13Ti0.57Fe0.3S2, after each relaxation step during the
364
GITT experiment and the evolution of the EIS Nyquist plots is shown in Figure S9a,b. The charge-transfer 365
resistance, located in the mid-frequency regime of the spectra (characteristic frequency around 10 to 1 Hz), 366
remains very small and nearly constant throughout the cycle, irrespective of whether it is cationic or anionic 367
redox regime, as opposed to Li-rich oxides where the resistance builds up drastically with deeper oxidation 368
of oxygen.12,14 This clearly highlights the positive attribute of Li-rich sulfides concerning kinetics. The fast
369
kinetics was further confirmed with Li1Ti0.5Fe0.5S2 (y = 0.5) composition, which shows similar charge
370
transfer resistance and consequently similar cycling and rate performance (Figure S9c,d), despite having a 371
higher proportion of cationic redox capacity. Lastly, regarding the critical issue of voltage fade, we found 372
that it still afflicts Li-rich sulfides, though to a much lower extent, as shown in Figure 6e. The voltage fade 373
for Li1.13Ti0.57Fe0.3S2 can be divided in two regimes, starting first with a well-pronounced decrease from 2nd
374
cycle to the 7th (a drop of ~35 mV) followed by a stabilization afterwards to reach an overall drop of ~40
375
mV after 60 cycles (the maximum we have cycled). This again positively contrasts with Li-rich NMC that 376
shows a nearly continuous voltage fade upon cycling with an accumulated drop of ~150 mV after 60 cycles. 377
Overall, moving from oxygen to sulfur as the ligand turns out to be a correct strategy to partially mitigate 378
the practical bottlenecks of anionic redox. However, we need to keep in mind that this comes at the expense 379
of the overall energy density (Figure 6f) because of lower potential and higher molecular weight of sulfur. 380
A compromise could consist in combining the energy advantage of oxygen redox with the practicability of 381
sulfur redox. This task is not trivial bearing in mind the experienced difficulty in preparing 3d-metal-based 382
oxysulfides. 383
15 384
Figure 6. Li-rich layered sulfide as a model material to study the practicability of anionic redox. (a) Voltage profile of 385
Li1.13Ti0.57Fe0.3S2 in a two-electrode cell in the 8th cycle, recorded with a GITT protocol (C/5 rate with 30 min rests for equilibration).
386
(b) Voltage profile of Li-rich NMC (Li1.2Ni0.13Mn0.54Co0.13O2) in a three-electrode cell in the 4th cycle, recorded with a GITT protocol
387
(40 mA·g−1 pulses with 4 h rests for equilibration). (c) Voltage profiles obtained from the charge-window opening experiment
388
(starting from 8th cycle). Inset shows the corresponding dQ/dV profiles. (d) Cell’s electrochemical resistance (during charging)
389
estimated simply by Ohm’s law from the voltage drop in first 10 s of rest from the previous GITT experiment in (a). (e) Average
390
voltage during long cycling of Li1.13Ti0.57Fe0.3S2 and Li-rich NMC in Li-half cells. In each cycle, the average voltage is defined as the
16
mean of the average charge and discharge voltages that and was calculated by dividing the energy with the capacity obtained. (f)
392
Ragone plots of Li1.13Ti0.57Fe0.3S2 and comparison with Li-rich NMC and Li-stoichiometric NMC (LiNi0.8Mn0.1Co0.1O2). Only values at
393
material-level are considered and values for the NMC-811 and the Li-rich NMC are adapted from Reference12. LiCoO2 is also
394
included in the comparison and the Li-rich layered sulfide appears at par with it.
395
Discussion 396
We have shown the feasibility, by partially substituting Ti4+/Li+ belonging in the metal layers of
397
Li1.33Ti0.67S3 (commonly written Li2TiS3) with Fe2+, to produce Li1.33–2y/3Ti0.67–y/3FeyS2 phases showing
398
electrochemical activity due to cumulated cationic (Fe2+/3+) and anionic (S2– / Sn–, n ˂ 2) redox processes.
399
Alike the Li-rich layered oxides having d0 metals (Li
2TiO3, etc…), we found the feasibility to trigger Li
400
electrochemical activity in Li-rich layered sulfides having d0 metals by the injection of metal substituents.
401
This does not come as a total surprise as such metal substitution modifies the U over competition, so that 402
it falls within the domain to trigger reversible anionic redox activity as established from theoretical 403
calculations.41 The anionic redox activity upon oxidation was spectroscopically confirmed in
404
Li1.13Ti0.57Fe0.3S2 via clear energy shifts in the S L2,3-edge EELS and XANES spectra as well as the onset of
405
a doublet signal in the S 2p3/2-1/2 XPS core spectra. Structure-wise on the other hand, our XRD and EELS
406
evidence did not suggest the local formation of very short S–S dimers (like in pyrites), but more 407
investigations focusing on the local structure are needed to unequivocally rule this out. For comparing with 408
oxides, let’s recall that the XPS fingerprint of anionic redox activity in oxides was also the appearance of a 409
new component at slightly higher binding energy (531.5 eV) in the O 1s XPS core spectra that we assigned 410
to On– (n ˂ 2).14–16 Interestingly, the binding energy of this component was independent of the structure and
411
composition as seen in various Li-rich oxides that show anionic redox activity, with or without evidences 412
of O–O shortening. This observation indicates that although XPS features have been widely used as the 413
spectroscopic signature of the anionic redox activity in various materials, caution has to be exercised when 414
interpreting XPS spectra. 415
Besides, we found that Li1.13Ti0.57Fe0.3S2 can deliver capacities as high as 245 mAh·g–1 with a
near-416
zero irreversible capacity during the first cycle as compared to ~0.2 Li for Li-rich 3d metal-based oxides 417
(Figure S8c,d). This is consistent not only with the absence of cationic migration in sulfides, in contrast to 418
some of the analogous oxides, but also with less severe changes observed between the first charge-discharge 419
voltage profiles in Li1.13Ti0.57Fe0.3S2 as opposed to Li-rich NMCs that show a staircase charging curve
420
drastically changing to a S-shaped discharging curve. Lastly, part of the initial irreversibility in oxides is 421
associated to a small amount of oxygen release from the surface, either directly as O2 gas or indirectly by
422
reacting with the electrolyte.3,65 This is quite unlikely to occur with S which is a softer element as compared
423
to O, therefore showing less reactivity and greater stability for the same degree of electrochemical oxidation. 424
We noted in the dQ/dV profile (recall Figure 3b) a systematic shift to lower potentials of the peaks 425
corresponding to concomitant cationic and anionic redox processes with increasing Fe-content in Li1.33–
426
2y/3Ti0.67–y/3FeyS2, while for instance the position of the peaks was found to remain independent of Sn
427
substitution in the Li2Ru1–ySnyO3 series showing well-decoupled cationic and anionic redox.15 To understand
428
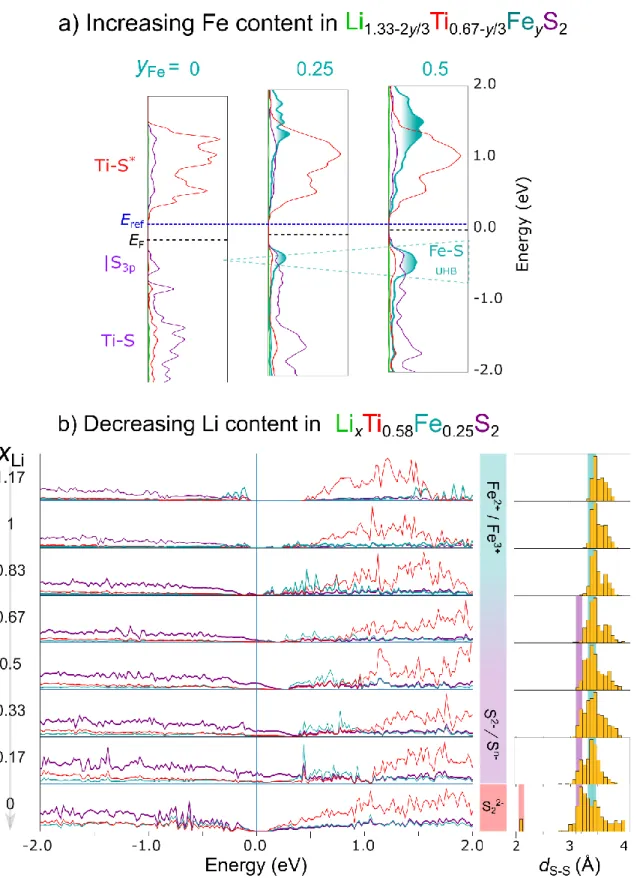
this behaviour, we calculated the spin-projected density of states (pDOS) for y = 0, 0.25 and 0.5(these 429
compositions were chosen for ease of computation, see Methods) and plotted in Figure 7a. The electronic 430
structure of the parent Li1.33Ti0.67S2 displays a charge transfer gap between the empty Ti d band (in red), split
431
by the crystal field, and the S band (in purple) formed of non-bonding S 3p states (denoted as |S3p) that lies
432
above the Ti−S bonding states. Fe2+ substitution leads to the introduction of a partially filled d band (having
433
six electrons), which is split by d-d Coulomb repulsion (introduced by a correction term U = 1.9 eV) into a 434
deep-lying Lower Hubbard band (LHB), with five spin-up electrons, and an Upper Hubbard Band (UHB) 435
17
with one spin-down electron. This is consistent with the experimentally observed HS Fe2+from Mössbauer
436
spectroscopy. The occupied states of the UHB lie above the |S3p states. As the Fe content increases, the
437
number of these UHB states increases. If we take as a reference the energy (Eref) of states that are not
438
expected to be directly affected by the Fe substitution, such as either the Ti-t2g* that is close to the Fermi
439
level (Figure 7a) or the S 3s core levels that are non-bonding and very deep in energy (see Figure S10a), we 440
observe that the highest occupied states are rising in energy with Fe content as indicated by the raising of 441
the Fermi level. This explains the experimental observation of voltage decrease with gradual Fe 442
introduction. 443
Next we asked whether the experimentally observed electronic and structural changes upon Li 444
removal could be supported by monitoring the evolution of pDOS and the corresponding theoretical S–S 445
distances. This is answered by calculating the pDOS of LixTi0.58Fe0.25S2 (1.17 > xLi > 0.83) that is summarized
446
in Figure 7b. At the beginning of charge (1.17 > xLi > 0.83), the depletion of the Fe-UHB near the Fermi
447
level indicates that Fe gets oxidized, while the average S–S distance remains unaffected and thus confirming 448
that S acts as a spectator. This situation drastically changes upon further oxidation (0.83 > xLi > 0.17) where
449
the pDOS indicates the depletion of the S band near the Fermi level, which implies S undergoes partial
450
oxidation. Over this composition range, the small decrease in some of the calculated S–S distances (marked 451
in purple background in the histograms) and the progressive closing of the band gap suggests that the holes 452
are delocalized over the S network through Fe−S interaction. The participation of S to the states right above 453
the Fermi level significantly increased upon oxidation, consistent with the increase in pre-edge intensity 454
observed by S K-edge XAS (Figure 5f). 455
18 456
Figure 7. Correlating the experimental observations in Li1.33–2y/3Ti0.67–y/3FeyS2 with theoretical calculations. (a) Evolution of pDOS 457
with increasing Fe content. Li, Ti, Fe and S contributions to bands are colored in light green, red, cyan and purple, respectively (b)
458
Evolution of pDOS of Li1.17Ti0.58Fe0.25S2 with Li-removal. The panel in middle indicates the deduced redox processes. The
459
corresponding theoretically obtained S–S distances are shown in the histograms at right. The distances were chosen using a
460
distance cut-off of 4 Å, without renormalization.
19
At high states of charge, the top of the highly dispersed sulfur band gets raised above the bottom of 462
the empty Fe-UHB leading to electronic instability. This scenario triggers, if we simulate complete Li 463
removal (xLi ~ 0), a reorganization of the network through the formation of true S–S dimers with a calculated
464
bond length of ~2.1 Å (red background in the histogram). However, experimentally, full Li depletion is not 465
observed since our fully oxidized sample still contains 0.13 Li+ (~ Li
0.13Ti0.57Fe0.3S2). In short, the
466
participation of S in the redox process could unambiguously be confirmed theoretically, hence explaining 467
the measured shortening of the S-S distances. However, the predicted dimerization at full charge could not 468
be confirmed experimentally because the fully delithiated phase was not obtained electrochemically. This 469
finding probably explains the excellent cycling reversibility of Li1.33–2y/3Ti0.67–y/3FeyS2, as opposed to TiS3,
470
where the cleavage of the S–S dimers leads to huge rearrangements of the crystal structure, resulting to rapid 471
capacity fading with cycling.30–32 Nevertheless, the question of (S
2)2− vs. Sn− (n < 2) upon complete
472
delithiation remains to be fully elucidated, which will likely trigger more detailed characterizations and 473
theoretical calculations on various sulfide materials in the future. 474
In summary, a new class of Li-rich layered sulfides Li1.33–2y/3Ti0.67–y/3FeyS2 have been designed and
475
studied for their electrochemical behaviour as cathode materials. Within this series, the phase 476
Li1.13Ti0.57Fe0.3S2 offers the largest reversible capacity (245 mAh·g–1) and we have shown, via
477
complementary Mössbauer, XANES, EELS, mRIXS and XPS spectroscopies, that this capacity mainly 478
originates from sulfur redox besides the cationic redox of Fe . When benchmarking against Li-rich NMCs, 479
this phase present several positive attributes such as (i) a nearly zero irreversible capacity during the initial 480
cycle, (ii) an overall voltage fade as low as 40 mV even after 60 cycles and (iii) low voltage hysteresis (35 481
mV), along with fast kinetics, as compared to Li-rich NMC showing an irreversibility of ~0.2 Li, a voltage 482
fade of 150 mV and a hysteresis of 300 mV besides sluggish kinetics. Energy-wise, these Li-rich layered 483
sulfide positive electrodes display a specific energy of ~600 Wh·kg–1 at the material-level while being 484
composed of earth-abundant elements (3d metals only). This is much lower than the ~1000 Wh·kg–1 485
obtained for Li-rich NMC and thus they may not offer any real-world competitiveness against oxide 486
electrodes furthermore due to their low operating potential as well as the practical issues with the handling 487
of sulfides. Nevertheless, we believe that they could serve as excellent ‘model’ electrodes to study the 488
general properties of anionic redox chemistry and in exploring kinetics, especially via the realization of S-489
based solid-state batteries that can enable playing with temperature as an extra dimension. Both low 490
hysteresis and structural integrity upon Li (de)intercalation are promising assets to design next-generation 491
cathodes provided we can overcome the energy density penalty pertaining to the use of sulfur as a ligand. 492
Preparing 3d-metal oxysulfides is an option if we ever overcome their synthesis difficulties. The door is 493
wide-open for chemists to take forward this new dimension of exploring the effect of the ligand in enhancing 494
the holistic performances of anionic redox in search for practical high-energy batteries. 495
20
Experimental Section
496
Synthesis. Li1.33-2y/3Ti0.67-y/3FeyS2 samples were prepared by solid-state reaction of stoichiometric amounts of Li2S (Alfa Aesar,
497
99.9%), TiS2 (Sigma Aldrich, 99.9%) and FeS (Alfa Aesar, 99%). Homogeneously mixed and hand-grinded precursor powders
498
were filled in quartz tubes in an Ar-filled glovebox followed by sealing the tubes under vacuum (~10–5 mbar). The sealed tubes
499
were subsequently annealed at 750 °C for 36 h followed by quenching in water. The as-prepared samples were collected inside a
500
glovebox and hand-grinded prior to further use. In the whole process, air contact was avoided and subsequent processing was done
501
in an Ar-filled glovebox. TiS3, used as a reference for XAS, was prepared similarly, by reacting TiS2 and elemental S (15 wt%
502
extra), in a vacuum sealed quartz tube at 550 °C, followed by cooling slowly.
503
Structural Characterization. Synchrotron X-ray powder diffraction (SXRD) patterns were collected at the 11-BM beamline of 504
the Advanced Photon Source (APS), Argonne National Laboratory. All SXRD data were collected in transmission mode with λ =
505
0.4127 Å, with the powder sealed in a quartz capillary of 0.7 mm diameter. Operando and in situ X-ray powder diffraction (XRD)
506
was performed in an airtight electrochemical cell equipped with a Be window. XRD patterns were recorded in reflection mode in
507
Bragg−Brentano geometry using a Bruker D8 Advance diffractometer equipped with a Cu-K X-ray source (λ1 = 1.54056 Å, λ2 =
508
1.54439 Å) and a LynxEye detector. The refinements of the patterns were done using the Rietveld method66 as implemented in the
509
FullProf program67.
510
Electrochemical characterization. Li1.33–2y/3Ti0.67–y/3FeyS2 samples were cycledin galvanostatic mode in Li half-cells assembled
511
in Swagelok-type cells. The cathode materials were mixed with 20 wt% conductive carbon Super-P by hand-grinding for 5 min
512
prior to cycling (Figure S2d inset). LP30 (1M LiPF6 in ethylene carbonate/dimethyl carbonate in 1:1 weight ratio) was used as the
513
electrolyte and was soaked in a Whatman GF/D borosilicate glass fiber membrane that was used as separator. Typical loadings of
514
10 mg of active materials were used and metallic Li was used as the negative electrode. The cells were assembled in an Ar-filled
515
glovebox and were cycled at a C/20 rate between 1.8 V and 3 V if not specified otherwise. Charged/discharged samples from the
516
Swagelok cells were recovered for ex situ characterizations by disassembling the cells inside glovebox, rinsed thoroughly with
517
anhydrous DMC and dried under vacuum. All electrochemical cycling and EIS measurements (in 10 mHz – 200 kHz frequency
518
range applying a 10 mV sinusoidal wave) were performed with BioLogic potentiostats.
519
Mössbauer spectroscopy. Room-temperature 57Fe Mössbauer spectra were recorded in transmission geometry in the constant
520
acceleration mode and with a 57Co(Rh) source with a nominal activity of 370 MBq. The velocity scale (±4 mms−1) was calibrated
521
at room temperature with α-Fe foil. The in situ cell was prepared with 32 mg.cm−2 of active material mixed with 8 mg of carbon
522
black. The hyperfine parameters IS (isomer shift) and QS (quadrupole splitting) were determined by fitting Lorentzian lines to the
523
experimental data. The isomer shifts values are calculated with respect to that of α-Fe standard at room temperature. The obtained
524
operando spectra were fitted using a statistical method based on Principal Component Analysis (PCA). This approach is a
525
chemometric factor analysis tool able to determine the minimal particular structures in multivariate spectral data sets. Once the
526
number of principal components is determined by PCA, a Multivariate Curve Resolution-Alternating Least Squares (MCR-ALS)
527
algorithm is used for the stepwise reconstruction of the pure spectral components which are necessary for interpreting the whole
528
multiset of operando Mössbauer spectra.68
529
Energy loss spectra (EELS). The sample was prepared in an Ar-filled glove box by crushing the crystals in a mortar in DMC and 530
depositing drops of the suspension onto holey carbon grids. The samples were transported to the transmission electron microscope
531
(TEM) column while completely avoiding contact with air. High angle annular dark field scanning transmission electron microscopy
532
(HAADF-STEM) images and EELS spectra were obtained with a FEI Titan G3 electron microscope operated at 120 kV and
533
equipped with a monochromator and a Gatan Enfinium ER spectrometer. Energy resolution measured by full width at half maximum
534
of the zero loss peak is 0.15 eV.
535
X-ray absorption spectroscopy (XAS). S K-edge, Fe L-edge and Ti L-edge X-ray absorption near edge spectroscopy (XANES) 536
measurements were performed at 4-ID-C beamline of APS at Argonne National Laboratory. Spectra were recorded simultaneously
537
under both the total electron yield (TEY) mode from the sample photocurrent at ∼10-9 Torr and total fluorescence yield (TFY) mode
538
using a silicon drift diode detector at a spectral resolution of ∼0.2 eV, with a 2 s dwell time. The energy scales of the spectra were
539
calibrated with the references of Mo metal, Fe metal and SrTiO3 measured simultaneously, for S, Fe and Ti edges, respectively.
540
Both TEY and TFY spectra produces similar spectra, and hence only TFY spectra (more bulk sensitive) has been reported here.
541
Soft X-ray absorption spectroscopy (sXAS) and mapping of resonant inelastic X-ray scattering (mRIXS). The S L-edge sXAS 542
and mRIXS experiments were performed in the iRIXS endstation of beamline 8.0.1 at the Advanced Light Source (ALS) of
21
Lawrence Berkeley National Laboratory.69 The pristine powder and cycled electrodes were mounted in high purity Ar glove box
544
and transferred into the experimental vacuum chamber through a home-made kit to avoid any air exposure. The experimental energy
545
resolution of sXAS is better than 0.1 eV without considering the intrinsic core hole broadening (~0.2 eV). The energy resolution
546
along the emission energy in mRIXS is about 0.2 eV,69 which is sufficient for separating the intrinsic S-L signals from the strong
547
C-K (2nd order) background that are different for about 10 eV. The X-ray exposure area on the samples were kept moving throughout
548
the mRIXS experiments to avoid irradiation damage.
549
X-ray photoemission spectroscopy (XPS). XPS spectra were collected on a sample (analyzed area = 300×700 μm2) with a Kratos
550
Axis Ultra spectrometer, using focused monochromatic Al Kα radiation (hν = 1.4866 keV). The pressure in the analysis chamber
551
was around 5 × 10⁻⁹ mbar. The binding energy scale was calibrated using the C 1s peak at 285.0 eV from the invariably present
552
hydrocarbon contamination (for the pristine sample), and using the S2– position of the S 2p
3/2 at 160.7 eV for a better accuracy (for
553
the other cycled samples). Peaks were recorded with constant pass energy of 20 eV. Core peaks were analyzed using a nonlinear
554
Shirley-type background.70 The peak positions and areas were optimized by a weighted least-squares fitting method using 70 %
555
Gaussian, 30 % Lorentzian line shapes. Quantification was performed on the basis of Scofield’s relative sensitivity factors.71
556
Theoretical calculations. Starting from a 221 supercell of Li2TiS3 obtained from SXRD refinement, with honeycomb ordering of
557
Li/Ti in the metallic layer, we achieved a composition of Li1.17Ti0.58Fe0.25S2 (resp. Li1Ti0.5Fe0.5S2) by replacing 2 Li (resp. 4) and 1
558
Ti (resp. 2) atoms by Fe atoms. The atoms to replace were chosen to minimize the total Madelung energy of the final structure. To
559
delithiate, we iteratively removed the Li atoms according to their Madelung energy (assuming integer oxidation state for every ion),
560
using the Python Material Genome library.72 For each Li content, structures were then relaxed using the Vienna Ab-Initio Simulation
561
Package using ultra-soft PAW pseudo potentials and the Perdew-Burke-Ernzerhof functional with a generalized gradient
562
approximation.73,74 We added D3 correction to account for the van der Waals interaction75 as well as a U
eff = 1.9 eV to account for
563
electron–electron interactions on Fe.76 The forces on the atoms were converged to 103 eVÅ−1 with a plane-wave energy cut-off of
564
600 eV and a well converged set of Kpoints.
565 566
Acknowledgements:
S.S. thanks the Réseau sur le Stockage Electrochimique de l’Energie (RS2E) for 567funding of the Ph.D. J.-M.T. acknowledges funding from the European Research Council (ERC) 568
(FP/2014)/ERC Grant-Project 670116-ARPEMA. Use of the 11-BM mail service of the APS at Argonne 569
National Laboratory was supported by the US Department of Energy under contract No. DE-AC02-570
06CH11357 and is gratefully acknowledged. The sXAS and mRIXS experiments at BL8.0.1 used resources 571
of the Advanced Light Source, which is a DOE Office of Science User Facility under contract no. DE-572
AC02-05CH11231. The authors thank M. Saubanère & M-L. Doublet for fruitful discussions and the 573
laboratory Chimie Théorique Methodes & Modélisaion (CTMM) at the Institut Claude Gerhardt Montpellier 574
(ICGM) for computational facilities. 575