For Review Only
Spatial genetic structure in Milicia excelsa (Moraceae) indicates extensive gene dispersal in a low density wind
pollinated tropical tree.
Journal: Molecular Ecology Manuscript ID: draft
Manuscript Type: Original Article Date Submitted by the
Author:
Complete List of Authors: Bizoux, J P; Gembloux Agricultural University, Laboratory of Ecology
Daïnou, Kasso; Gembloux Agricultural University, Laboratory of tropical and subtropical forestry
Bourland, Nils; Gembloux Agricultural University, Laboratory of tropical and subtropical forestry
Hardy, Olivier; Université Libre de Bruxelles, Behavioural and Evolutionary Ecology Unit
Heuertz, Myriam; Université Libre de Bruxelles, Behavioural and Evolutionary Ecology Unit; Centre of Forest Research CIFOR-INIA, Forest Systems and Resources
Mahy, Grégory; Gembloux Agricultural University, Laboratory of Ecology
Doucet, Jean-Louis; Gembloux Agricultural University, Laboratory of tropical and subtropical forestry
Keywords: Population Genetics - Empirical , Conservation Biology, Conservation Genetics, Ecological Genetics
For Review Only
Spatial genetic structure in Milicia excelsa (Moraceae) indicates extensive gene dispersal 1
in a low density wind pollinated tropical tree. 2
Bizoux J-P.*1, Daïnou K.*2, Bourland N.2, Hardy O.J.3, Heuertz M.3,4, Mahy G.1, Doucet J-3
L.2 4
1
Laboratory of Ecology, Gembloux Agricultural University, 2 passages des déportés 5030 5
Gembloux, Belgium 6
2
Laboratory of tropical and subtropical forestry, Gembloux Agricultural University, 2 7
passages des déportés 5030 Gembloux, Belgium 8
3
Behavioural and Evolutionary Ecology Unit - CP 160/12, Faculté des Sciences, Université 9
Libre de Bruxelles, 50 Av. F. Roosevelt, 1050 Brussels, Belgium 10
4
Centre of Forest Research CIFOR-INIA, Dept. of Forest Systems and Resources, carretera de 11
la Coruña km 7.5, 28040 Madrid, Spain 12
* These authors have equally contributed to the study. 13
14
Keywords: spatial genetic structure, effective population density, Milicia excelsa, iroko, gene 15
dispersal, Central Africa 16
Corresponding authors: Bizoux Jean-Philippe: Laboratory of Ecology, Gembloux Agricultural 17
University, 2 passages des déportés 5030 Gembloux, Belgium. [email protected], phone 18
number: 0032 (0) 81622240, Fax: 0032 (0)81 614817. 19
Running title: Spatial genetic structure of Milicia excelsa 20 21 22 23 24 25
For Review Only
Abstract26
Spatial genetic structure (SGS) analysis is an effective means to characterize the demographic 27
history and dispersal capacities of tree species, and has shown utility in conservation 28
management programs. In the present study, we analyzed SGS patterns and estimated 29
dispersal distances in Milicia excelsa (Welw.) C.C. Berg (Moraceae), a wind-pollinated 30
dioecious African tree. The species is considered threatened in large parts of its range and 31
population densities are typically low (ca. 10 adults/km2). Eight microsatellite markers were 32
used to type 287 individuals comprising four Cameroonian populations. The populations 33
represented different habitats and tree densities. Differentiation among populations was very 34
low and Bayesian clustering methods inferred a single gene pool. Two populations in more 35
open habitat did not display any correlation between relatedness and spatial distance between 36
individuals, whereas significant SGS was detected in two populations situated under 37
continuous forest cover. Our results showed weak SGS with a maximum Sp statistic of 0.006, 38
a value in the lower quartile of SGS estimates for trees in the literature. Indirect estimates of 39
gene dispersal distances ranged from σg = 1 km to 7.1 km, corresponding to neighborhood 40
sizes of 126 to 436 individuals. These estimates were one order of magnitude higher than 41
most estimates found in the literature for tropical tree species. This result can largely be 42
explained by life history traits of the species. M. excelsa exhibits a potentially wide-ranging 43
wind-mediated pollen dispersal mechanism as well as very efficient seed dispersal mediated 44
by large frugivorous bats. Implications for conservation are discussed. 45
For Review Only
Introduction46
A quantitative understanding of the genetic dynamics of threatened and/or 47
overexploited plant populations is fundamental in conservation management; and seed and 48
pollen dispersal are the two primary factors dictating genetic patterns. In tropical tree species, 49
direct field measurements of dispersal are often difficult to conduct, and therefore indirect 50
approaches may be required (Smouse et al. 2001; Smouse & Sork 2004; Burczyk & 51
Koralewski 2005). Over time, the interaction of pollen and seed-mediated gene flow with 52
local genetic drift produces patterns of spatial genetic structure (SGS) for neutral molecular 53
markers (Vekemans & Hardy 2004; Hardy et al. 2006; Dick et al. 2008). SGS patterns can 54
therefore potentially provide estimates of average gene dispersal distances over a few 55
generations (Hardy & Vekemans 1999, see below). These data are particularly valuable for 56
management because dispersal is a highly stochastic process, determined by the abundance 57
and behavior of seed and pollen dispersal vectors, which may vary between years and 58
populations (Nathan et al. 2000; Muller-Landau et al. 2008). SGS has been detected at several 59
spatial scales in tropical and temperate tree species, and the degree of structure varied 60
significantly due to seed and pollen dispersal vectors (Luna et al. 2005; Vekemans & Hardy 61
2004; Hardy et al. 2006; Dick et al. 2008). 62
Other factors affecting SGS in tree populations are local tree density and spatial 63
distribution (Doligez et al. 1998; Born et al. 2008). Tree density is expected to play a major 64
role in SGS because low densities, exhibited by most tropical tree species, result in increased 65
SGS due to higher local genetic drift (Vekemans & Hardy 2004). Alternatively, a decrease in 66
tree densities could indirectly increase gene dispersal distances through enhanced pollen flow, 67
reducing SGS (Hardy et al. 2006; Born et al. 2008; Dick et al. 2008). For example, in an 68
African tropical tree, Born et al. (2008) found an absence of fine scale SGS variation among 69
For Review Only
populations with different natural or anthropogenic variation in density and suggested that 70
enhanced gene flow may compensate for lower population density. 71
Landscape features, including habitat availability, suitability and distribution; and the 72
effects of human land use also define demographic parameters. Furthermore, local 73
demographic structure may fluctuate due to vegetation type and habitat cover. These factors 74
can offset the effect of drift and modify SGS (Epperson 2000; Born et al. 2008). Therefore, 75
the characterization of SGS in populations from different environments with varied land use 76
histories may be a good strategy to understand within species gene flow. 77
Spatial genetic structure can be characterized by the decay in kinship coefficients 78
between pairs of individuals as a function of the physical distance separating them (kinship-79
distance curve, reviewed by Vekemans & Hardy 2004). The Sp statistic, which depends 80
essentially on the slope of the kinship-distance curve, allows quantification and direct 81
comparison of SGS among populations, species and genetic marker types (Hardy 2003; 82
Vekemans & Hardy 2004). An indirect estimate of gene dispersal distance, σg, can be
83
obtained from the regression slope if the SGS results from an isolation by distance (IBD) 84
process at drift-dispersal equilibrium and if information on effective population density is 85
available (Hardy et al. 2006; Rousset 2000). In addition, the initial curvature of the kinship-86
distance curve may provide insights on the relative contribution of pollen and seed dispersal 87
to overall gene flow (Heuertz et al. 2003). However, SGS does not necessarily reflect IBD at 88
drift-dispersal equilibrium (Epperson 2000). It can mirror demographic fluctuations as stated 89
above, or, reflect recent colonization (Gapare & Aitken 2005; Troupin et al. 2006). If 90
colonization history involves admixture of differentiated gene pools, a hierarchical approach 91
combining a Bayesian clustering method and kinship-distance regression can be used to 92
establish SGS origins (Born et al. 2008). 93
For Review Only
Despite recent advances in our understanding of the genetic dynamics in tropical trees, 94
current studies are far from depicting the spectrum of diversity in population structure, life-95
history traits and evolutionary history (Hardy et al. 2006; Dick et al. 2008). Here, we assess 96
SGS and gene flow in Milicia excelsa (Welw.) C.C. Berg (Moraceae), an important African 97
tropical timber tree species (trade name “iroko”), which exhibits unique life history 98
characteristics. While most SGS studies have been conducted on insect-pollinated species, M. 99
excelsa is wind-pollinated (Jøker 2002). Its seeds are mainly dispersed by frugivorous bat, but 100
squirrels, anomalures or parrots can also act as dispersers (Osmaston 1965; Taylor & Kankam 101
1999). In a large part of the study area in southern Cameroon, M. excelsa populations 102
naturally occur at low densities of 2-20 trees/km² (dbh ≥ 30 cm, Feteke et al. 2004; Form 103
Ecology Consultants 2004), substantially lower than most tropical tree species previously 104
studied (50-600 trees/km², Dick et al. 2008). Furthermore, the species is native to different 105
tropical climates, varied forest types (forest-savannah mosaic, dry forest, moist evergreen and 106
semi-evergreen forest) and landscapes with different human land use histories. The abundance 107
and density of M. excelsa varies significantly according to geographic location and forest type 108
(Nichols et al. 1998). In many countries, M. excelsa has been harvested from natural forests 109
for decades, often at unsustainable rates (Ofori & Cobbinah 2007), and is registered in the 110
IUCN Red List as “Near Threatened”. 111
In the present study, we investigate SGS in M. excelsa, a tropical tree species with 112
original biological traits of gene dispersal. Specifically, we examine the extent of SGS 113
variation by studying four populations distributed in regions differing in some landscape 114
features. Our objective was to improve our understanding of the factors affecting local genetic 115
structure in the species. We used a stepwise approach (Born et al. 2008) combining a 116
Bayesian clustering method and kinship-distance regressions to identify any influence of 117
For Review Only
colonization history and IBD. We consequently examined gene dispersal distance in 118
populations that exhibited a SGS pattern consistent with IBD. 119
120
Materials and methods 121
122
Study species
123
Milicia excelsa (Welw.) C.C. Berg (Moraceae) is a species of large dioecious and deciduous 124
trees native to sub-Saharan Africa. Milicia excelsa is commercialized under the trade name 125
“iroko”. According to White (1966), M. excelsa extends from the Ivory Coast and Ghana 126
through Angola, Central and East Africa to Mozambique. M. excelsa is the only species of 127
Milicia occurring in Cameroon (Ofori & Cobbinah 2007; Bosu et al. 2006). The species has 128
been described as light demanding (Jøker 2002; Doucet 2003). The inconspicuous male 129
flowers arranged in pendulous catkins indicate that the species is wind pollinated, and 130
flowering occurs at the end of the dry season when the trees are leafless (Jøker 2002). 131
Females produce fleshy fruit (length: 55,7 ± 11,0 mm, width: 19,2 ± 4,2 mm, weight: 19,6 ± 132
5,1 g), containing small seeds (78,2 ± 109,1 seeds/fruit) (Nichols et al. 1999, Daïnou, 133
unpublished). Seeds are primarily dispersed by the large frugivorous bat Eidolon elvum Kerr 134
(Osmaston 1965; Taylor & Kankam 1999). Additional seed dispersers are squirrels 135
(Paraxerus sp.), an anomalure (Anomaluris peli) and parrots (Poicephalus gulielmi, Psittacus 136
erithacus and Agapornis swindernianus; Daïnou, pers. obs., Poicephalus robustus; Taylor & 137
Kankam 1999). Bats can disperse seeds over long distance as they can forage at distance up to 138
60 km from the roost. In migration periods, bats can travel on average 90km/day with a 139
maximal distance of 150 km (Richter and Cumming, 2008). M. excelsa individuals can be up 140
to 50 m tall with a diameter not exceeding 200 cm. M. excelsa is one of the five most heavily 141
logged trees in Cameroon (Amariei 2005). Iroko stands were estimated to have declined in the 142
For Review Only
last decades due to poor regeneration coupled with excessive levels of exploitation (Ofori & 143
Cobbinah 2007). 144
Sampling and study sites
145
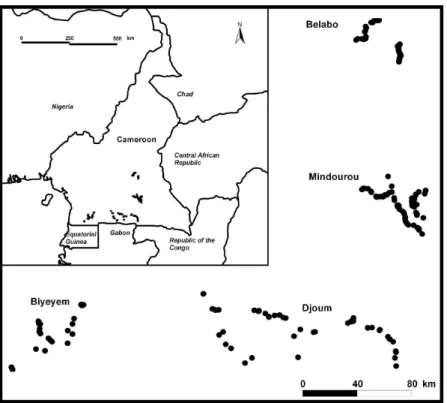
We collected leaf or cambium samples of 287 M. excelsa individuals in four different regions 146
in south Cameroon: Belabo, Mindourou, Djoum and Biyeyem with respectively 78, 104, 54 147
and 51 individuals sampled (Fig. 1). Individuals were mostly sampled in the vicinity of forest 148
tracks accessible by vehicle. According to field observation, the spatial distribution of the 149
species appeared rather well spread within each region except in Biyeyem where individuals 150
seemed to be essentially located nearby disturbed zones (roads, secondary forests). Although 151
the range of this species is continuous in southern Cameroon, we considered individuals from 152
each region as a different population in relation to differences in demographic characteristics 153
and landscape features. The minimum distance between samples from distinct populations 154
was approximately 100 km, and the maximum distance between samples within populations 155
was approximately 60 km, with the exception of Djoum where it reached 150 km. Mindourou 156
and Djoum are located in the East Province of Cameroon, respectively north-east and south of 157
the Dja Wildlife Reserve. The vegetation is dominated by moist semi-evergreen forest rich in 158
lianas (White 1966) and the climate is equatorial with two rainfall peaks and a dry season of 159
three months (White 1983; Sonke 1998).The Biyeyem population is located east of the 160
Campo-Ma’an National Park in the transition zone between semi-evergreen and coastal 161
evergreen rainforest (White 1966). The Belabo population is located to the north of the East 162
Province of Cameroon, in a region characterized by forest-savanna mosaic vegetation 163
(transition zone forest, White 1966) with a longer dry season (5-6 months). 164
M. excelsa population density and degree of habitat openness varied among regions. Such 165
variation could influence SGS and gene dispersal. Population densities for reproductively 166
mature M. excelsa (diameter at breast height >35 cm, Daïnou unpublished data) were D = 4.9 167
For Review Only
trees/km² at Mindourou and 19.6 trees/km² at Djoum (Feteke et al. 2004; FORM Ecology 168
Consultants 2004). No reliable density estimates were available for Biyeyem and Belabo, but 169
field observations suggested they were higher than for other populations (Daïnou & Heuertz, 170
pers. obs.). Mindourou and Djoum populations are typical forest habitats with a high cover 171
canopy. Agriculture is more pronounced in Biyeyem and includes primarily cash crops such 172
as coffee and cocoa, resulting in more open habitats. M. excelsa trees in this region were 173
located and sampled in fields or fallows. Finally, the comparatively most open habitat was 174
found in Belabo area due to forest-savanna habitat and extensive slash and burn agriculture. 175
176
Genotyping
177
DNA was extracted using the DNeasy Plant minikit (QIAGEN, Inc.). Ten specific 178
microsatellite loci characterized by Ouinsavi et al. (2006) were tested on ten individuals with 179
representatives form each population. Eight loci were consistently amplified in PCR and were 180
therefore selected for genotyping. Forward primers were labeled with fluorescent dies 181
(between brackets): Mex 51 (6-FAM), Mex 63 (6-FAM), Mex 69 (Hex), Mex 81 (Hex), Mex 182
95 (6-FAM), Mex 137 (6-FAM), Mex 163a (Ned), Mex 202 (Ned). Loci were segregated into 183
two PCR multiplexes as follows: (i) Mex 51, Mex 81, Mex 137, Mex 163a, Mex 202; and (ii) 184
Mex 63, Mex 69 and Mex 95. Multiplex PCR was performed using the Multiplex PCR Kit 185
(QIAGEN, Inc.) following the manufacturer’s protocol in a final reaction volume of 10 µL 186
(5µlL of 2x QIAGEN Multiplex Master Mix, 1 µL of primer mix, 1 µL of Q-solution, 1 µL of 187
H2O and 2 µL of template DNA). PCR conditions were as follows: 15 min denaturation at
188
95°C followed by 30 cycles of 30 s denaturation at 94°C, 90 s annealing at 59°C, 60 s 189
extension at 72°C and 30 min final elongation at 60°C. Amplifications were conducted in a 190
BIOZYM PTC 200 thermocycler (Biozym Diagnostik GmbH). Genotyping was performed on 191
For Review Only
an ABI PRISM 3100, using a pooled mix of 2 µl PCR product, 13 µL of deionized formamide 192
and 0.6 µL of GS400HD size standard (Applied Biosystems). 193
PCR fragment sizes were qualitatively scored and recorded in base pairs with two decimal 194
place precision using GeneMapper 3.0 (Applied Biosystems). Binning into allele classes was 195
performed with Microsoft Excel. All retained multilocus genotypes were scored for at least 6 196
of 8 markers. The average missing data per locus was 2% (Table 1). 197
Data analyses
198
Genetic diversity and large-scale structure 199
The number of alleles per locus, allelic range, genetic diversity (HE) and inbreeding
200
coefficients (FIS) were estimated using GENEPOP 4.0 (Rousset 2008). The software
201
Microchecker version 2.2.3 (van Oosterhout et al. 2004) was used to detect suspected null 202
alleles per locus and per population under the assumption of random mating. To account for 203
suspected null alleles, genotypes at each specific locus per population were adjusted following 204
van Oosterhout et al. (2004), and FIS was subsequently re-estimated on the transformed data.
205
Deviations from Hardy-Weinberg genotypic expectations at each locus in each population 206
were tested using exact tests in GENEPOP. A sequential Bonferroni procedure was applied to 207
discard significant deviations due to chance (Rice 1989). 208
Differentiation among populations (FST) was estimated with SPAGeDi ver. 1.2 (Hardy &
209
Vekemans 2002). The presence of differentiated gene pools in the overall sample and within 210
each population was explored using the Bayesian clustering algorithm implemented in Tess 211
ver . 2.1 (Chen et al. 2007). The method employs a Markov chain Monte Carlo (MCMC) 212
process to estimate allele frequencies and assign individuals probabilistically to either distinct 213
gene pools or jointly to two or more gene pools if their genotypes indicate admixture. We 214
used the no-admixture model with an interaction parameter ψ of 0.6 and a degree of trend 215
constant (0) or linear (1). Theses parameters affect the relative weight given to spatial position 216
For Review Only
and genotype when assigning an individual to a cluster. 20 independent analyses were carried 217
out for each number of clusters 1≤K≤ 10, using 15000 MCMC iterations following a burn-in 218
period of 50000 steps. Analyses were performed for the whole data set and for each 219
population. The number of clusters K that best described the data was identified using the 220
maximum log likelihood of data [LnP(D|K)], the minimum variance of [LnP(D|K)] and the 221
minimum of DIC (Chen et al. 2007). After preliminary computations, we did 50 runs, with a 222
burn-in number of sweeps of 10000 and 50000 iterations, for the best number of K. Tess 223
software was preferred to other Bayesian clustering algorithms because it performs better in 224
the case of continuous species distribution and low Fst (Latch et al. 2006, Chen et al. 2007).
225 226
Fine-scale spatial genetic structure 227
We assessed SGS by spatial autocorrelation analysis within populations following Vekemans 228
and Hardy (2004) using SPAGeDi ver. 1.2 (Hardy & Vekemans 2002). Kinship coefficients 229
(Fij) were estimated between individuals i and j using J. Nason’s estimator (Loiselle et al. 230
1995). Fij was regressed on the natural logarithm of the spatial distance separating individuals, 231
ln(dij), which provided regression slopes bLd. To test for SGS, spatial positions of individuals 232
were permuted 10000 times to obtain the frequency distribution of bLdunder the null 233
hypothesis that Fijand ln(dij) were uncorrelated. The extent of spatial genetic structure was 234
quantified using the Sp statistic (Vekemans & Hardy 2004), calculated as −bLd40/(1 − F1),
235
where F1 represented the mean Fijfor the first distance interval (0-2 km, an approximation of
236
the mean kinship between neighbors) and the bLd40regression slope of Fijon ln(dij) for dij ≤ 40 237
km. This distance corresponded to the maximum inter-individual distance that could be 238
obtained in all populations. To visualize SGS, kinship coefficients were also averaged over a 239
set of distance intervals (d), giving F(d), and plotted against the logarithm of geographical 240
For Review Only
distance. Five distance classes were chosen to achieve the best uniform scale over 241
populations: 0-2 km, 2-6 km, 6-18km, 18- 80 km and > 80 km. 242
Gene dispersal estimates 243
If SGS in a two-dimensional space results from isolation by distance, gene dispersal estimates 244
can be obtained from the bLd regression slope and the kinship coefficient between neighboring 245
individuals (F1) by the relationship: Nb ≡ 4πDeσg2= – (1 – FN)/bLd, where De is the effective
246
population density, σg2is half the mean squared gene dispersal distance (0.71 times the
247
quadratic average gene dispersal distance), and Nb may be interpreted as neighborhood size 248
(Rousset 1997; Vekemans & Hardy 2004). Regression linearity is expected if it is performed 249
on distances ranging from σg to σg/(2µ)1/2, where µ is the mutation rate (Rousset 2000). An
250
assumed mutation rate of 10-3 to 10-4 per generation for microsatellites translates to an upper 251
distance limit of about 20σg. We used an iterative approach to estimate Nb and σg knowing 252
De, as implemented in SPAGeDi (Hardy & Vekemans 2002). Dewas approximated as the 253
census density D times the effective vs. census population size ratio (Ne/N, De =D* Ne/N) 254
(Vekemans & Hardy 2004). Demographic studies have demonstrated that Ne/N ratios in adult 255
populations typically range from 0.1 to 0.5 (Frankham 1995). Because M. excelsa is 256
dioecious, this ratio may be further reduced if sex ratio is unbalanced (Nunney 1993). 257
Therefore, D/2, D/4 and D/10 were used as alternative estimates of De.
258 259
The shape of the kinship-distance curve can explain the relative contributions of pollen and 260
seed dispersal, as Heuertz et al. (2003) showed in a simulation study using bivariate isotropic 261
normal dispersal functions of pollen and seeds. The second derivative, k, of a third degree 262
polynomial regression of Fij on the logarithm of short distance indicates the initial
kinship-263
distance-plot curvature (for details, see Vekemans & Hardy 2004). A concave shape (k > 0) at 264
short distance indicates leptokurtic gene flow, which occurs when the short-distance 265
For Review Only
component of dispersal, often seed dissemination, is spatially restricted. A convex shape 266
(k<0) at short distance indicates no such restriction. 267
268
Results 269
Genetic diversity and large-scale structure 270
The number of alleles per locus ranged from four to 20, resulting in total gene diversities 271
ranging from HT = 0.316 to 0.853 (Table 1). Inbreeding coefficients (FIS) were significantly
272
positive for six loci and null alleles were suspected in all populations and at all loci, with the 273
exception of Mex137 (Table 1). Allele frequencies were subsequently adjusted for null alleles 274
following van Oosterhout et al. (2004), and FIS remained significantly positive for five loci
275
(Table 1). At the population level, genetic diversity (HE) ranged from 0.531 to 0.561 (Table
276
2). A significant heterozygote deficit was detected even after adjusting for null alleles, with 277
the inbreeding coefficient ranging from FIS = 0.060 to 0.096 (Table 2). Differentiation among
278
populations was very low (FST = 0.01).
279
An overall analysis of the 287 individuals using Tess yielded the better clustering of the data 280
for K=2, ([LnP(D|K=2)] = -5153, Dic =10273) with an assignment of all individuals to one 281
genetic cluster (estimated mixing proportions for K = 2: 0.98, 0.02), suggesting that the 282
sample comprised a single genetic unit. One genetic unit was also inferred within each 283
population. 284
285
Fine-scale spatial genetic structure 286
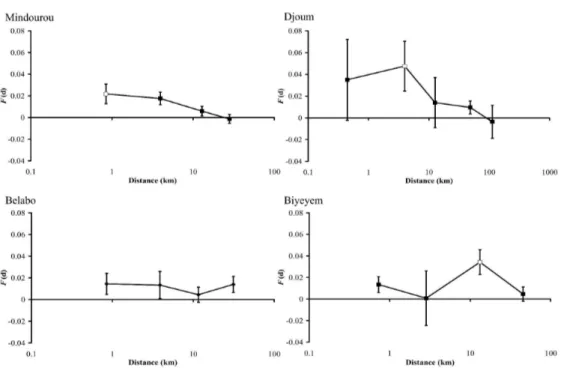
The regression slope bLd of pairwise kinship coefficients on the logarithm of spatial distance 287
was significantly negative in two populations: bLd = -0.0063 (P = 0.005) for Mindourou; and 288
bLd = -0.0101 (P = 0.003) for Djoum (Table 2, Fig. 2). The intensity of SGS assessed at a < 40 289
km scale was Sp = 0.0063 (0.0016, SE) for Mindourou; and Sp = 0.0039 (0.0051, SE) for 290
For Review Only
Djoum (Table 2). In the Biyeyem and Belabo populations, slopes were not significantly 291
different from zero (Table 2, Fig. 2). 292
Gene dispersal estimates 293
294
Gene dispersal estimates ranged from σg = 3.7 to 7.1 km in Mindourou; and σg = 1 to 2.6 km
295
in Djoum. These results corresponded to neighborhood sizes of Nb = 310 to 436 trees in 296
Mindourou; and 126 to 303 trees in Djoum (Table 3). The initial curvature of the kinship-297
distance curve was concave (k > 0 for distances smaller than 2 km) for Mindourou, suggesting 298
a limitation in short-range dispersal. In Djoum, such a limitation was not observed (k < 0, 299 Table 2)
.
300 301 Discussion 302Our results point to extensive gene flow in M. excelsa a wind pollinated low density 303
tropical tree. However extend of SGS varied among studied populations. 304
This variation may be expected from the complex combination of factors that 305
determine SGS, including seed and pollen dispersal (gene flow), demographic structure and 306
population history. 307
SGS variation among populations
308
One of the most striking results of the present study was the SGS variation among 309
populations, with two populations exhibiting SGS consistent with IBD and two populations 310
exhibiting random spatial genetic arrangement of individuals. Sp values (<0.006) in M. 311
excelsa were lower than most values reported for gravity or rodent-dispersed tropical tree 312
species, but of the same order of magnitude as those in bat- or bird-dispersed species (Dick et 313
al. 2008). 314
For Review Only
Conspecific tree density in M. excelsa showed an increase from Mindourou and 315
Djoum forest populations, to field and fallow habitats of Biyeyem, and, to the Belabo 316
population exhibiting an open habitat (forest-savanna mosaic). SGS was significant in only 317
the low-density populations under continuous forest cover. Stronger SGS in low compared to 318
high-density populations is expected because of the increase in local drift at lower densities 319
(Williams 1994; Gehring & Delph 1999; Vekemans & Hardy 2004). 320
In our study, conspecific tree density increased as habitat openness increased. This 321
might be because M. excelsa prefers increased light conditions and/or is better adapted to 322
climates with a longer dry season such as that of Belabo (Nichols et al. 1998; Doucet 2003). 323
Contrastingly, the literature indicates that open habitats were often associated with low tree 324
densities, for instance, in comparisons of intact to anthropically fragmented forests (Young & 325
Merriam 1994; Nason & Hamrick 1997; Jump & Peñuelas 2006; Sork et al. 2002). Higher 326
SGS due to drift is expected in fragmented forests. In most cases, however, this expectation 327
was not supported (e.g., Young & Merriam 1994) because open habitats led to an increase in 328
dispersal distances, especially by pollen and irrespectively of the pollen dispersal vector 329
(wind-pollination: El-Kassaby & Jaquish 1996; insect-pollination: White et al. 2002; Dick et 330
al. 2003; Hanson et al. 2008; but see Jump & Peñuelas 2006; Sork et al. 2002). In our study, 331
direct estimates of pollen dispersal would be necessary to test for increased pollen 332
dissemination in open/disturbed habitats. However, the absence of SGS in populations from 333
open habitats may well be a direct consequence of higher tree density causing better genetic 334
mixing. 335
Human impact may also affect SGS. Current SGS patterns reflect gene flow during the 336
last five to ten generations (e.g. Heuertz et al. 2003), which in M. excelsa represents hundreds 337
of years. M. excelsa is one of the trees preserved for shading in coffee and cacao plantations, 338
For Review Only
is a fairly recent practice, initiated during the last decades (see also below). Therefore, the 340
effect of recent human landscape alterations on SGS is probably low. 341
342
Gene flow in a wind pollinated tropical tree species
343
Our approach to assess gene flow from the decay of the kinship-distance curve 344
provided indirect estimates of the extent of gene dispersal mediated by pollen and seed 345
movements over the past few generations. Such estimates are usually not very precise and do 346
not distinguish per se the impact of seed versus pollen dispersal but simulation studies and 347
comparisons between direct and indirect estimates in different organisms indicate that they 348
are fairly reliable (Hardy et al. 2006, Leblois et al. 2006 and Vekemans & Hardy 2004). 349
Estimates of gene dispersal (σg) ranged from 1 km to 7.1 km in the two rainforest populations,
350
depending on the assumptions of effective density (De). This result was one order of
351
magnitude greater than σg estimates in insect-pollinated tropical trees (about 100 – 500m, 352
Hardy et al. 2006; Born et al. 2008). Neighborhood sizes ranged from 126 to 436 individuals, 353
corresponding to areas of 13 to 633 km2. It is possible that due to logging, current density 354
estimates in M. excelsa underestimated historical densities. If so, we overestimated dispersal 355
distances, although it is difficult to determine to what extent. In Mindourou, for instance, 356
iroko harvesting should be fairly recent (since 1990; R. Feteke pers. com.). Gene dispersal 357
probably even exceeds the previous estimates in the more open habitats, where our study 358
indicated no kinship-distance correlation over distances of about 40km. 359
M. excelsa is wind-pollinated (Osmaton 1965; Jøker 2002), a rare feature in tropical 360
trees, where animal pollination is most commonly observed (Bawa 1990; Dick et al. 2003). 361
Wind-pollination is an inefficient pollination strategy in rainforests due to low species 362
densities and because pollen grains are easily washed to the ground by heavy rains (Dick et al. 363
2008 and references therein). Paradoxically, our results suggested that under conditions of 364
For Review Only
extremely low conspecific densities in rainforest populations and given the dioecious mating 365
system in M. excelsa, wind-pollination might be superior to insect-pollination in providing 366
reproductive assurance and may in part explain the large gene dispersal distances estimated in 367
our study. Wind can carry pollen over long distances and pollen dissemination, on average, 368
ranges farther than seed dispersal (Sato et al. 2006; Bittencourt & Sebenn 2007; de-Lucas et 369
al. 2008; but see Bacles et al. 2006). Wind-pollination has independently evolved multiple 370
times in angiosperms in response to pollinator limitation (Culley et al. 2002). In rainforest 371
species, wind pollination has been proposed for shade-tolerant trees with inconspicuous 372
flowers, including many understory species (Bawa 1990; Bullock 1994), but has also been 373
documented in trees higher in the canopy (Atluri et al. 2004). Even though M. excelsa 374
occupies its specific niche in rainforests, it may be better adapted to semi-deciduous forests 375
and their associated savannahs (Tondeur 1939; Nichols et al. 1998), where wind is an 376
efficient pollen dispersal agent. 377
Tree species with fleshy fruits typically exhibit efficient animal-mediated seed 378
dispersal, suggested from low among-population structure at maternally inherited markers 379
(e.g. Raspé et al. 2000; Petit et al. 2003). The main seed disperser of M. excelsa in the dry 380
semi-deciduous forest of the Afram Headwaters Forest Reserve in Ghana is the bat Eidolon 381
elvum (Taylor & Kankam 1999). E. elvum can travel average daily distances of 29 km 382
(Richter & Cumming 2008), and therefore may explain, in part, high gene dispersal distances 383
in M. excelsa. Congruent with putative bat-dispersal, the Djoum rainforest population from 384
our study displayed a convex kinship-distance curve at short distances (k<0), indicating the 385
absence of any limitations to short-range gene flow. Conversely, in the Mindourou rainforest 386
population, short-range gene flow was apparently limited (k>0). This result might reflect more 387
limited seed dispersal due to variation in disperser assemblages (Cordeiro & Howe 2003), 388
which may affect dispersal distances and SGS patterns. Preliminary observations suggested 389
For Review Only
that squirrels and parrots removed most seeds in this population (K. Daïnou, unpublished field 390
observations). An alternative explanation for the difference in curvature between Djoum and 391
Mindourou is that population density in Mindourou is substantially lower, increasing effective 392
pollen dispersal distances because there are few nearby trees. Hence, in Mindourou 393
population, pollen might disperse over larger distances than seeds while in Djoum population, 394
pollen and seeds would disperse over similar distances. Direct estimates of seed and pollen 395
dispersal are needed to test this hypothesis. 396
397
Management implications 398
Despite clear differences in spatial genetic structure, overall values of genetic diversity 399
and inbreeding coefficients were relatively homogeneous across all populations. Furthermore, 400
genetic diversity was similar to other tropical tree species (e.g. Born et al. 2008; Hanson et al. 401
2008; White et al. 1999; Dutech et al. 2002). 402
In dioecious taxa, the mating system is 100% outcrossed and inbreeding can therefore 403
not be attributed to selfing. In populations with SGS, Mindourou and Djoum, the moderate 404
levels of inbreeding observed might be explained by mating among relatives (biparental 405
inbreeding). Alternatively, undetected null alleles are another possible explanation (White et 406
al. 1999). 407
The observation of SGS in different populations of this threatened tropical timber tree 408
species has direct implications for conservation and forest management. Information on SGS 409
levels is important for seed collections to develop reforestation strategies. In comparison to 410
panmictic populations, seed collection in populations exhibiting SGS requires greater 411
distances among trees (here at least 10-20 km) and large sample sizes to avoid collecting seed 412
of related trees that represent only a subset of the genetic diversity (Bittencourt & Sebbenn 413
2008). 414
For Review Only
A potential genetic risk for heavily exploited tree species, and particularly dioecious 415
species, is that low pollen source diversity in a given tree becomes a limiting factor for 416
reproductive output and/or the genetic diversity of seeds, which may further cause substantial 417
inbreeding (Robledo-Arnuncio et al. 2004). Our indirect estimates of gene dispersal distance 418
were extensive and suggested no major risk of inbreeding due to low population density. 419
However, the risk that pollen may be a limiting factor cannot be assessed with our data, and 420
the likelihood that pollen dispersal is more limited than seed dispersal should not be 421 overlooked. 422 423 Conclusion 424
Patterns of genetic variation in Milicia excelsa in four areas of south Cameroon reveal 425
surprisingly low levels of SGS for a species that occurs at very low densities in at least two 426
geographic areas. Indirect estimates of gene dispersal indicated that seeds and/or pollen must 427
disperse over several kilometers to explain this pattern. To distinguish the relative roles of 428
seed and pollen dispersal and elucidate the contributions of dispersal agents and distances, 429
further insights should be obtained i) by observing seed removal in additional populations, ii) 430
by investigating SGS at chloroplast markers that might reveal the extent of seed dispersal and 431
iii) by genotyping progeny arrays that should provide contemporary estimates of pollen 432
dispersal distances (e.g., using TwoGener by Smouse et al. 2001, or KinDist by Robledo-433 Arnuncio et al. 2006). 434 435 436 437 438 439
For Review Only
440Acknowledgments 441
We are indebted to the Gembloux Agricultural University (FUSAGx, Belgium) for funding 442
this research via the project PPR 10.000, as well as the National Fund for Scientific Research 443
of Belgium (FRS-FNRS) via grant FRFC no. 2.4576.07. We are grateful to the forest 444
company Pallisco (particularly Michel Rougeron, Loïc Douaud and Richard Fétéké), and the 445
NGO Nature Plus (Belgium) for their constant effort to support our scientific studies. We 446
thank some Cameroonian botanists (specially Théophile Ayol, Emerand Gassang, Paul Zok, 447
Crépin N’djopande, Charlemagne Nguembou) for their help with the sampling and Laurent 448
Grumiau (ULB, Belgium) for his technical assistance in the laboratory. M. Heuertz is a 449
postdoctoral researcher of FRS-FNRS and acknowledges a FNRS-funded scientific visit to 450 CIFOR-INIA. 451 452 453 454 455 456 457 458 459 460 461 462 463 464
For Review Only
465References 466
Amariei L (2005) Legal compliance in forestry sector – Case study: Cameroon. Report to 467
FAO, Rome. 468
Atluri JB, Venkata Ramana SP, Subba Reddi C (2004) Explosive pollen release, wind-469
pollination and mixed mating in the tropical tree Shorea robusta Gaertn. f. 470
(Dipterocarpaceae). Current Science, 86, 416-419. 471
Bacles CFE, Lowe AJ, Ennos RA (2006) Effective seed dispersal across a fragmented 472
landscape. Science, 311, 628. 473
Bawa KS (1990) Plant-pollinator interactions in tropical rain forests. Annual Review in 474
Ecology and Systematics, 21, 399–422. 475
Bittencourt JVM, Sebbenn AM (2007) Patterns of pollen and seed dispersal in a small, 476
fragmented population of the wind-pollinated tree Araucaria angustifolia in southern Brazil. 477
Heredity, 99, 580-591. 478
Bittencourt JVM, Sebbenn AM (2008) Pollen movement within a continuous forest of wind-479
pollinated Araucaria angustifolia, inferred from paternity and TwoGENER analysis. 480
Conservation Genetics, 9, 855-868. 481
Born C, Hardy OJ, Chevallier MH, et al. (2008) Small-scale spatial genetic structure in the 482
Central African rainforest tree species Aucoumea klaineana: a stepwise approach to infer the 483
impact of limited gene dispersal, population history and habitat fragmentation. Molecular 484
Ecology, 17, 2041-2050. 485
Bosu PP, Cobbinah JR, Nichols JD, Nkrumah EE, Wagner MR (2006). Survival and growth 486
of mixed plantations of Milicia excelsa and Terminalia superba 9 years after planting in 487
Ghana. Forest Ecology and Management, 233, 352-357. 488
Bullock SH (1994) Wind pollination of neotropical dioecious trees. Biotropica, 26, 172–179. 489
For Review Only
Burczyk J, Koralewski TE (2005) Parentage versus two-generation analyses for estimating 490
pollen-mediated gene flow in plant populations. Molecular Ecology, 14, 2525-2537. 491
Chen C, Durand E, Forbes F, François O (2007) Bayesian clustering algorithms ascertaining 492
spatial population structure: A new computer program and a comparison study. Molecular 493
Ecology Notes, 7, 747-756. 494
Cordeiro NJ, Howe HF (2003) Forest fragmentation severs mutualism between seed 495
dispersers and an endemic African tree. Proceedings of the National Academy of Sciences of 496
the USA, 100, 14052–14056. 497
Culley TM, Wellerand SG, Sakai AK (2002) The evolution of wind pollination in 498
angiosperms. Trends in Ecology and Evolution, 17, 361-369. 499
de-Lucas AI, Robledo-Arnuncio JJ, Hidalgo E, González-Martínez SC (2008) Mating system 500
and pollen gene flow in Mediterranean maritime pine. Heredity, 100, 390-399. 501
Dick CW, Etchelecu G, Austerlitz F (2003) Pollen dispersal of tropical trees (Dinizia excelsa: 502
Fabaceae) by native insects and African honeybees in pristine and fragmented Amazonian 503
rainforest. Molecular Ecology, 12, 753-764. 504
Dick CW, Hardy OJ, Jones FA, Petit RJ (2008) Spatial scales of pollen and seed-mediated 505
gene flow in tropical rain forest trees. Tropical plant biology, 1, 20-33. 506
Doligez A, Baril C, Joly HI (1998) Fine-scale spatial genetic structure with nonuniform 507
distribution of individuals. Genetics, 148, 905-919. 508
Doucet J-L (2003) L'alliance délicate de la gestion forestière et de la biodiversité dans les 509
forêts du centre du Gabon. PhD thesis, Gembloux Agricultural University. 510
Dutech C, Seiter J, Petronelli P, Joly HI, Jarne P (2002) Evidence of low gene flow in a 511
neotropical clustered tree species in two rainforest stands of French Guiana. Molecular 512
Ecology, 11, 725-738. 513
For Review Only
El-Kassaby YA, Jaquish B (1996) Population density and mating pattern in western larch. The 514
Journal of Heredity, 87, 438-443 515
Epperson B.K. (2000) Spatial genetic structure and non-equilibrium demographics within 516
plant populations. Plant Species Biology, 15, 269-279. 517
Feteke R, Nkolong E, Hubert D (2004) Plan d’aménagement des unités forestières 518
d’aménagement n° 10 041, 10 042 et 10 044 regroupés. Pallisco, Douala, Cameroun. 519
FORM Ecology Consultants (2004) Plan d’aménagement durable UFA 09-021. Wijma, 520
Douala, Cameroun. 521
Frankham R (1995) Effective population size adult population size ratios in wildlife - a 522
Review. Genetical Research, 66, 95-107. 523
Gapare WJ, Aitken SN (2005) Strong spatial genetic structure in peripheral but not core 524
populations of Sitka spruce Picea sitchensis (Bong.) Carr. Molecular Ecology, 14, 2659-2667. 525
Gehring JL, Delph LF (1999) Fine-scale genetic structure and clinal variation in Silene 526
acaulis despite high gene flow. Heredity, 82, 628-637. 527
Hanson TR, Brunsfeld SJ, Finegan B, Waits LP (2008) Pollen dispersal and genetic structure 528
of the tropical tree Dipteryx panamensis in a fragmented Costa Rican landscape. Molecular 529
Ecology, 17, 2060-2073. 530
Hardy OJ, Vekemans X (1999) Isolation by distance in a continuous population: 531
reconciliation between spatial autocorrelation analysis and population genetics models. 532
Heredity, 83, 145-154. 533
Hardy OJ, Vekemans X (2002) SPAGEDi: a versatile computer program to analyse spatial 534
genetic structure at the individual or population levels. Molecular Ecology, Notes 2, 618-620. 535
Hardy OJ (2003) Estimation of pairwise relatedness between individuals and characterization 536
of isolation-by-distance processes using dominant genetic markers. Molecular Ecology, 12, 537
1577-1588. 538
For Review Only
Hardy OJ, Maggia L, Bandou E, et al. (2006) Fine-scale genetic structure and gene dispersal 539
inferences in 10 Neotropical tree species. Molecular Ecology, 15, 559-571. 540
Heuertz M, Vekemans X, Hausman JF, Palada M, Hardy OJ (2003) Estimating seed vs. pollen 541
dispersal from spatial genetic structure in the common ash. Molecular Ecology, 12, 2483-542
2495. 543
Jøker D (2002) Milicia excelsa (Welw.) C.C. Berg. Seed Leaflet, 63. 544
http://en.sl.life.ku.dk/upload/milicia_excelsa_63_int_001.pdf
545
Jump AS, Penuelas J (2006) Genetic effects of chronic habitat fragmentation in a wind-546
pollinated tree. Proceedings of the National Academy of Sciences of the United States of 547
America, 103, 8096-8100. 548
Latch EK, Dharmarajan G, Glaubitz JC, Rhodes OE (2006) Relative performance of Bayesian 549
clustering software for inferring population substructure and individual assignment at low 550
levels of population differentiation. Conservation Genetics, 7, 295-302. 551
Leblois R, Estoup A, Streiff R Genetics of recent habitat contraction and reduction in 552
population size: does isolation by distance matter? Molecular Ecology, 15, 3601-3615. 553
Loiselle BA, Sork VL, Nason J, Graham C (1995) Spatial genetic structure of a tropical 554
understory shrub, Psychotria Officinalis (Rubiaceae). American Journal of Botany, 82, 1420-555
1425. 556
Luna R, Epperson BK, Oyama K (2005) Spatial genetic structure of two sympatric 557
neotropical palms with contrasting life histories. Heredity, 95, 298-305. 558
Muller-Landau HC, Wright SJ, Calderón O, Condit R, Hubbell SP (2008) Interspecific 559
variation in primary seed dispersal in a tropical forest. Journal of Ecology, 96, 653–667. 560
Nason JD, Hamrick JL (1997) Reproductive and genetic consequences of forest 561
fragmentation: Two case studies of neotropical canopy trees. Journal of Heredity, 88, 264-562
276. 563
For Review Only
Nathan R, Safriel UN, Noy-Meir I, Schiller G (2000) Spatiotemporal variation in seed 564
dispersal and recruitment near and far from Pinus halepensis trees. Ecology, 81, 2156-2169. 565
Nichols JD, Agurgo FB, Agyeman VK, Wagner MR, Cobbinah JR (1998) Distribution and 566
abundance of Milicia species in Ghana. Ghana Journal of Forestry, 6, 1-7. 567
Nichols JD, Agyeman VK, Agurgo FB, Wagner MR, Cobbinah JR (1999) Patterns of 568
seedling survival in the Tropical African Tree Milicia excelsa. Journal of Tropical Ecology, 569
15, 451-461. 570
Nunney L (1993) The influence of mating system and overlapping generations on effective 571
population size. Evolution, 47, 1329-1341. 572
Ofori DA, Cobbinah JR (2007). Integrated approach for conservation and management of 573
genetic resources of Milicia species in West Africa. Forest Ecology and Management, 238, 1-574
6 575
Osmaton HA (1965). Pollen and seed dispersal in Chlorophora excelsa and other Moraceae, 576
and in Parkia filicoidea (Mimosaceae), with special reference to the role of the fruit bat, 577
Eidolon helvum. Commonwealth Forestry Review, 44, 96-104. 578
Ouinsavi C, Sokpon N, Bousquet J, Newton CH, Khasa DP (2006) Novel microsatellite DNA 579
markers for the threatened African endemic tree species, Milicia excelsa (Moraceae), and 580
cross-species amplification in Milicia regia. Molecular Ecology Notes, 6, 480-483. 581
Petit RJ, Aguinagalde I, de Beaulieu JL et al. (2003) Glacial refuges: hotspots but not melting 582
pots of genetic diversity. Science, 300, 1563–1565. 583
Raspé O, Saumitou-Laprade P, Cuguen J, Jacquemart AL (2000) Chloroplast DNA haplotype 584
variation and population differentiation in Sorbus aucuparia L. (Rosaceae: Maloideae). 585
Molecular Ecology, 9, 1113-22. 586
Rice WR (1989) Analyzing Tables of Statistical Tests. Evolution, 43, 223-225. 587
For Review Only
Richter HV, Cumming GS (2008) First application of satellite telemetry to track African 588
straw-coloured fruit bat migration. Journal of Zoology, 275, 172-176. 589
Robledo-Arnuncio JJ, Alia R, Gil L (2004) Increased selfing and correlated paternity in a 590
small population of a predominantly outcrossing conifer, Pinus sylvestris. Molecular Ecology, 591
13, 2567-2577. 592
Robledo-Arnuncio JJ, Austerlitz F, Smouse PE (2006) A new method of estimating the pollen 593
dispersal curve independently of effective density. Genetics, 173, 1033–1045. 594
Rousset F (1997) Genetic differentiation and estimation of gene flow from F-statistics under 595
isolation by distance. Genetics, 145, 1219-1228. 596
Rousset F (2000) Genetic differentiation between individuals. Journal of Evolutionary 597
Biology, 13, 58-62. 598
Rousset F (2008) GENEPOP ' 007: a complete re-implementation of the GENEPOP software 599
for Windows and Linux. Molecular Ecology Resources, 8, 103-106. 600
Sato T, Isagi Y, Sakio H, Osumi K, Goto S (2006) Effect of gene flow on spatial genetic 601
structure in the riparian canopy tree Cercidiphyllum japonicum revealed by microsatellite 602
analysis. Heredity, 96, 79-84. 603
Smouse PE, Dyer RJ, Westfall RD, Sork VL (2001) Two-generation analysis of pollen flow 604
across a landscape. I. Male gamete heterogeneity among females. Evolution, 55, 260-271. 605
Smouse PE, Sork VL (2004) Measuring pollen flow in forest trees: an exposition of 606
alternative approaches. Forest Ecology and Management, 197, 21-38. 607
Sonke B. (1998). Etudes floristiques et structurales des forêts de la réserve de faune du Dja 608
(Cameroun). PhD thesis, Université Libre de Bruxelles. 609
Sork VL, Davis FW, Smouse PE, et al. (2002) Pollen movement in declining populations of 610
California Valley oak, Quercus lobata: where have all the fathers gone? Molecular Ecology, 611
11, 1657-1668. 612
For Review Only
Taylor DAR, Kankam BO (1999) The role of the straw-colored fruit bat, Eidolon helvum, in 613
seed dispersal, survival, and germination in Milicia excelsa, a threatened West African 614
hardwood. Northern Arizona University, Flagstaff (AZ) and Forestry Research Institute of 615
Ghana,Kumasi (Ghana). 616
Tondeur G (1939) Monographie forestière du Chlorophora excelsa Benth. et Hook. Bulletin 617
Agricole du Congo Belge, 30, 163-198. 618
Troupin D, Nathan R, Vendramin GG (2006) Analysis of spatial genetic structure in an 619
expanding Pinus halepensis population reveals development of fine-scale genetic clustering 620
over time. Molecular Ecology, 15, 3617-3630. 621
Van Oosterhout C, Hutchinson WF, Wills DPM, Shipley P (2004) MICRO-CHECKER: 622
software for identifying and correcting genotyping errors in microsatellite data. Molecular 623
Ecology Notes, 4, 535-538. 624
Vekemans X, Hardy OJ (2004) New insights from fine-scale spatial genetic structure analyses 625
in plant populations. Molecular Ecology, 13, 921-935. 626
White MG (1966) A comparison of Chlorophora excelsa (Welw.) Benth and Cook (F.) and C. 627
regia A. Chev., (Fam. Moraceae). The Commonwealth Forestry Review, 45, 150-153. 628
White F (1983). The vegetation of Africa. Natural resources research, UNESCO, Suisse. 629
White GM, Boshier DH, Powell W (1999) Genetic variation within a fragmented population 630
of Swietenia humilis Zucc. Molecular Ecology, 8, 1899-1909. 631
White GM, Boshier DH, Powell W (2002) Increased pollen flow counteracts fragmentation in 632
a tropical dry forest: An example from Swietenia humilis Zuccarini. Proceedings of the 633
National Academy of Sciences of the United States of America, 99, 2038-2042. 634
Williams CF (1994) Genetic consequences of seed dispersal in three sympatric forest herbs. 635
II. Microspatial genetic structure within populations. Evolution, 48, 1959-1972. 636
For Review Only
Young AG, Merriam HG (1994) Effects of forest fragmentation on the spatial genetic 637
structure of Acer saccharum Marsh (Sugar Maple) populations. Heredity, 72, 201-208. 638 639 640 641 642 643 644 645 646 647 648 649 650 651 652 653 654 655 656 657 658 659 660 661
For Review Only
Figure legends:662
Fig. 1 M. excelsa sample locations in Cameroon. 663
Fig. 2 Average kinship-distance curves, F(d), of each study population, Mindourou, Djoum, 664
Bellabo and Biyeyem.Unfilled symbols represent significant (P < 0.05) average kinship 665
coefficient values and bars represent standard errors estimated by jackknife. 666
667
668 669
For Review Only
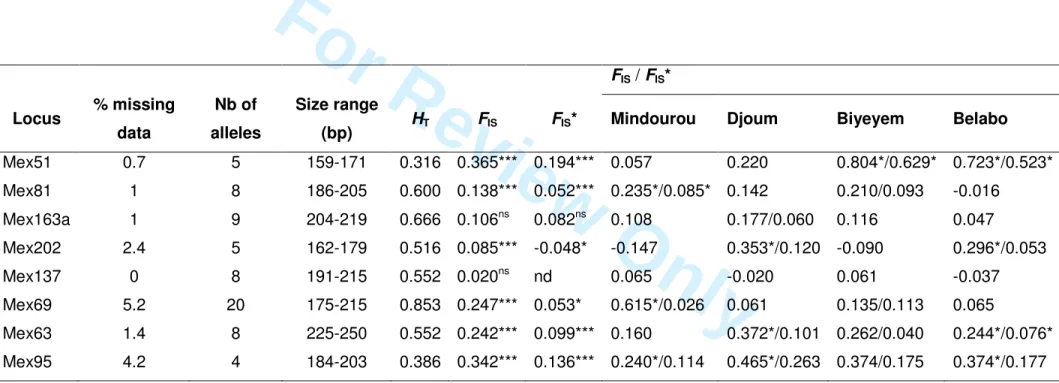
Table 1 Characteristics of microsatellite loci for M. excelsa: Number of alleles; size range; HT, expected heterozygosity; FIS, inbreeding
coefficient; FIS*, inbreeding coefficient following allele frequency adjustment according to van Oosterhout et al. (2004). Overall deviation from
Hardy-Weinberg genotypic proportions: ***P<0.001; *P<0.05. Within-population deviation from Hardy-Weinberg genotypic proportions: *, significant at a table-wide level of α=0.05 after sequential Bonferroni correction.
FIS / FIS* Locus % missing data Nb of alleles Size range
(bp) HT FIS FIS* Mindourou Djoum Biyeyem Belabo
Mex51 0.7 5 159-171 0.316 0.365*** 0.194*** 0.057 0.220 0.804*/0.629* 0.723*/0.523* Mex81 1 8 186-205 0.600 0.138*** 0.052*** 0.235*/0.085* 0.142 0.210/0.093 -0.016 Mex163a 1 9 204-219 0.666 0.106ns 0.082ns 0.108 0.177/0.060 0.116 0.047 Mex202 2.4 5 162-179 0.516 0.085*** -0.048* -0.147 0.353*/0.120 -0.090 0.296*/0.053 Mex137 0 8 191-215 0.552 0.020ns nd 0.065 -0.020 0.061 -0.037 Mex69 5.2 20 175-215 0.853 0.247*** 0.053* 0.615*/0.026 0.061 0.135/0.113 0.065 Mex63 1.4 8 225-250 0.552 0.242*** 0.099*** 0.160 0.372*/0.101 0.262/0.040 0.244*/0.076* Mex95 4.2 4 184-203 0.386 0.342*** 0.136*** 0.240*/0.114 0.465*/0.263 0.374/0.175 0.374*/0.177
For Review Only
Table 2 Estimates of population genetics and SGS parameters for each population. N, number of individuals sampled; HE, expected heterozygosity; FIS, inbreeding coefficient; FIS*,
inbreeding coefficient accounting for null alleles; F1, kinship coefficients between individuals
separated by less than 2 km; bLd (bLd40),slope of the regression of kinship coefficients on the
logarithm of spatial distance (between 0 and 40 km); Sp (40km), intensity of SGS calculated
for pairwise distances between individuals up to 40 km in each population; k, initial curvature
of the kinship-distance curve (see text); nd, not determined. Significance values: ns, not
significant; *P < 0.05; **P < 0.01; ***P < 0.001. Population N HE FIS FIS* F1 bLd bLd 40 Sp (40km)(SE) k Mindourou 104 0.553 0.184*** 0.060*** 0.022 -0.0063** -0.0062** 0.0063 (0.0016) >0 Djoum 54 0.531 0.198*** 0.093*** 0.035 -0.0101** -0.0037ns 0.0039 (0.0051) <0 Biyeyem 51 0.545 0.192*** 0.096** 0.013 -0.0014ns -0.0020ns 0.0020 (0.0019) nd Belabo 78 0.561 0.151*** 0.060*** 0.014 -0.0002ns -0.0002ns 0.0002 (0.0010) nd
For Review Only
Table 3 Gene dispersal distance (σg) and neighborhood size (Nb) estimates with respective
95% confidence intervals for the Mindourou and Djoum populations using three estimates of
effective densities (De = D/2, D/4, and D/10). Dispersal distances in bold represent average values for the iterative estimation method cycle (non-convergence of the method).
Population De Trees/km² σg (km) Nb Mindourou D/2 2.48 3.72 (2.12-∞) 432 (140-∞) Mindourou D/4 1.24 5.29 (2.77-∞) 436 (120-∞) Mindourou D/10 0.49 7.10 (4.16-∞) 310 (107-∞) Djoum D/2 9.8 1.01 (0.57-∞) 126 (40-∞) Djoum D/4 4.9 2.22 (0.82-∞) 303 (42-∞) Djoum D/10 1.96 2.64 (1.04-∞) 171 (27-∞)
For Review Only
Fig. 1: M. excelsa sample locations in Cameroon. 168x119mm (600 x 600 DPI)
For Review Only
Fig. 2: Average kinship-distance curves, F(d), of each study population, Mindourou, Djoum, Bellabo and Biyeyem. Unfilled symbols represent significant (P < 0.05) average kinship coefficient values
and bars represent standard errors estimated by jackknife 168x119mm (600 x 600 DPI)