S E Biotechnol. Agron. Soc. Environ. 2012 16(3), 307-315
Status of medium-sized ungulate populations in 2010, at
the Nazinga Game Ranch, Burkina Faso (Western Africa)
Antoine Marchal
(1), Philippe Lejeune
(1), Philippe Bouché
(1), Moumouni Ouédraogo
(2),
Prosper Sawadogo
(3), Dieu-Donné Yaméogo
(3), Frédérique Yanogo
(3), Cédric Vermeulen
(1) (1) Univ. Liège - Gembloux Agro-Bio Tech. Department of Forest, Nature, Landscape. Forest and Nature Management Unit. Passage des Déportés, 2. B-5030 Gembloux (Belgique). E-mail: marchal.ant@gmail.com (2) African Wildlife Foundation. Parc W Heartland. Burkina Faso. (3) Office National des Aires Protégées. Burkina Faso. Received on May 26, 2011; accepted on January 18, 2012. The present study consists of analyzing the raw data collected from the annual line-transect foot count of medium-sized ungulates, carried out at the Nazinga Game Ranch (NGR), Burkina Faso (Western Africa), in both 2001 and 2010. The annual census focused on the seven main medium-sized ungulates, namely (in alphabetical order), the Bushbuck (Tragelaphus scriptus), the Common Warthog (Phacochoerus africanus), the Defassa Waterbuck (Kobus ellipsiprymnus), the Grimm’s Duiker (Sylvicapra grimmia), the Oribi (Ourebia ourebi), the Roan Antelope (Hippotragus equinus) and the Western Hartebeest (Alcelaphus buselaphus). The census also focused on illegal anthropogenic activities. The wildlife populations were quantitatively analyzed through an estimation of their absolute density via the distance sampling method and through their evolution over the last decade using two relative density indexes, namely the Kilometric Abundance Index (KAI) and a spatial distribution index. These indexes were also used to measure the evolution of illegal activities over the same period. Both the wildlife observations and the anthropogenic observations were mapped using the Kernel method. Following an increasing trend in their population between 2001 and 2010, both the Roan Antelope and the Western Hartebeest reached an estimated density of 4.7 individuals per km², while the Defassa Waterbuck reached 2.4 individuals per km². Following an inverse trend over the same period, the Bushbuck, the Grimm’s Duiker and the Oribi reached an estimated density of 0.4 individuals per km². As for the Common Warthog, its estimated density of 2.5 individuals per km² seemed to remain unchanged during that decade. A comparison between wildlife observations and anthropogenic observations reveals a high decrease in animal densities in the north, east and west peripheral borders of the NGR and a flagrant extension of the proportion of the ranch being subjected to illegal activities (poaching, cattle herding, etc.). Keywords. Wildlife, game reserves, ungulates, monitoring, illegal practices, Burkina Faso.Le statut des populations d’ongulés de taille moyenne en 2010, Ranch de Gibier de Nazinga, Burkina Faso (Afrique de l’Ouest). La présente étude consiste en l’analyse des données brutes issues de l’inventaire pédestre annuel par transects en lignes des ongulés de taille moyenne, effectué au Ranch de Gibier de Nazinga en 2001 et en 2010. Le recensement s’est focalisé sur les sept principaux ongulés de taille moyenne, à savoir (dans l’ordre alphabétique), le bubale (Alcelaphus buselaphus), le céphalophe de Grimm (Sylvicapra grimmia), le cobe defassa (Kobus ellipsiprymnus), le guib harnaché (Tragelaphus scriptus), l’hippotrague (Hippotragus equinus), le phacochère (Phacochoerus africanus) et l’ourébi (Ourebia ourebi), ainsi que sur les activités anthropiques illégales. Les populations animales ont été analysées quantitativement par l’estimation de leur densité absolue via la méthode distance sampling et par l’évolution au cours de la dernière décennie de deux indices de densité relative, à savoir l’Indice Kilométrique d’Abondance (IKA) et un indice de distribution spatiale. Ces deux indices ont aussi été utilisés pour mesurer l’évolution des activités illégales sur la même période. Les observations fauniques et les activités anthropiques ont été spatialisées par la méthode de Kernel. À l’issue d’une augmentation de leur population sur la décennie, l’hippotrague et le bubale ont atteint une densité estimée à 4,7 individus par km², alors que celle du cobe defassa a atteint 2,4 individus par km². Au terme d’une tendance inverse, le guib harnaché, le céphalophe de Grimm et l’ourébi atteignent aujourd’hui une densité réduite estimée à 0,4 individus par km² pour la même période. Quant au phacochère, sa densité estimée à 2,5 individus par km² semble ne pas avoir changé sur la dernière décennie. La mise en parallèle des distributions fauniques et anthropiques a révélé une forte réduction des densités animales à la périphérie nord, est et sud et une extension inquiétante de la portion du ranch soumise aux activités illégales (braconnage, pâturage, etc.). Mots-clés. Faune sauvage, réserve de gibier, ongulés, surveillance, pratique illégale, Burkina Faso.
resources (Cornélis, 2007).
Since the foundation of the ranch in 1979, its aim has been to fulfill its original objective of being financially self-sufficient by integrating the local people into both the management structure and the sharing of ranch benefits (Portier et al., 2007). To this end, the main activities offered by the NGR are game viewing, sport hunting and game cropping for meat (Belemsobgo et al., 1998). To facilitate the co-existence of these activities, the NGR undertakes ecological monitoring mainly based on an annual line-transect foot count of the main medium-sized ungulates. Originally designed to estimate the absolute abundance of the most common species of mammals using the distance sampling method, the sampling plan also facilitates the collection of data on illegal anthropogenic activities.
This study aims to analyze and to map the census data from 2010 at NGR for the seven main ungulates, classified (in alphabetical order) as the Bushbuck (Tragelaphus scriptus [Pallas, 1766]), the Common Warthog (Phacochoerus africanus [Gmelin, 1788]), the Defassa Waterbuck (Kobus ellipsiprymnus [Rüppell, 1833]), the Grimm’s Duiker (Sylvicapra grimmia [Linnaeus, 1758]), the Oribi (Ourebia ourebi [Zimmermann, 1783]), the Roan Antelope (Hippotragus equinus [E. Geoffrey Saint-Hilaire, 1803]) and the Western Hartebeest (Alcelaphus buselaphus [Pallas, 1766]). The study also aims to map data provided by the census regarding anthropogenic activities. The choice of these species for this study was mainly based on the fact that they represent the most hunted – consequently the most economically important – species at the NGR. The chosen species were the ones for which we registered sufficient contacts in order to apply the distance sampling method (Buckland et al., 1993; Cornélis, 2007).
The distance sampling method (Buckland et al., 1993) was used to assess the population densities in both 2001 and 2010. Two relative density indexes, namely the Kilometric Abundance Index (KAI) and a spatial distribution index were used to observe the trends over the decade (from 2001 to 2010). These indexes were also used to measure the evolution of illegal activities over the same period. The data analysis was completed by the mapping of both the wildlife and the anthropogenic observations, via the Kernel method (Worton, 1999).
(Figure 1). The ranch is situated between the latitudes of 11°00’N and 11°18’N, and the longitudes of 01°16’W and 01°43’W (Belemsobgo et al., 1998).
Falling within the tropical savannah of Köppen-Geiger (Kottek et al., 2006), the NGR had a mean annual temperature of 28 °C between 2000 and 2010 (MSP, 2010). In the same period the mean annual rainfalls ranged from about 730 to 1,230 mm (MSP, 2010). The climatograph for the NGR (MSP, 2010) shows a dry period beginning in November, lasting until April. The wettest months are July and August, and generally no rainfall is registered in December and January.
As part of the Sudanese regional centre of endemism (White, 1983), the NGR shows a high proportion (47.4%) of clear shrub savannah characterized by Vitellaria paradoxa C.F.Gaertn., Terminalia spp., Acacia dudgeoni Craib ex Holland, Gardenia erubescens Stapf & Hutch., and Pteleopsis suberosa Engl. & Diels, in which the dominating perennial herbaceous species are Andropogon spp. and Schizachyrium sanguineum (Retx.) Alston. (Dekker, 1985). The tree savannah with Afzelia africana Sm. ex Pers., Anogeissus leiocarpa (DC.) Guill. & Perr. and Lannea acida A.Rich. represents 25.4% of the total area (Dekker, 1985). One principal watercourse, the Sissili River, and its two affluents, the Dawevele and the Nazinga Rivers, serve to drain temporarily the main watersheds of the NGR (Belemsobgo et al., 1998; Leclercq et al., 2007). With the aim of enhancing the fauna-carrying capacity of the ranch, 11 artificial dams have been built, most of them on the three rivers mentioned above (Leclercq et al., 2007). About 12 Burkinabe villages surround the NGR and are situated close to its boundaries (Vermeulen et al., 2007) (Figure 1).
2.2. Counting
A line-transect foot count (Buckland et al., 1993) was carried out in the second half of February 2010. This survey involved 13 census teams over seven days. One leader and two observers constituted a survey team. The team leader maintained the bearing along a transect through the use of a Global Positioning System (GPS). All observations of wildlife and anthropogenic activities were recorded and geo-referenced using the GPS. The leader and the two observers were in charge of spotting and counting observations. When a wild animal (or herd) was spotted, the angle of
observation and the radial distance were measured, using respectively a compass (Suunto type) and a laser range-finder (Bushnell) (Portier, 2001). It is important to note that this counting methodology has followed more or less the same guidelines since 1984 (Portier, 2001). This obviously allows, with certain considerations, data comparisons over the years. 2.3. Sampling plan
Thirty-four parallel transects of south-north orientation have been systematically defined on the ranch area (Portier, 2001). The first transect was chosen randomly and the other lines were placed equidistantly at 1.4 km from the previous transect (Portier, 2001). The study area was divided into seven blocks in accordance with the main roads, and with the aim of being able to survey one block per day. This division provides areas of line-transect, which can be covered from early to late morning, just before the temperature gets too hot (Portier, 2001). The sampling effort traversed was 691,756 m. 2.4. Data analysis Census data were analyzed according to the distance sampling method (Burnham et al., 1980; Buckland et al., 1993; Buckland et al., 2001) to provide the absolute density of the seven targeted species. The use of a distance sampling method using line-transects is based on the fact that the probability of detecting an animal decreases with the perpendicular distance to the transect (Buckland et al., 1993). In addition to the guidelines set by the original authors regarding model selection (Buckland et al., 1993; Thomas et al., 2002), we also followed the steps recommended by Jachmann (2001). Beyond the selection by a statistical test, such as the Akaike’s Information Criterion or the likelihood ratio test, the Jachmann steps allow the user to find a model that provides results closer to the reality (Bouché, 2008a).
Wildlife observations and anthropogenic observations were mapped using the Kernel method. In this method, a density function analyzes the distribution and the measured quantity of the objects (wildlife or Figure 1. Location of Burkina Faso in Africa (inset 1), location of Nazinga Game Ranch (NGR) in Burkina Faso (inset 2) and general map of NGR — Localisation du Burkina Faso en Afrique (encadré 1), localisation du Ranch de Gibier de Nazinga (RGN) au Burkina Faso (encadré 2) et carte générale du RGN.
0 2 4 8 12 16 km N Legend Perimeter (97,434 ha) Extension of 2000 Extension of 2003 Rivers Main road Inner roads Outer roads Dams Camp Peripheral villages
group (Worton, 1999; Cornélis, 2007). The two rasters were then compared by means of a correlation matrix (Dagnelie, 2006). This aims to provide more than the visual observations of the distribution by means of the interpretation of correlation coefficients. The current absolute densities were compared to the 2001 results by means of a d-test (Bailey, 1995). This test allows us to determine whether two population estimates are statistically different, and is in fact based on the Student’s t-test (Dagnelie, 2006). In addition, a comparison of the same two years was carried out using the KAI and a spatial index, named here as the mean Relative Density Index (mean RDI). In order to obtain the RDI, the distributions of the density frequencies computed via Kernel were divided into five classes of equal range with the maximum density of the period designated as the supremum (Cornélis, 2007). Density classes were then expressed in terms of a Relative Density Index increasing from 1 to 5 (Cornélis, 2007). Thus the mean Relative Density Index represents the relative importance of every class of density calculated by the Kernel method for a specific year (Cornélis, 2007).
3. RESULTS
3.1. Large mammal populations in 2010
A total of 313 contacts with wild animals were recorded. Of these, 247 contacts were with the seven targeted species. The Roan Antelope and the Western Hartebeest showed the highest estimated densities with respectively 4.81 (28.4 CV%) and 4.7 (24.8 CV%) individuals per km². The Common Warthog and the Defassa Waterbuck represented respectively approximately 2.47 (36.5 CV%) and 2.41 (32.6 CV%) individuals per km². The Bushbuck, the Grimm’s Duiker and the Oribi represented respectively approximately 0.43 (35.3 CV%), 0.4 (43.5 CV%) and 0.4 (34 CV%) individuals per km² (Table 1).
3.2. Large mammals and anthropogenic activity distributions in 2010
The distribution of the seven main species (Figure 2) showed a core of high density (between ca 8.47 and 10.59 individuals per km²) located close to the Sissili River, east of the Boudjoro Dam and south of the Central Dam (Figure 1). Overall, most of the observations were
recorded south-west of the main road crossing straight through the ranch from the east (i.e. where the main entrance is situated in the village of Walem) to the west (i.e. at the Akwazena Dam, where the main camp is situated) (Figure 1).
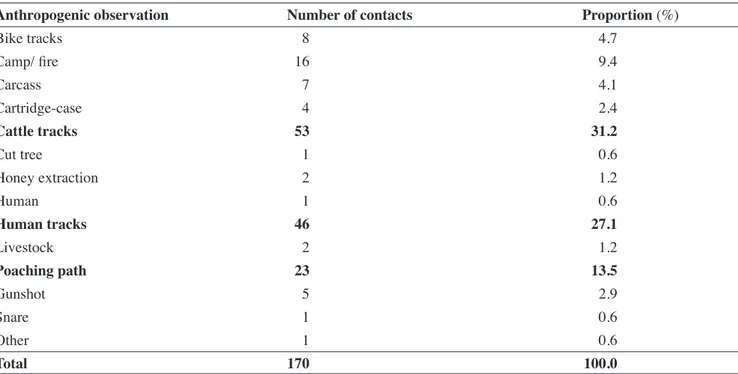
Anthropogenic activities (Figure 2) were concentrated in the extreme south-east part of the NGR, exactly at the location of the extension added to the ranch in 2000 (Figure 1). Two other fronts of illegal activity are shown by the symbols; one is in the north area and the other one in the south-west area of the ranch. Furthermore we can observe a vacuum of illegal activities along the main road, which is the road at the NGR most frequented by tourists and hunters. Evidence of illegal activities was found mainly through the presence of cattle tracks (31.2%), human tracks (27.1%), and poaching paths (13.5%) (Table 2).
3.3. Correlation between wildlife and anthropogenic activity distributions in 2010
A comparison between the distributions of the wildlife observations and the anthropogenic observations gave a correlation factor of -0.1 in 2010 (Figure 2). This correlation factor indicates that the two distributions do not overlap but that the anthropogenic activities increasingly push centripetally the wildlife into their place of quietude. Furthermore this shows the negative impact of anthropogenic activities on the wildlife there. 4. DISCUSSION
4.1. Temporal comparison with 2001
Between 2001 and 2010, the comparison of the absolute densities showed an increasing trend for the Defassa sept espèces principales (in alphabetical order).
Species N D CV % Bushbuck 414 0.43 35.3 Common Warthog 2,411 2.47 36.5 Defassa Waterbuck 2,480 2.41 32.6 Grimm’s Duiker 388 0.40 43.5 Oribi 392 0.40 34.0 Roan Antelope 4,685 4.81 28.4 Western Hartebeest 4,577 4.70 24.8
0 1.5 3 6 9 12 km N Legend Perimeter Wildlife observations Anthropogenic observations
Density of anthropogenic observations (contact.km2) Density of wildlife observations (individual.km2)
Roan Antelope Western Hartebeest Defassa Waterbuck Common Warthog Bushbuck Grimm’s Duiker Oribi 0-2.12 2.12-4.24 4.24-6.35 6.35-8.47 8.47-10.59 Cattle track Man track Poaching path Other 0-0.27 0.27-0.54 0.54-0.81 0.81-1.08 1.08-1.34 Figure 2. Distribution map of the wildlife observations (for the seven main species) and the anthropogenic observations in 2010; the borders of Nazinga Game Ranch are the ones from before 2003 — Carte de distribution des observations de faune (pour les sept espèces principales) et des observations anthropiques en 2010 ; les frontières du Ranch de Gibier de Nazinga sont celles d’avant 2003.
Table 2. Number of contacts and their proportions for anthropogenic activities in 2010 — Nombre de contacts et proportions des activités anthropiques en 2010.
Anthropogenic observation Number of contacts Proportion (%)
Bike tracks 8 4.7 Camp/ fire 16 9.4 Carcass 7 4.1 Cartridge-case 4 2.4 Cattle tracks 53 31.2 Cut tree 1 0.6 Honey extraction 2 1.2 Human 1 0.6 Human tracks 46 27.1 Livestock 2 1.2 Poaching path 23 13.5 Gunshot 5 2.9 Snare 1 0.6 Other 1 0.6 Total 170 100.0
The values in bold represent the three main categories of anthropogenic observations — Les valeurs en gras représentent les trois
Grimm’s Duiker and the Oribi (Figure 3 and Table 3). Their multiplication factors were respectively 0.43, 0.64 and 0.57 (Table 3). Again, the trend is confirmed by the relative densities (Table 3). For the Common Warthog, the d-test showed a non-significant difference between the absolute densities of 2001 and 2010 (Table 3). This result is confirmed by the evolution of both the KAI and the mean RDI, for which the factors were respectively 0.90 and 0.99, thus almost equal to 1 (Table 3). The d-test showed that only the populations of the Bushbuck, the Defassa Waterbuck and the Western Hartebeest were significantly (p = 0.95) different between 2001 and 2010 (Table 3). The Oribi and the Roan Antelope populations over the decade were different for a p value equal to 0.90, the Grimm’s Duiker with a p value of 0.80 and the Common Warthog with a p value of 0.70 (Table 3).
4.2. Comparison with other protected areas
A comparison with other protected areas elsewhere in Africa establishes the status and the potentiality of the NGR. In order to make this comparison as objective as possible, the areas chosen for comparison hosted similar habitats (Sudano-Sahelian region) and wildlife;
they were covered by surveys for the same species and analyzed using the same method (line-transects).
The selected protected areas were: in Benin, the Pendjari National Park (Sinsin et al., 2002); in Burkina Faso, the Singou Hunting Area (Crosmary, 2006) and the Konkombouri Hunting Area (Bouché, 2008b); in Cameroon, the Waza National Park (Scholte et al., 2007) and, in the Central African Republic (CAR), a cluster of five Community Hunting Zones (Bouché, 2009).
Despite the fact that the climatic conditions in the CAR are more favorable, our analysis showed that the total density is lower and all species, excluding the Bushbuck and the Grimm’s Duiker, have a higher density at the NGR (Table 4). With about the same amount of rainfall as NGR, Konkombouri Hunting Area carries a higher total density than NGR for these seven species (Table 4). However the densities of Defassa Waterbuck and Western Hartebeest are both higher at the NGR (Table 4). The low densities of small mammals (Bushbuck, Grimm’s Duiker and Oribi) at NGR, which are nearly similar to those of the CAR (Bushbuck and Oribi), reveal the high pressure on these Wester n Hartebeest Bushbuck Oribi CommonWarthog Defassa
Waterbuck Grimm’ s Duiker Roan Antelope 2001 2010 9 8 7 6 5 4 3 2 1 0 Estimated density (individual . km-2) and CI 95%
Figure 3. Comparison between 2001 and 2010 of the absolute density (individuals.km-²) for the seven main species (in alphabetical order) — Comparaison des densités absolues (individus.km-²) entre 2001
et 2010 pour les sept espèces principales (par ordre alphabétique).
en utilisant la densité absolue (D), l’Indice d’Abondance Kilométrique (IKA) et l’Indice de Densité Relative Moyen (IDR Moyen) pour les 7 espèces (par ordre alphabétique).
Species Method
D d-test (p) KAI Mean RDI
Bushbuck 0.43 0.95 0.73 0.99 Common Warthog 1.28 0.70 0.90 0.99 Defassa Waterbuck* 2.89 0.95 1.99 1.03 Grimm’s Duiker 0.64 0.80 0.64 0.85 Oribi 0.57 0.90 0.32 0.73 Roan Antelope 1.79 0.90 1.62 1.77 Western Hartebeest 7.08 0.95 2.21 1.07 * between 2003 and 2010 — entre 2003 et 2010.
animals probably caused by poaching. The Singou Hunting Area also showed lower densities than NGR for the Common Warthog, the Defassa Waterbuck, the Oribi and the Roan Antelope (only species studied) (Table 4). The Pendjari National Park presented higher densities than NGR for Grimm’s Duiker and Oribi, but all the other species in the Pendjari National Park were found in lower densities (Table 4).
East (1999) estimated the Roan Antelope population of Burkina Faso at more than 7,370 individuals. This shows the importance of NGR in the preservation of this species, which was estimated at 2,483 in 2001 and 4,685 in 2010 (Table 1 and Figure 3). The populations of Roan Antelope in Pendjari National Park, Singou Hunting Area, Waza National Park and the cluster of CAR’s Community Hunting Areas were respectively as low as 0.77, 0.24, 0.29 and 0.51 individuals per
km2 (Table 4), while
Konkombouri Hunting Area and NGR showed densities of 8.14 and 4.81 individuals
per km2 (Table 4).
4.3. Environmental and human factors explaining ungulate trends
The increase in the large species (Roan Antelope, Western Hartebeest and
Defassa Waterbuck)
populations between 2001 and 2010 can be explained by several factors.
Contrary to many other protected areas in West Africa, NGR shelters a homogenous and permanent
water-point network,
which favors an increase in
Table 4. Comparison of the estim ated density (D) and coefficien t of variation in percentage (CV %) for the seven main species (in alphab etical order) between Nazinga Game Ranch and five other protected areas from the Sudano-Sahelian region — Comparaison des densités estimées (D) et des coefficients de variations (CV %) pour les
sept espèces principales (par or
dr
e alphabétique) entr
e le Ranch de Nazinga et cinq autr
es zones pr
otégées de la zone soudano-sahélienne.
Ar
ea
Nazinga Game Ranch Pendjari National Park Konkombouri Hunting Area Singou Hunting Area
W
aza National
Park
Five Community Hunting
Ar eas Size 970 km² 2,660 km² 655 km² 1,800 km² 1,700 km² 4,913 km² Country Burkina Faso Benin Burkina Faso Burkina Faso Camer oon Central African Republic Study This study Sinsin et al., 2002 Bouché, 2008b Cr osmary , 2006 Scholte et al., 2007 Bouché, 2009
Type and year
of survey Foot count, 2010 Foot count, 2000 Foot count, 2008 Vehicle count, 2006 Foot count, 2000 Foot count, 2009 Rainfall . year -1 950 mm 1,000 mm 900 mm 750-1,000 mm 650 mm 1,000-1,300 mm Species D CV% D CV% D CV% D CV% D CV% D CV% Bushbuck 0.43 35.3 0.22 -1.1 1 40.81 -EXT -0.82 18.82 Common W arthog 2.47 36.5 0.66 -2.44 40.07 0.64 26 -2.18 15.71 Defassa W aterbuck 2.41 32.6 0.03 -0.92 94.56 0.18 25 EXT -0.09 -Grimm’ s Duiker 0.40 43.5 0.92 -3.15 19.23 -2.35 11.08 Oribi 0.40 34.0 0.67 -8.14 15.71 1.72 13 -0.27 33.97 Roan Antelope 4.81 28.4 0.77 -8.14 32.15 0.24 20 0.29 -0.51 40.48 W estern Hartebeest 4.70 24.8 0.56 -2.09 56.91 -EXT -1.02 26.55 Total 15.62 3.84 25.99 -7.24 Values in bold represent the highest density for each species amongst the areas —
les valeurs en gras r
eprésentent les densités maximales des espèces entr
e les zones ; “-ˮ: value not available —
valeur non disponible
; EXT : means that the species are extinct —
les espèces sont éteintes
Roan Antelope and Western Hartebeest are quite shy and very alert antelopes, making them fairly resistant to poaching (Estes, 1991).
Carcasses of large species killed by poachers are difficult to hide and to transport (Bouché et al., 2004). These carcasses must be processed and smoked in the field, which requires time and discretion by the poachers. Their illegal activities are disturbed by game viewing tourists, safari hunting and anti-poaching activities at least in the western half of the ranch area. Waterbuck meat is one of the less appreciated African game meats because of its strong odor (Spinage, 1982; Kingdon, 1997), making it a less targeted species by poachers. Poachers prefer to target smaller species, which are easier to hide and to process, such as Bushbuck, Duikers (Grimm’s Duiker and Red-flanked Duiker Cephalophus rufilatus), Oribi and Common Warthog. In contrast with Bushbuck, Oribi and Duikers, the Common Warthog is a prolific species (Kingdon, 1997), with its numbers seemingly stable since 2001, suggesting that their illegal mortality is compensated by their births. Despite the increase in large species populations, large mammals are restricted to the western half of the ranch area (Figure 2). This suggests that despite the water availability in the eastern half during the dry season, wildlife do not find this area sufficiently quiet. Consequently the current large mammal densities could be larger if the eastern half of the ranch were properly managed.
In the 1980s, NGR’s management practices and that of other areas in West Africa, showed that if appropriate water availability, law enforcement, burning management and community based wildlife management are met, wildlife densities can reach a far higher level than those currently found at the NGR (Portier et al., 2007; Bouché, 2008b). NGR shelters the highest Defassa Waterbuck and Western Hartebeest density of West Africa and one of the highest for Roan Antelope. This could be explained by the fact that for several decades, management infrastructure (water-points) has been present as well as the absence of large predators in Nazinga (Bouché, 2008b). Defassa Waterbuck and Western Hartebeest are known to be among the favorite prey of lions (Schaller, 1972; Spinage, 1982; Estes, 1991; Breuer, 2005).
These results suggest that several NGR wildlife populations are far from reaching their respective carrying capacities. Illegal activities threaten the eastern part of the ranch, causing the depletion of
Acknowledgements
The authors thank the OFINAP (“Office National des Aires Protégées”), which is the institution in charge of the Nazinga Game Ranch, the Non Governmental Organization Nature-plus, which provided a vehicle, and finally the Forest and Nature Management Unit of Gembloux Agro-Bio Tech, University of Liege for its financial support. Enormous gratitude goes to Carine du Toit and Clinton Wright for their useful comments on earlier versions of this manuscript. Last but not least, we are extremely grateful to the managing board of the Ranch together with all the participants of the 2010 survey.
Bibliography
Bailey N.T.J., 1995. Statistical methods in biology. 3rd ed. Cambridge, UK: Cambridge University Press.
Belemsobgo U. & Lartiges A., 1998. Le modèle Nazinga. In : Sournia G., ed. Les aires protégées d’Afrique francophone. Paris : Éditions Jean-Pierre de Monza. Bouché Ph., 2008a. Méthodes d’inventaire de la grande
faune à l’usage des ZCV. Bangui : ECOFAC.
Bouché Ph., 2008b. Recensement pédestre des grands mammifères de la zone de chasse de Konkombouri. Burkina Faso. Avril-mai 2008. PMZCK/2008/01. Ouagadougou : Burkina Safari Club.
Bouché Ph., 2009. Inventaires des grands mammifères dans les zones cynégétiques villageoises du Nord de la République Centrafricaine. Rapport Programme ECOFAC IV. Bangui : ECOFAC.
Bouché Ph. & Lungren C.G., 2004. Les petites populations d’éléphant du Burkina Faso. Statut, distribution et déplacement. Pachyderm, 37, 85-91.
Breuer T., 2005. Diet choice of large carnivores in northern Cameroon. Afr. J. Ecol., 43, 97-106.
Buckland S.T., Anderson D.R., Burnham K.P. & Laake J.L., 1993. Distance sampling. Estimating abundance of biological populations. London, UK: Chapman and Hall. Buckland S.T. et al., 2001. Introduction to distance
sampling. London: Oxford University Press.
Burnham K.P., Anderson D.R. & Laake J.L., 1980. Estimation of density from line transect sampling of biological populations. Wildl. Monogr., 72, 1135-1142. Cornélis D., 2007. Le suivi écologique. In : Delvingt W. &
Vermeulen C., eds. Nazinga. Gembloux, Belgique : Les Presses agronomiques de Gembloux, 227-246.
Crosmary W., 2006. Comptage en action de chasse. Zone cynégétique du Singou, Burkina Faso. Rapport
de mission. Paris : Fondation Internationale pour la Sauvegarde de la Faune.
Dagnelie P., 2006. Statistique théorique et appliquée. Tome 2. Inférence statistique à une et à deux dimensions. 2e ed. Bruxelles : De Boeck.
Dekker A.J.F.M., 1985. Carte de paysage de la région du Ranch de Gibier de Nazinga, Burkina Faso. PNUD/ FAO, DP/BKF/82/008. Ouagadougou : Adefa.
East R., 1999. African antelope database 1998. Gland, Switzerland; Cambridge, UK: IUCN.
Estes R.D., 1991. The behavior guide to African mammals. Berkeley, CA, USA: University of California Press. Jachmann H., 2001. Estimating abundance of African
wildlife: an aid to adaptive management. Boston, MA, USA: Kluwer Academic Publishers.
Kingdon J., 1997. The Kingdon field guide to African mammals. London, UK: Academic Press.
Kottek M. et al., 2006. World map of the Köppen-Geiger climate classification updated. Meteorol. Z., 15, 259-263. Leclercq V. & Lungren C., 2007. Les barrages et la pêche.
In : Delvingt W. & Vermeulen C., eds. Nazinga. Gembloux, Belgique : Les Presses agronomiques de Gembloux, 195-213.
MSP, 2010. Meteorological Station of Pô, Burkina Faso. Ouagadougou : Direction de la Météorologie du Burkina.
Portier B., 2001. Avis technique n°12. Analyse préliminaire des données de l’inventaire pédestre d’avril 2001 au ranch de gibier de Nazinga. Ouagadougou : Projet de valorisation scientifique du ranch de gibier de Nazinga. Portier B. & Lungren C., 2007. La faune et le ranching
au Burkina Faso. In : Delvingt W. & Vermeulen C., eds. Nazinga. Gembloux, Belgique : Les Presses agronomiques de Gembloux, 33-44.
Schaller G.B., 1972. The Serengeti lion: a study on predator-prey relations. Chigago, IL, USA: University Press. Scholte P., Adam S. & Serge B.K., 2007. Population trends
of antelopes in Waza National Park (Cameroon) from 1960 to 2001: the interacting effects of rainfall, flooding and human interventions. Afr. J. Ecol., 45, 431-439. Sinsin B., Tehou A.C., Daouda I. & Saidou A., 2002.
Abundance and species richness of larger mammals in Pendjari National Park in Benin. Mammalia, 66, 369-380.
Spinage C.A., 1982. A territorial antelope: the Uganda waterbuck. London: Academic Press.
Thomas L. et al., 2002. Distance sampling. In: El-Shaarawi A.H. & Piegorsch W., eds. Encyclopedia of environmetrics. Chichester, UK: John Wiley & Sons Ltd, 544-552.
Vermeulen C. & Michaux J.F., 2007. Les populations riveraines du ranch de Nazinga : anthropologie politique, aménagement des terroirs et zones villageoises de chasse. In : Delvingt W. & Vermeulen C., eds. Nazinga. Gembloux, Belgique : Les Presses agronomiques de Gembloux, 270-290.
White F., 1983. The vegetation of Africa. A descriptive memoir to accompany the Unesco/AETFAT/UNSO vegetation map of Africa. Paris : UNESCO.
Worton B.J., 1999. Kernel methods for estimating the utilization distribution in home-range studies. Ecology, 80, 164-168.