Original scientific paper 10.7251/AGRENG1703078B UDC: 631.147(493)
RECENT EVOLUTION OF THE CONSUMPTION OF ORGANIC
FOOD PRODUCTS IN BELGIUM
Philippe BURNY
Walloon Center for Agricultural Research, Gembloux, Belgium *Corresponding author: p.burny@cra.wallonie.be
ABSTRACT
The consumption of organic food products in Belgium increased significantly and continuously between 2008 and 2016, growing from 1.5 % to 3.2% of the total consumers’ expenses for fresh food products. Nine percent of Belgian families buy organic food products at least once per week and represent 60% of the total expenses. The total expenses per capita reached nearly 33€ in 2015. The main expenses concerned dairy products (6.72 €/capita), vegetables (5.57) and fruits (4.40). These expenses have been globally increasing. The market share of organic products considerably varies from one type of food products to another: it is the highest for meat substitutes (24.6% in 2016) and eggs (14.0%), while it reaches 3.0% for dairy products, 6.6% for vegetables and 4.3% for fruits. These percentages have been globally increasing during the last years. Vegetable products have been proportionally more sold than animal products compared to the situation in the conventional market. Supermarkets and specialized shops are the most common distribution channels, direct sales on farms and open markets remaining marginal. Families with high income and children and retired people with high income are those who spend the most on organic food products. This evolution is supported by the Walloon government through the organic farming development plan.
Keywords: organic products, food consumption, Belgium, evolution.
INTRODUCTION
After several decades of an ever greater use of chemical inputs in agriculture, in order to increase the production of food to satisfy an ever increasing demand, several important pollution problems appeared and organic farming began to become an alternative during the 1980’s. After a slow development, the evolution became more and more rapid and today organic farming is considered as one of the solutions to get a more sustainable world (Burny et al., 2016; Petrescu et al., 2015; Petrescu-Mag et al., 2016). Organic farming has so to be placed in a broader context, taking into account rural development, environment and society (Daugbjerg and Sønderskov, 2012), the relation between agriculture and environment becoming a priority of EU and international policies (Brezuleanu et
al., 2013; Gazquez-Abad et al., 2011). However, the success of organic farming depends not only on production, but also on consumption, which is not obvious, as prices of organic products are significantly higher than the prices of conventional ones. However, in the developed and richest countries, organic products are more and more successful among consumers, because they think organic food could protect their health and the environment (Petrescu and Petrescu-Mag, 2015) or have better sensory attributes (Bryla, 2016; Tobler et al., 2011).
Below is presented and discussed the evolution of the consumption of organic products in Belgium, trying to answer questions like: what is the evolution of the market share of organic products in the total food market? What is the market share of organic products in different types of food products? What are the expenses per capita and per year for the main organic food products? What are the main distribution channels of organic food products?
MATERIALS AND METHODS
The main statistical data are extracted from the annual report “Les chiffres du bio” published by Biowallonie asbl, the association of stakeholders officially representing the organic sector in Wallonia (South of Belgium). The data concerning consumption of organic products come from a survey organised by the private company GFK, working for the Belgian institutions in charge of the promotion of agricultural products (VLAM in Flanders and APAQ-w in Wallonia). The survey is done in such a way that it meets the requirements to be statistically representative of the Belgian population, according to several social economic criteria. Documents also come from the Walloon regional government and administration.
RESULTS AND DISCUSSION
Market share of organic products in the Belgian food market
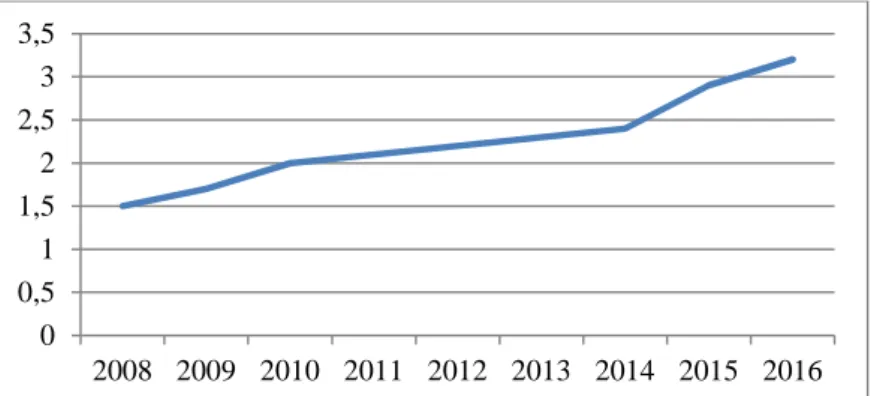
The market share of organic products in the Belgian food market continuously increased between 2008 and 2016, from 1.5 to 3.2% (Figure 1).
Figure 1. Evolution of the market share of organic products in the Belgian food market (%)
*Source of basic data: Biowallonie (2017) 0 0,5 1 1,5 2 2,5 3 3,5 2008 2009 2010 2011 2012 2013 2014 2015 2016
Organic food products, though more expensive than conventional products, are more and more popular; this phenomenon even accelerated during the last two years. In the future, this share could continue to increase as it reached 8.4% in Denmark in 2015 (the highest in Europe) or 7.7% in Switzerland and 4.8% in Germany (Biowallonie, 2017). So, the target of 3.0% in 2020 defined in the Walloon development plan for organic farming is already reached.
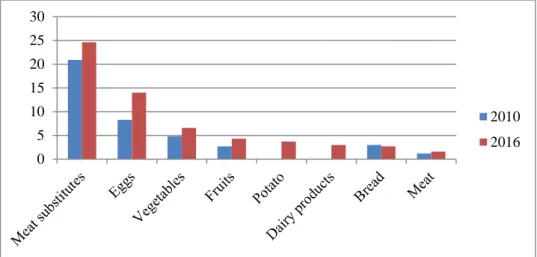
The market share of organic products is very variable according to the type of products (Figure 2). However, it increased for all products with the exception of bread. As prices are very different from one product to another, the position of one product regarding the market share can be different from the position regarding expenses per capita. The highest market shares are observed for meat substitutes (a product which is not popular) and eggs (a cheap product), before vegetables and fruits, which are well known organic products. The market share for dairy products reached 3.0% while the expenses for dairy products are the highest, the prices per unit being higher than for other food products. Globally, the share of vegetal products is highest in the organic food market than in the conventional one.
Compared to the situation of 2010, it appears that the market shares significantly increased, with the exception of bread. For dairy products, data are available for 2014, 2015 and 2016, showing an important increase: 2.1% in 2014, 2.7% in 2015 and 3.0% in 2016. For potato, no trend could be observed during the period 2013-2016. So, it is clear that vegetables, fruits and dairy products show a strong and continuous positive trend in their demand.
Figure 2. Market share of organic products in 2010 and 2016 (%) *Source of basic data: Biowallonie (2017)
Expenses for organic products
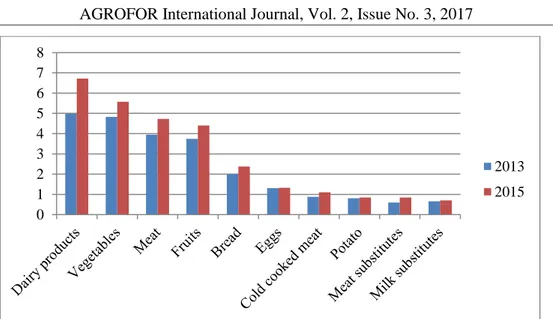
Many consumers buy organic products occasionally; however, 9% of Belgian households buy organic products at least every week and represent 60% of the total expenses. The expenses per capita and per product in 2013 and 2015 are illustrated in figure 3. 0 5 10 15 20 25 30 2010 2016
Figure 3. Expenses per capita of selected organic food products in 2013 and 2015 (€) *Source of basic data: Biowallonie (2017)
Fresh products are the most important: dairy products, vegetables, meat and fruits, probably reflecting the fact that consumers are less confident about quality when products have been processed. Between 2013 and 2015, the expenses have increased for all types of products. Remarkably, the expenses for organic products even increased in 2014, while the total expenses for food declined for the first time since many years, due to the economic stagnation and risks of deflation. It shows that the positive trend for organic products is really strong. In 2015, the expenses for organic products reached 33 € per capita, against 27 € in 2016. Families with high income and children and retired households with high income are the main buyers of organic food products, representing half of the total expenses while they count for 39% of the population. On the opposite, households with low income and children have the lowest expenses. This shows that prices are a question of concern.
Distribution channels
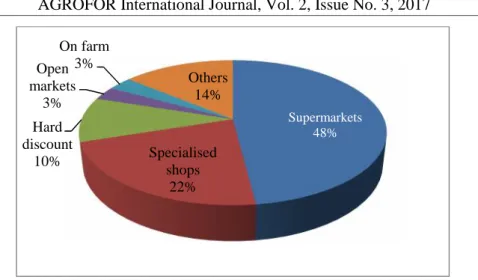
Concerning distribution (Figure 4), the most common channel is the supermarkets, with nearly half of the total organic food market in 2016, which was already the case in 2008. 0 1 2 3 4 5 6 7 8 2013 2015
Figure 4. Distribution channels of organic food products in Belgium in 2016 (%) *Source of basic data: Biowallonie (2017)
Hard discount shops have an increasing share, reaching 10% of the total organic food market in 2016, against 1.2% only 2008.
Shop specialised in organic products have the second position, with 22%. Direct sales are still marginal, with only 3% of organic products sold on farm and 3% on open markets, though there seems to be a move in favour of this kind of retailing. There are perhaps more initiatives in this field, but quantities remain modest compared to the significantly increasing quantities sold through supermarkets and other kinds of shops.
In Belgium, the increase of organic products consumption is parallel to the continuous increase of production, which is supported not only by the European authorities but also by the regional ones, especially in Wallonia where a specific development plan, which was integrated into the sustainable development plan, deals not only with additional financial support to farmers, but also with extension services, research, teaching, information to the public (Burny, 2016).
CONCLUSION
The market for organic products is clearly growing in Belgium, as in many countries in Europe and the world. An acceleration has even been noted in 2015 and 2016, the share of organic products reaching 3.2% of the total food market. This figure is even higher than the objective of 3% defined for 2020 in the Walloon development plan for organic farming. This trend will probably continue, though higher prices for organic products compared to conventional ones are an obstacle to their development. This evolution is parallel to the evolution of organic production, though it is still far from the strategic threshold of 20% defined by Dufumier (2012). This kind of production is also strongly supported by the public authorities. So, from both sides (production and demand), it appears that the organic sector needs a favourable economic environment in order to be prosperous, which clearly
Supermarkets 48% Specialised shops 22% Hard discount 10% Open markets 3% On farm 3% Others 14%
limits its development. Nevertheless, it has become now one of the serious alternatives to conventional agriculture and products.
REFERENCES
Biowallonie (2017). Les chiffres du bio 2016. Namur. 28p.
Brezuleanu, S., Brezuleanu, C.O. & Iatco, C. 2013. Fundamentation of human resources in agricultural exploitations on the basis of labour productivity indicators. Environmental Engineering and Management Journal, 13:1861-1871.
Bryła, P. 2016. Organic food consumption in Poland: Motives and barriers. Appetite, 105:737–746.
Burny, Ph. (2016). Agriculture towards a more sustainable development: the case of Wallonia (South of Belgium). Agrarian perspectives XXV. Global and European challenges for food production, agribusiness and the rural economy, Prague. Czech Republic, pp9-15.
Burny, Ph., Petrescu, D.C. and Petrescu, R.M. (2016). Organic farming and the greening of the Common Agricultural Policy made Walloon agriculture become more environment friendly in 2015. Studia UBB Ambientum, 61(LXI)1-2:15-24.
Daugbjerg, C. and Sønderskov, K.M. (2012). Environmental policy performance revisited: designing effective policies for green markets. Political Studies, 60: 399–418.
Dufumier, M. (2012). Famine au Sud, mal bouffe au Nord, Nil, Paris.
Gázquez-Abad, J.C., Jiménez-Guerrero, J.-F., Mondéjar-Jiménez, J.-A. & Cordente-Rodríguez, M. (2011). How companies integrate environmental issues into their marketing strategies. Environmental Engineering and Management Journal, 10: 1809-1820.
Petrescu, D. C. and Petrescu-Mag, R. M. (2015). Organic Food Perception: Fad, or Healthy and Environmentally Friendly? A Case on Romanian Consumers. Sustainability, 7(9):12017-12031.
Petrescu, D.C., Petrescu-Mag, R.M. & Burny, Ph. (2015). Management of Environmental Security through Organic Agriculture. Contribution of Consumer Behaviour. Environmental Engineering and Management Journal, 14(11): 2625-2636.
Petrescu-Mag, R. M., Petrescu, D. C., Sima, N.-F. and Sima, R. (2016). Informed product choice in the organic food sector: from guaranteeing the legal rights to facing sustainability challenges. Journal of Environmental Protection and Ecology, 17(3):1111–1121.
Tobler, C., Visschers, V. H. M. and Siegrist, M. (2011). Eating green. Consumers’ willingness to adopt ecological food consumption behaviours. Appetite, 57(3):674–82.