DOI: 10.1051/0004-6361:20010283 c
ESO 2001
Astrophysics
&
Quasar pairs with arcminute angular separations
V. I. Zhdanov1,2 and J. Surdej1,? 1
Institut d’Astrophysique, Universit´e de Li`ege, Avenue de Cointe 5, 4000 Li`ege, Belgium 2 Astronomical Observatory of Kyiv University, Observatorna St. 3, UA- 04053 Kyiv, Ukraine Received 19 October 2000 / Accepted 16 February 2001
Abstract. We use the V´eron-Cetty & V´eron (2000) catalog (VV) of 13 213 quasars to investigate their possible physical grouping over angular scales 1000≤ ∆θ ≤ 100000. We first estimate the number of quasar pairs that would be expected in VV assuming a random distribution for the quasar positions and taking into account observational selection effects affecting heterogeneous catalogs. We find in VV a statistically significant (>3σ) excess of pairs of quasars with similar redshifts (∆z ≤ 0.01) and angular separations in the 5000−10000 range, corresponding to projected linear separations (0.2−0.5) Mpc/h75(ΩM = 1, ΩΛ = 0) or (0.4−0.7) Mpc/h75(ΩM = 0.3, ΩΛ = 0.7). There is also some excess in the 10000−60000range corresponding to (1−5) Mpc in projected linear separations. If most of these quasar pairs do indeed belong to large physical entities, these separations must represent the inner scales of huge mass concentrations (cf. galaxy clusters or superclusters) at high redshifts; but it is not excluded that some of the pairs may actually consist of multiple quasar images produced by gravitational lensing. Of course, a fraction of these pairs could also arise due to random projections of quasars on the sky. The list of 11 pairs of quasars with redshift differences ∆z ≤ 0.02 and angular separations 5000 ≤ ∆θ ≤ 10000is presented in order to stimulate further observational studies and to better understand the astrophysical and cosmological significance of these interesting objects.
Key words. quasars – clusters – gravitational lenses – observations
1. Introduction
Close pairs of quasars with small angular separations (typ-ically ∆θ ≤ 1000) and small redshift differences (∆z ≤ 0.01) have attracted much attention in recent years be-cause of their possible relevance to a number of challenging astrophysical and cosmological problems (e.g. Kochanek et al. 1999). Identification of multiply imaged quasars in optical and radio surveys has frequently been used to set interesting constraints on cosmological parameters, including the Hubble constant (cf. the recent review by Claeskens & Surdej 2001). However, little is known about the statistics of physical pairs of quasars or of multiply im-aged lensed quasars with angular separations ∆θ > 1000, which would probe lensing masses over scales of galaxy clusters, or even superclusters. Maoz et al. (1997) have car-ried out a survey with HST for very large image separation lensed quasars, but they failed to detect any secondary image near each of their 76 primarily selected quasars with separations in the 700–5000range. On the other hand, Shaver (1984) has pointed out an excess of quasar pairs Send offprint requests to: J. Surdej,
e-mail: [email protected]
? Also, Research Director at the National Research Science
Foundation, Belgium.
over several M pc linear scales, based upon an original sta-tistical analysis of the V´eron-Cetty & V´eron (1984) cat-alog, which included at that time 2251 quasars. This has been later confirmed by correlation function analysis with smaller but homogeneous datasets (Andreani & Cristiani 1992; Mo & Fang 1993; Croom & Shanks 1996).
It is obvious that alike for the case of close pairs of quasars, the identification of very large separation ones (with ∆θ∈ [1000−100000]) would have very challenging as-trophysical and cosmological implications. Indeed, such physical pairs of quasars could be associated with high redshift galaxy clusters and provide interesting clues on the origin and early evolution of clusters, dark matter, etc. Similarly, setting more stringent observational limits on the frequency of gravitational lensing at very large an-gular scales would enable us to rule out the existence of galaxy clusters with very large M/L ratio, to set upper limits on the central density of clusters and superclusters, to reject certain proposed cosmogonic models and to set an independent upper limit on the cosmological constant (Kochanek 1995; Wambsganss et al. 1995).
In the present paper, we show that in the recent ver-sion of the V´eron-Cetty & V´eron catalog (2000, hereafter VV) the number Np of quasar pairs with similar red-shift (∆z ≤ 0.01) deviates significantly, within certain
arise due to random coincidences. In our case, thanks to the very large number of entries available in VV, it is possible to supplement Shaver’s method with estimates of
Nexpand their dispersions. We have applied this improved method to VV and report here on some interesting results in the 5000−60000angular separation interval.
2. Number estimates of quasar pairs
2.1. Basic assumptions and conventions
In the remainder, we shall distinguish the random pairs (RP ) of quasars, arising from random positions over the sky, from the physical pairs (P P ) of quasars. The lat-ters have some physical relation which renders their dis-tribution over the sky different from a random one. P P quasars may be members of some clusters or they may have evolved from some common mass concentrations. We also include into P P possible doubly imaged quasars pro-duced by gravitational lensing. Our aim is to compare the expected number of RP with similar redshifts with the observed number of pairs in VV at various angular separations.
In order to study the physical pairing of quasars, Shaver (1984) has considered, for given angular separation intervals, the ratio of the number of quasar pairs having nearly the same redshifts (e.g. ∆z≤ 0.01, which may in-clude physical pairs) to that with different, but neverthe-less close redshifts (e.g. 0.03≤ ∆z ≤ 0.2) that may only arise due to random coincidences.
Because several tens of multiply imaged quasars have been reported with angular separations ∆θ < 1000 (Claeskens & Surdej 2001) and since our search in the VV catalog has not revealed any single pair with 1000 ≤ ∆θ≤ 5000 and ∆z≤ 0.02, we restrict hereafter our study of physical pairs of quasars to those with angular separa-tions 5000≤ ∆θ ≤ 100000.
Given that any apparent excess of quasar pairs could possibly result from large statistical fluctuations in the random projections of quasars, combined with the inher-ent observational selection effects in VV, a correct in-vestigation of this problem requires to justify the va-lidity of extrapolating the relations for the expected
timate Nexp and σ(Nexp) for ∆z≤ 0.01 and ∆θ ≤ 100000. The results are presented in terms of the pair numbers
N (θ, ξ) having an angular separation θ≤ ∆θ < θ + δ, δ
representing the width of the ring with angular radius θ, and a redshift difference ξ ≤ ∆z < ξ + ζ. In the remain-der, we use the normalized pair numbers defined per unit interval of ζ and per unit area of the ring
n(θ, ξ) =N (θ≤ ∆θ < θ + δ, ξ ≤ ∆z < ξ + ζ)
2πζδ(θ + δ/2) · (1)
Using the data from 10 equal comparison bins (ξ = 0.03 +
kζ; k = 0, 1, ..., 9; ζ = 0.01), we estimate the average pair
number na = < n(θ, ξ) >ξ and rms deviation from this average for every angular separation interval.
Our choice to discretize the redshifts in bins having a width ∆z = 0.01 prevents us to deal with the problem of redshift measurement errors, roundoffs in VV or peculiar velocities which are always smaller than 0.01.
We define the normalized number of quasar pairs from VV with approximately similar redshifts as np= n(θ, 0), adopting ζ = 0.01. We assume that P P may contribute to np up to 500000, at maximum, but that they do not contribute to nr = n(θ, ξ ≥ 0.03), neither to np for
∆θ ∈ [500000, 20 00000]. Accordingly, we denote nexp the
expected value of n(θ, 0) that would be in VV, provided
P P were absent. Following Shaver (1984), we also assume
that for small values of ξ, the distribution of nrmust bear the same imprint of non physical effects as np. It should be noted that the values of nexp, nrand their dispersions need not necessarily be the same (though they appear to be rather close) because of the very irregular depen-dence of the number counts of quasars with redshift, but their dependence upon angular separations must be simi-lar. Thus, if there were no physical pairs or lensed quasar images in VV, we should have for small values of ξ (typ-ically ξ ∈ [0.03, 0.13]) a behaviour for nras a function of
θ that is similar to that of np. But, as we shall see below,
this is just not the case.
2.2. Permutated catalogs and estimates of nexp
It is obvious that P P may reveal themselves in the method used due to possible redshift-position correlations existing
Fig. 1. The functions n∗p(θ) (thick line) and n∗a(θ) (thin line) in the 5000−20 00000angular separation interval resulting from averages over 2500 “permutated” catalogs. The dots represent the na data from VV for δ = 5000 and ζ = 0.01. Here and in the other figures, θ represents the angle defined in Eq. (1).
for the quasars in VV. Therefore, it is important to eval-uate the contribution of unphysical effects inducing such possible correlations. This may be due, e.g., to variations in the redshift dependence of the quasar number counts from survey to survey in different sky regions. We need to know how these effects work when we extrapolate nexp from large angular separation intervals to smaller ones. We study this question with data from the comparison bins using artificially created catalogs which do retain some of the selection effects present in VV.
The artificial catalogs have been created from VV as follows. We have taken the list of quasars from the orig-inal VV with their positions unchanged, but their red-shifts have been randomly rearranged without changing their values. Thus, we obtain new “permutated” catalogs having the same positional inhomogeneities and the same global redshift distribution. However, all possible correla-tions existing between position and redshift due to obser-vational selection effects in VV should have been washed out. We have generated 2500 such rearranged catalogs to derive average data for comparison with VV and calcu-lated the functions n∗p, n∗r and n∗a, marked with an aster-isk, by averaging the corresponding functions np, nr and
na over the artificial catalogs. Obviously, these averaged dependences are smoother than the original np, nrand na from VV (see, e.g., Fig. 1 for n∗pand n∗a), thus increasing the quality of the extrapolations.
We present in Figs. 2, 3 the values of ρp= np/n∗pand
ρa= na/n∗a as a function of θ for δ = 5000.
The main result apparent from these figures is that the values of ρa= na/n∗a vary slowly up to 20 00000 angu-lar separations; the deviations from a linear (even nearly constant) behavior can be neglected in comparison with the considerable scatter of ρr = nr/n∗r and the large ex-cess of ρp present within certain angular separation bins.
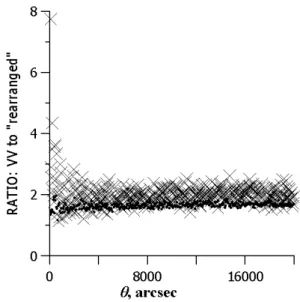
Fig. 2. Ratios ρp(θ) and ρa(θ) of quasar pair numbers from VV to average values from 2500 rearranged catalogs against θ (crosses for ρp and dots for ρa; δ = 5000 and ζ = 0.01). The error bars represent rms deviations of ρrfrom ρa. The ρpvalue for ∆θ < 5000 is far too high to be shown in this figure due to the large number of pairs, especially gravitational lenses, with ∆θ < 1000; note that there are no quasar pairs present in VV in the 1000−5000interval.
Fig. 3. The same as in Fig. 2 over the 5000−20 00000 angular separation interval. Note the very slight increase of ρa as a function of θ for which the dependence can be easily modeled.
We conclude on the basis of the ρa dependence that the selection effects do not produce any significant changes of
ρr when we pass from large angular separations (up to 20 00000) to smaller ones (5000−100000). The weak variation of ρa, and therefore, of the expected value nexp/n∗p, makes extrapolations from large ∆θ very simple to estimate nexp at small angular separations. This allows us to use the np data from the ∆θ > 500000range to estimate the expected number of quasar pairs nexp and its dispersion at smaller angular separations.
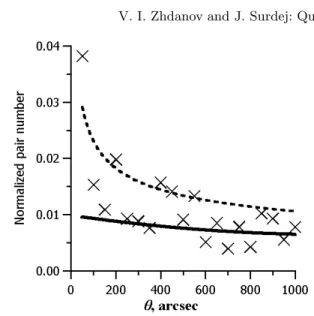
Fig. 4. Normalized numbers np(crosses) of quasar pairs from VV as a function of θ for δ = 5000 and ζ = 0.01. The con-tinuous line represents the expected value nexpfor the case of random projections of quasars over the sky. The dashed line corresponds to the upper 3σ limits for nexp.
The similar behaviour of naand n∗amay be interpreted as reflecting the absence of any significant angle-redshift correlations in VV due to unphysical selection effects over several degrees; at least they are not important for our par-ticular problem. Thus, the permutated catalogs appear to provide a very useful tool for studying the selection effects in the VV catalog, because they retain all of them except those due to position-redshift correlations. In particular, the positional effects reveal themselves in the n∗p and n∗a dependences showing a similar behavior (Fig. 1). The lat-ter would have been constant if positional inhomogeneities were absent.
It should be noted that an excess of ρp(5000) (i.e. in the 5000−10000 range), and therefore np(5000), is clearly seen from the figures; however it must be complemented with dispersion estimates. Some additional excess of quasar pairs is possibly present in the 10000−60000 range. If there were only RP in the VV catalog, the behaviour of ρp should be much the same as that of ρa.
Now it is easy to calculate nexp in the 000−100000 angular separation interval. Extrapolating from the
500000−20 00000range, we obtain the expected values of ρp
in case of RP , and using the known n∗p dependence (see Fig. 1), we derive nexp in the desired interval. The results are shown in Fig. 4 with the dispersion estimates calcu-lated here under the assumption of Poisson statistics that will be justified in the next subsection. From the observed
np(θ) data in Fig. 4, we directly see that a significant ex-cess of pairs of quasars is detected in the ∆θ∈ [5000, 10000] ring and this appears to be well beyond the 3σ limit.
In the 5000−10000interval for ∆z≤ 0.01, the expected data nexp correspond to Nexp = 2.2 pairs. In reality, there are 9 quasar pairs in this interval present in the VV catalog.
Additional excess of quasar pairs with separations in the 10000−60000 range also seems to be present but it is
2.3. Dispersion estimates
From the Poisson statistics dispersion, we obtain for the normalized pair number (1)
σ(np(θ)) = χ s
np(θ)
2πζδ(θ + δ/2), (2)
where we have introduced the factor χ that measures devi-ations from the Poisson statistics; in case of no devidevi-ations we have χ = 1. Using Eq. (2), one easily obtains a relation for the ρpdispersion, where we neglect the error affecting
n∗p. This formula is then compared with rms deviations of
ρpfrom their average in the 500000−20 00000interval yield-ing the factor χ as follows
χ ={<πζδ(2θ+δ)(ρp(θ)−ρp,av)2np(θ) >∗ S}1/2{ρp,av}−1/2, where <...>S represents an average value over the large angular separation interval 500000 ≤ θ ≤ 20 00000;
ρp,av = <ρp>S. The value obtained for σ(np) is
χ = 0.97± 0.09.
An analogous procedure has been applied to the nr data from the comparison bins. The value of χ estimated for nris 0.96±0.04. These estimates change insignificantly if we take into account the small trend in the ρp and
ρr data. All these estimates are compatible with Poisson statistics.
It is now important to check the dispersions over those angular separation intervals where we have an excess of
np. For this, we use the dispersions from the comparison bins that are in fact even somewhat overestimated: they have been computed using deviations from the average na, but there are some additional systematic variations with ∆z between different bins that are not due to variations with θ. The results are shown in Fig. 5; we see that the data from the comparison bins agree very well with those obtained according to Eq. (2) from the extrapolated data. This convinces us that, at least for our particular problem, there is no violation of the Poisson statistics due to the selection effects.
2.4. Distribution in projected linear separations
A similar treatment has been performed for the (appar-ent) linear projected separations instead of the angular
Fig. 5. Dispersions of the normalized pair numbers nrfrom the comparison bins against θ; δ = 5000 (rhombs for the data from the comparison bins in VV, continuous line for the estimated dispersions in accordance with Eq. (2)).
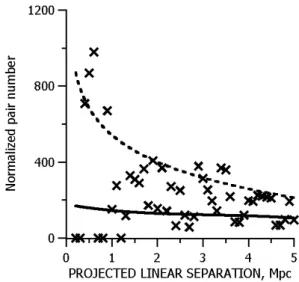
Fig. 6. Normalized numbers np(crosses) of quasar pairs from VV as a function of their projected linear separations for δ = 0.1 Mpc and ζ = 0.01; ΩΛ= 0. The continuous line represents the expected value, the dashed line corresponds to its upper 3σ limits.
variables θ, δ (see Eq. (1)). We used the angular distance relations (see, e.g., Schneider et al. 1992) with spatially flat cosmological models (ΩM+ ΩΛ = 1) for two values of the cosmological constant: ΩΛ = 0 and ΩΛ = 0.7. The results are shown in Figs. 6, 7 and Table 1 for the inter-vals where the excess of P P is significant. The excess in the region near 0.5 Mpc/h75 is clearly observed. The ex-cess in the (1−5) Mpc/h75 region is less pronounced; it becomes more evident if we compare the cumulative num-ber of pairs in this region with the expected value. The difference between these two numbers (see Table 1) is well above the 3σ limit.
The results obtained in this section may be used to study the correlation functions of the quasar distribution. In particular, the ratio np/nexp is directly related to the two-point angular correlation function (Peebles 1980).
Fig. 7. The same as in Fig. 6 for ΩΛ= 0.7.
Table 1. Cumulative number NPP = Np− Nexp of physical pairs of quasars within certain projected separation intervals S; σ is the dispersion estimate; ΩM+ ΩΛ= 1. The last column lists the fraction of P P in VV for the above intervals.
ΩΛ S NPP σ NPP/Np (Mpc/h75) 0 0.2−0.5 7.15 1.4 79% 1.0−5.0 69 13 28% 0.7 0.4−0.7 7.5 1.4 84% 1.0−5.0 57 10 38% 3. Discussion
We have estimated the number of quasar pairs expected in VV for the case of random quasar positions and have compared this to the actual number of pairs in this cata-log. The results of the comparison are presented in Fig. 4 in terms of the angular separation θ and in Figs. 6, 7 as a function of the projected linear separation for two popu-lar cosmological models. These figures along with Table 1 show that there is a considerable excess of quasar pairs in VV over the expected value within certain separation intervals. In particular, there are 9 pairs of quasars in VV against two expected ones with redshift differences
∆z ≤ 0.01 and angular separations ∆θ in the 5000−10000
range (see Table 2, 9 first pairs).
Therefore, this excess of pairs of quasars – proba-bly consisting of genuine physical pairs or douproba-bly im-aged quasars – is highly statistically significant by more than 3σ. If we extend ∆z to 0.02, two additional pairs of quasars must be included in the above list (Table 2, two last pairs). We also find that there is a highly statistically significant excess of close redshift pairs (∆z ≤ 0.01) in the 10000−60000 range by more than 5σ. In terms of pro-jected linear separations, we have an analogous excess near 0.5 Mpc. There does also appear to be a significant excess of pairs of quasars in the (1−5) Mpc projected linear sep-aration range. If P P consist of genuine physical pairs of
Name zs ∆θ S S0 R (00) (Mpc) (Mpc) Q 0053-3342A 2.00 83.7 0.46 0.65 1 Q 0053-3342B 2.00 Q 0107-0235 0.958 77.5 0.44 0.57 2 PB 6291 0.956 CTS H26.12 2.33 58.9 0.31 0.45 3 CTS H26.13 2.33 Q 1310+4254A 2.561 91.4 0.47 0.69 4 Q 1310+4254B 2.561 1WGA 1.89 82.2 0.46 0.65 5 J1334.7+3757 1WGA 1.89 J1334.8+3757 1333.2+2604 1.182 68.3 0.39 0.53 6 1333.2+2603 1.179 Q 2121-4642 1.347 82.8 0.46 0.65 7 Q 2121-4641 1.352 Q 2139-4433 3.22 62.6 0.29 0.44 8 Q 2139-4434 3.230 QSM1:35 1.123 70.1 0.40 0.54 9 QSM1:25 1.128 1336.5+2804 1.31 94.7 0.54 0.74 10 1336.6+2803 1.325 Q 23540+1839 1.666 96.2 0.54 0.76 11 Q 23541+1840 1.680
quasars, these ranges correspond to some inner scales of huge mass concentrations at high redshifts.
It should be noted that any amplification bias due to enhanced convergence, induced by some hypothetical fore-ground smooth structures, is easily ruled out from our treatment. It would actually change the brightness of all the quasars with different z, and this would equivalently affect both the numbers nr and npof quasar pairs.
Unfortunately, the present data concerning most pairs from Table 2 do not enable us to distinguish between
redshifts.
A search for weak lensing effects (see, e.g., Bartelmann & Schneider 1999) around the 11 pairs of quasars would be extremely helpful in order to test the lensing hypothe-sis. One could also look for some possible stretching of the quasar host images, which in case of the lensing scenario should reveal preferential tangential elongations due to the lens shear. Furthermore, each of the 11 pairs of quasars should be further investigated in the various regions of the electromagnetic spectrum. In particular, one could in-vestigate the distribution of narrow absorption lines in the spectra of quasar pairs, which correspond to a region with characteristic timescales >>100 yrs, in order to exclude any possible effect due to time delays in case of the lens scenario. These same observations could be used to im-prove the values of the emission redshift of the individual quasars forming a pair.
On the other hand, the pairs of quasars in question may represent some of the most high redshift clusters ever identified which are expected to contain a population of early-type galaxies detectable, e.g. in the near-infrared, or hot intergalactic gas emitting in the X-rays. Such proposed observations are being planned.
But, no matter to which group they belong, these ob-jects consist of very interesting targets for further studies. We expect that forthcoming homogeneous surveys such as 2dF and SDSS will independently confirm the physical grouping of QSOs with arcminute angular separations. Acknowledgements. We thank the anonymous referee for her/his helpful comments and remarks on the manuscript. Our research was supported in part by the Belgian Office for Scientific, Technical and Cultural Affairs (OSTC), by PRODEX (Gravitational Lens Studies with HST), by con-tract P4/05 “Pˆole d’Attraction Interuniversitaire” (OSTC, Belgium), by contract 1994-99 of “Action de Recherches Concert´ees” (Communaut´e Fran¸caise, Belgium) and by the “Fonds National de la Recherche Scientifique” (Belgium).
References
Andreani, P., & Cristiani, S. 1992, ApJ, 398, L13
Bartelmann, M., & Schneider, P. 1999, submitted to Phys. Repts. [astro-ph/9912508]
Boyle, B. J., Fong, R., Shanks, T., & Peterson, B. A. 1990, MNRAS, 243, 1
Borra, E. F., Levesque, S., Beauchemin, M., et al. 1996, AJ, 111, 1456
Chaffee, F. H., Foltz, C. B., Hewett, P. C., et al. 1991, AJ, 102, 461
Claeskens, J.-F., & Surdej, J. 2001, A&AR, in press
Crampton, D., Cowley, A. P., Schmidtke, P. C., et al. 1988, AJ, 96, 816
Crampton, D., Cowley, A. P., & Hartwick, F. D. A. 1990, AJ, 100, 47
Croom, S. M., & Shanks, T. 1996, MNRAS, 271, 893
Dinshaw, N., Weymann, R. J., Impey, C. D., et al. 1997, ApJ, 491, 45
Gosset, E., Moreau, O., Surdej, J., Swings, J.-P., & Arp, H. C. 1997, A&AS, 123, 529
Hawkins, M. R. S. 2000, A&AS, 143, 465
Hawkins, M. R. S., & V´eron, P. 1995, MNRAS, 275, 1102 Iovino, A., Clowes, R., & Shaver, P. 1996, A&AS, 119, 265 Kochanek, C. S. 1995, ApJ, 453, 545
Kochanek, C. S., Falco, E. E., & Munoz, J. A. 1999, ApJ, 510, 590
Maoz, D., Rix, H.-W., Gal-Yam, A., & Gould, A. 1997, ApJ, 486
Maza, J., Wischnjewsky, M., Antezana, R., & Gonzalez, L. E.
1995, Rev. Mech. Astron. Astrofis., 31, 119
McHardy, I. M., Jones, L. R., Merrifield, M. R., et al. 1998, MNRAS, 295, 641
Mo, H. J., & Fang, L. Z. 1993, ApJ, 410, 493
Morris, S. L., Weymann, R. J., Anderson, S. F., et al. 1991, AJ, 102, 1627
Mortlock, D. J., Webster, R. L., & Francis, P. J. 1999, MNRAS, 309, 836
Peebles, P. J. E. 1980. The Large-Scale Structure of the Universe (Princeton Univ. Press, Princeton, NJ)
Shaver, P. A. 1984, A&A, 136, L9
Surdej, J., Arp, H., Gosset, E., et al. 1986, A&A, 161, 209 Schneider, P., Ehlers, J., & Falco, E. E. 1992, Gravitational
Lenses (Springer-Verlag)
V´eron, P., & Hawkins, M. R. S. 1995, A&A, 296, 665
V´eron-Cetty, M. P., & V´eron, P. 1984, ESO Scientific Report, No. 1
V´eron-Cetty, M. P., & V´eron, P. 2000 (VV), Quasars and Active Galactic Nuclei (9th Ed.) http://vizier.u-strasbg.fr/viz-bin/Cat?VII/215 Wambsganss, J., Cen, R., Ostriker, J. P., & Turner, E. L. 1995,
Science, 268, 274
Windhorst, R. A., Fomalont, E. B., Kellermann, K. I., et al. 1995, Nature, 375, 471