Deep Imaging Search for Planets Forming in the TW Hya Protoplanetary
Disk with the Keck
/NIRC2 Vortex Coronagraph
G. Ruane1,10, D. Mawet1,2, J. Kastner3,4, T. Meshkat2,5, M. Bottom2, B. Femenía Castellá6, O. Absil7,11, C. Gomez Gonzalez7, E. Huby7,8, Z. Zhu9, R. Jenson-Clem1, É. Choquet2,12, and E. Serabyn2
1
Department of Astronomy, California Institute of Technology, Pasadena, CA 91125, USA;[email protected]
2
Jet Propulsion Laboratory, California Institute of Technology, Pasadena, CA 91109, USA
3
School of Physics & Astronomy, Laboratory for Multiwavelength Astrophysics, Rochester Institute of Technology, Rochester, NY 14623, USA
4
Chester F. Carlson Center for Imaging Science, Rochester Institute of Technology, Rochester, NY 14623, USA
5
IPAC, California Institute of Technology, Pasadena, CA 91125, USA
6
W. M. Keck Observatory, Kamuela, HI 96743, USA
7
Space Sciences, Technologies, and Astrophysics Research(STAR) Institute, Université de Liège, Liège, Belgium
8
LESIA, Observatoire de Paris, Meudon, France
9
Department of Physics and Astronomy, University of Nevada, Las Vegas, Las Vegas, NV 89154, USA Received 2017 May 19; revised 2017 June 19; accepted 2017 June 22; published 2017 July 27
Abstract
Distinct gap features in the nearest protoplanetary disk, TW Hya(distance of 59.5 ± 0.9 pc), may be signposts of ongoing planet formation. We performed long-exposure thermal infrared coronagraphic imaging observations to search for accreting planets, especially within dust gaps previously detected in scattered light and submillimeter-wave thermal emission. Three nights of observations with the Keck/NIRC2 vortex coronagraph in L′ (3.4–4.1 μm) did not reveal any statistically significant point sources. We thereby set strict upper limits on the masses of non-accreting planets. In the four most prominent disk gaps at 24, 41, 47, and 88 au, we obtain upper mass limits of 1.6–2.3, 1.1–1.6, 1.1–1.5, and 1.0–1.2 Jupiter masses(MJ), assuming an age range of 7–10Myr for TW Hya.
These limits correspond to the contrast at 95% completeness(true positive fraction of 0.95) with a 1% chance of a false positive within 1″ of the star. We also approximate an upper limit on the product of the planet mass and planetary accretion rate of M Mp 10 8MJ yr
2 1
-
-˙ implying that any putative ∼0.1 MJ planet, which could be
responsible for opening the 24 au gap, is presently accreting at rates insufficient to build up a Jupiter mass within TW Hya’s pre-main-sequence lifetime.
Key words: circumstellar matter – stars: individual (TW Hya) – stars: pre-main sequence
1. Introduction
Interactions between planets and the circumstellar material from which they form manifest as large-scale dust disk density structures that appear as gaps, rings, or spirals (Bryden et al. 1999; Pinilla et al. 2012; Zhu et al. 2014; Dong et al. 2015; Canovas et al.2017; Dong & Fung2017). Such features have been detected in the disks around numerous nearby, young stars via submillimeter interferometry (Hughes et al. 2007; Andrews et al. 2009; Isella et al. 2010; Andrews et al. 2016; van der Plas et al. 2017) and scattered light imaging (Garufi et al.2013; Akiyama et al. 2015; Benisty et al.2015; Rapson et al. 2015a,2015b; Thalmann et al.2015). In fact, observers need to look no further than TW Hydrae, the nearest protoplanetary disk (59.5 ± 0.9 pc; Gaia Collaboration 2016), tofind gap features that could indicate the presence of planets potentially undergoing formation.
TW Hya is a pre-main-sequence, classical T Tauri star with a mass in the range of 0.7–0.8Me(Andrews et al.2012; Herczeg & Hillenbrand2014) and a massive circumstellar disk (Bergin et al.2013). In addition to being the nearest young solar analog orbited by a gas-rich disk, TW Hya is one of the most promising systems for directly observing signposts of planet formation owing to its relatively advanced age for a protoplanetary disk (7–10 Myr; see Section 2), close to
face-on geometry (∼7° inclination; Qi et al. 2004), and distinct radial gap features that are seen in scattered light(Weinberger et al.2002; Akiyama et al.2015; Rapson et al.2015b; Debes et al.2016,2017; van Boekel et al.2017) and thermal emission (Andrews et al.2016) from dust in the disk.
Observations by Andrews et al. (2016) with the Atacama Large Millimeter/submillimeter Array (ALMA) at 870 μm show gaps at separations of∼0 02 (1 au), ∼0 4 (24 au), ∼0 7 (41 au), and ∼0 8 (47 au). In addition, optical/near-infrared scattered light observations with VLT/SPHERE confirm the ∼24au gap as well as a clearing at ∼1 5, or 88au (van Boekel et al.2017).
Dynamical simulations by Dong & Fung(2017) suggest that planets with masses of 0.05–0.5 and 0.03–0.3 Jupiter masses (MJ), respectively, may be sculpting the gaps at ∼0 4 (24 au) and
∼1 5 (88 au). A 0.1 MJ protoplanet actively accreting material
from the disk at rates on the order of 10−7MJyr−1, i.e., sufficient
to build a Jupiter mass within TW Hya’s pre-main-sequence lifetime, could have an absolute magnitude in L′ (3.4–4.1 μm) of ∼13, which is detectable via a high-contrast imager at ΔL′≈10 (Zhu2015). Moreover, such a protoplanet can only be feasibly detected in the L′ band, or at longer infrared wavelengths (e.g., M or N). The protoplanet would be at least 11 and 6mag fainter at H and K bands than in the L′ band, respectively, which is beyond the detection capability of state-of-the-art high-contrast imagers at small angular separations(see, e.g., van Boekel et al.2017).
We have performed long-exposure L′ observations of TW Hya using the NIRC2 vortex coronagraph at the W. M.Keck © 2017. The American Astronomical Society. All rights reserved.
10
NSF Astronomy and Astrophysics Postdoctoral Fellow.
11
F.R.S.-FNRS Research Associate.
12
Observatory to search for protoplanets forming within the disk. Although the images did not reveal any statistically significant point sources, our contrast sensitivity translates into strict upper limits on the masses of non-accreting planets as well as constraints on the mass accretion rates of potential protoplanets.
2. Age of TW Hya
Constraints on the masses and mass accretion luminosities of young exoplanets orbiting within gaps in the TW Hya circumstellar disk obtained from direct thermal imaging depend sensitively on the assumed age of the star itself. Specifically, the younger the host star, the higher the expected luminosity of a young planet of a given mass. In the case of TW Hya, published age estimates range from ∼3Myr to ∼10Myr. The younger age estimates are derived from the star’s inferred effective temperature and measured luminosity, which allow TW Hya to be placed relative to isochrones gleaned from pre-main-sequence evolutionary models (Vacca & Sandell 2011; Donaldson et al.2016). The older end of the age range is based on statistical analyses of the ensemble of young stars within ∼15 pc of TW Hya that are evidently comoving and, hence, presumably coeval with TW Hya (i.e., the TW Hya Associa-tion; e.g., Ducourant et al. 2014; Bell et al.2015; Donaldson et al.2016, and references therein). It is becoming increasingly apparent that the former (isochronal) age determination method, which depends on an accurate assessment of stellar effective temperature as well as the availability of robust models of the structure and atmospheres of late-type stars, may underestimate the ages of individual stars (see discussions in, e.g., Kastner et al.2015; Pecaut2016; Jeffries et al.2017). For that reason, and because we seek to err on the side of conservative exoplanet mass constraints from our images, we adopt an age range of 7–10 Myr for TW Hya in the analysis described in this paper.
3. Observations and Processing
The Keck/NIRC2 vortex coronagraph (Mawet et al. 2017; Serabyn et al.2017) is an instrument mode that enables infrared high-contrast imaging in L′ and M bands at small angular separations from the star(100 mas). This capability provides unique opportunities for the detection of self-luminous planets and protoplanets. While the vortex coronagraph suppresses starlight without significantly impeding the transmission of off-axis sources, angular differential imaging(ADI) and reference star differential imaging(RDI) are crucial observing strategies for optimizing the detection limits of the high-contrast observations (Marois et al. 2006; Lafrenière et al. 2009). In practice, imperfect correction of atmospheric turbulence and
optical aberrations cause unwanted starlight to leak through the coronagraph. The ADI strategy estimates the stellar contrib-ution in an image from a sequence of frames with relative parallactic angle(PA) rotation and typically achieves the best sensitivity to point sources outside of a few diffracted beamwidths from the star. However, the best detection limits at small separations (0 3) may be obtained by RDI, which estimates the stellar contribution solely from images of similar stars(see, e.g., Serabyn et al.2017).
We observed TW Hya with NIRC2 over three nights in 2017 January (Table 1) under stable seeing conditions of 0 57±0 28, with an angular resolution of ∼0 08 and a plate scale of 0 01 per pixel.13 Each night consisted of a ∼90minute integration on TW Hya, which provides the maximum PA rotation possible from Maunakea: ∼45°. In addition, two point-spread function(PSF) reference stars, TYC 7128-1252-1 and CD-31 10139, were imaged directly before and after TW Hya with 10–60 minute integration times. The reference stars were chosen to reproduce the PSF during the TW Hya observations by matching the telescope elevation (hence declination), the signal on the wavefront sensor (Rmag),
and the L′ magnitude using the WISE W1 channel as a proxy (Table 2), while also avoiding objects with infrared excess or known companions. Images with the star position offset from the focal plane mask were obtained for photometric reference and to determine the PSF morphology. The total integration time on TW Hya was 4.5 hr and an additional 4 hr for reference PSF star targets.
After correcting for bad pixels,flat-fielding, subtracting sky background frames, and coregistering the images, we applied principal component analysis(PCA; Soummer et al. 2012) to estimate and subtract the stellar contribution from the images using the Vortex Image Processing (VIP) software package14 (Gomez Gonzalez2015; Gomez Gonzalez et al.2017).
4. Statistically Robust Detection Limits
After subtracting off the stellar contribution, the distribution of noise in the image is approximately Gaussian (see, e.g., Mawet et al. 2014). Under this assumption, we chose the detection threshold for point sources such that there was a 1% chance of having a false positive within 1″ of the host star, which roughly corresponds to the radius of the disk in scattered light(van Boekel et al.2017).
To ensure an equal probability of a false positive at all locations in the image, the false positive fraction (FPF)
Table 1
TW Hya Coronagraphic Deep Field Observations
Date Target Frames Integration Time DIMM Seeing Airmass Transparency PA Rotation 2017 Jan 9 TYC 7128-1252-1 78 59 minutes 0 55 1.7–2.0 clear 32°
TW Hya 120 90 minutes 0 70 1.7–2.2 clear 44° CD-31 10139 20 15 minutes 0 64 1.6–1.9 clear 6° 2017 Jan 10 TYC 7128-1252-1 70 53 minutes 0 35 1.7–2.0 clear 27° TW Hya 120 90 minutes 0 50 1.7–2.2 clear 45° CD-31 10139 70 53 minutes 0 55 1.6–1.9 clear 29° 2017 Jan 13 TYC 7128-1252-1 13 9.8 minutes 0 40 1.8–2.0 clear 4° TW Hya 117 88 minutes 0 48 1.7–2.2 clear 45° CD-31 10139 78 59 minutes 0 55 1.6–1.9 clear 30°
13https://www2.keck.hawaii.edu/inst/nirc2/genspecs.html 14
decreases as a function of angular separation as the number of independent and identically distributed (i.i.d.) samples within an annulus about the star increases with the radius (see also e.g., Jenson-Clem et al.2017). The resulting FPF is 10−4at the inner working angle (∼0 1) and 10−5 at 1″. However, in reality, the FPF may be higher than the Gaussian model predicts since the true noise distribution is unknown. We nonetheless translate the FPF into a detection threshold by inverting the cumulative distribution function of the noise assuming a Student-t distribution to account for the small number of samples (Mawet et al. 2014) as described in the Appendix. The resulting detection threshold varies from 8.1σ (R = 1) at the inner working angle to 4.5 σ(R = 12.5) at 1″, where σ(R) is the contrast corresponding to one standard deviation in the reduced image and R is the radial coordinate normalized by the full-width half-maximum (FWHM) of the off-axis PSF(∼8 pixels or ∼0 08). We used a fake companion injection and retrieval to determine σ(R) accounting for degradation of the planet signal induced by the PCA starlight subtraction algorithm(see, e.g., Absil et al.2013).
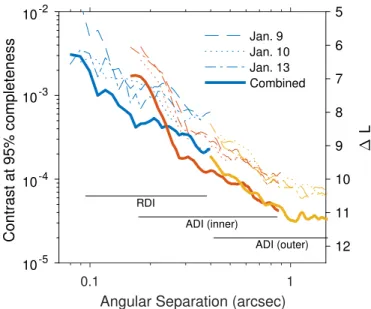
The completeness, or sensitivity, of an observation is described by the true positive fraction(TPF; see e.g., Lafrenière et al. 2007; Wahhaj et al. 2013). Whereas the detection threshold corresponds the 50% completeness contour (TPF=0.5), Figure1shows the contrast at 95% completeness (TPF=0.95), which varies from 10.1 σ(R = 1) at the inner working angle to 6.1σ(R = 12.5) at 1″ (see theAppendixfor a detailed derivation of the contrast limits).
Since RDI provides gains over ADI at small separations, we applied PCA–RDI in an annulus 0 08–0 5 and PCA–ADI in the two remaining two annuli: an inner one over the range 0 16–1″ and an outer one over the range 0 4–1 75.
We calculated the principal components (PCs) of the combined data using all of the frames from all three nights. The optimal number of PCs(i.e., the number that minimizes σ) was 77, 27, and 25 for the RDI, inner ADI, and outer ADI reductions. Since RDI does not suffer from self-subtraction effects, the optimum number of PCs is much higher than that of ADI. On the other hand, both the PCA–ADI and PCA–RDI reduction schemes suffer from over-subtraction effects, which are accounted for in the fake companion injection and retrieval process.
Combining the three nights of data provided∼2 times better contrast than the average of the individual nights, with both ADI and RDI approaches. We therefore conjecture that the contrast gains from combining n epochs provides better than the n improvement that one would expect with a purely Gaussian noise distribution. These gains arise from improve-ments in the stellar PSF model subtracted from every image provided by the inclusion of additional frames from other nights. This emphasizes the shortcomings of the typical noise
assumptions applied in the interpretation of high-contrast images and planning of observations.
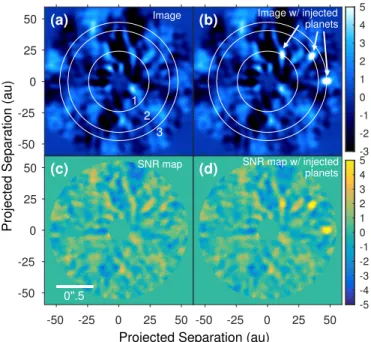
Figure2(a) shows the residuals within the 0 16–1″ annulus after subtracting the reconstructed stellar image using 27 PCs. The residuals are matched-filtered using an image of the off-axis PSF. Annotations indicate the locations of the known submm continuum emission gaps at ∼0 4 (24 au), ∼0 7 (41 au), and ∼0 8 (47 au), referred to as gaps 1–3, respectively (Andrews et al.2016). The corresponding signal-to-noise ratio map, i.e., the brightness relative to the standard deviation of independent samples in an annulus about the star (see Figure2(c)), confirms that there are no statistically significant point sources after the starlight has been subtracted. However, injected fake companions at ΔL′=10.5 would be clearly detected inside the gaps in the TW Hya disk(see Figures2(b) and(d)). A point source of this brightness could correspond to a non-accreting planet of ∼1.5 MJ (according to the Baraffe
et al. (2003) models) or a 0.1 MJplanet accreting at a rate of
∼10−7M
Jyr−1(Zhu 2015). The models used to calculate the
photometry of these planets are discussed in Sections5and6.
5. Upper Limits on Non-accreting Planet Mass We calculated the luminosity of a non-accreting planet using AMES-Cond, BT-Settl, and AMES-Dusty models (Baraffe et al.2003; Allard et al.2012). Dusty and Cond span a range from maximal to minimal dust content, whereas Settl accounts for dust formation via a paramater-free cloud model (see also the discussion in Bowler 2016). Each provides the absolute magnitude of an exoplanet as a function of planet age and mass, which we have interpolated from precomputed grids.15
The upper limits on the mass of non-accreting planets correspond to the contrast at 95% completeness(see Figure3). The range of masses reflects the assumed ages of 7–10 Myr. Here, we have also included the position of a fourth gap at
Table 2 Star Properties
Name R.A. Decl. Rmaga W1b
TYC 7128-1252-1 08 01 58.3 −33 51 36.9 10.23 6.83 TW Hya 11 01 51.9 −34 42 17.0 10.43 7.01 CD-31 10139 13 11 29.8 −32 29 15.1 10.35 6.60 Notes.
a
UCAC4 catalog(Zacharias et al.2013).
b
WISE catalog (Wright et al.2010), W1 band: 3.4 μm.
Figure 1.Contrast at 95% completeness(TPF) with a 1% chance of a false positive within 1″ of the star, using RDI for the smallest separations and ADI outside of∼250 mas. ADI was applied in two annular regions separately: “inner” and “outer.” The dashed and dotted lines represent the contrast limits achieved on each individual night, whereas the thicker solid lines show the performance after combining all three nights of data.
15
∼1 5 (88 au) apparent in scattered light (van Boekel et al. 2017), which we denote as “gap 4.” For the oldest assumed age, 10 Myr, the Cond model predicts the highest masses: 2.3, 1.6, 1.5, and 1.2 MJ in gaps 1–4, respectively. Dusty, on the
other hand, is generally the most optimistic model in this case; assuming an age of 7 Myr implies respective planet masses of 1.6, 1.1, 1.1, and 1.0MJin the gaps.
A planet in the TW Hya disk is likely still undergoing formation and therefore may have an accreting circumplanetary disk, which is not included in the Cond, Settl, and Dusty models. Thus, the results above should be interpreted as the upper limits for the mass of planets forming in the disk. The thermal emission from the circumplanetary disk could be much brighter than the emission from the planet owing to contraction alone. In the next section, we determine the brightness of accreting protoplanets and constrain their mass accretion rates.
6. Constraints on Actively Accreting Protoplanets Zhu(2015) calculated the absolute magnitude of an accreting circumplanetary disk in near-infrared bands J through N and found that the brightness depends on the product of the planet mass and the mass accretion rate, M Mp ˙ , as well as the inner
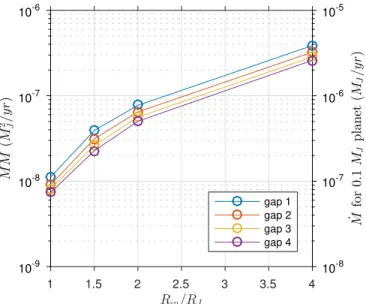
radius of the circumplanetary disk, Rin. Figure 4 shows the
upper limits of the accretion rate for a protoplanet forming within gaps 1–4 as a function of Rin, as calculated from the Zhu
(2015) models. Owing to the inherent degeneracy between M Mp ˙ and Rin, we are not able to place unambiguous upper
limits on the accretion rate of the planet with infrared photometry alone. However, based on models of planet–disk dynamical interactions, Dong & Fung (2017) estimated the mass of the planet carving out the gaps in the TW Hya disk and found that, for instance, planets with masses of 0.05–0.5 and 0.03–0.3 MJ, respectively, may be sculpting the gaps at∼0 4
(24 au) and ∼1 5 (88 au). The Zhu (2015) model predicts that
a 0.1MJprotoplanet could be bright enough in L′ to fall within
the detection limits of our observations. For example, the contrast limits suggest that a planet of a mass of 0.1MJ
accreting from a circumplanetary disk of inner radius Rin=RJ,
where RJis the radius of Jupiter, would have to be accreting at
a rate of M 10 7M yr
J 1
-
-˙ . Assuming a constant accretion
rate, such a putative 0.1MJ planet would be <1Myr old or
must have a larger circumplanetary disk inner radius. The deep detection limits achieved in these observations imply that a planet with Rin=RJis presently accreting at rates insufficient
to form a Jupiter mass planet within TWHya’s estimated lifetime of 10Myr.
The lack of knowledge regarding Rinprecludes a definitive
upper limit for the accretion rate within the disk gaps for all protoplanets, but nonetheless our results confirm that planets in a runaway accretion phase (M Mp ˙ 10-8MJ2yr-1) could be detected at infrared wavelengths >3 μm with currently available high-contrast imaging instruments.
7. Discussion and Conclusions
We have presented deep coronagraphic observations of TW Hya with the NIRC2 vortex coronagraph at the W. M. Keck Observatory in L′ (3.4–4.1 μm), a wavelength regime that provides unique sensitivity to self-luminous, young planets. Gaps previously detected in scattered light and thermal emission from the disk provide tantalizing evidence that planets may be sculpting features in the dust.
Our rigorous statistical analysis resulted in strict upper limits on the mass of non-accreting planets within the disk on the order of ∼1–2.5MJ. We also predict that actively accreting
planets with much lower masses may also fall within the detection limits of these observations. However, degeneracies in the modeled brightness of circumplanetary disks do not allow us to set upper limits for both the mass of protoplanets and their accretion rates, but only the product of the planet
Figure 3.Mass of non-accreting planetary companions corresponding to 95% completeness(see the contrast limits plotted in Figure1) for AMES-Cond,
BT-Settl, and AMES-Dusty models. The spread in the mass limits is due to the assumed range of stellar ages: 7–10Myr. The angular resolution of the telescope(i.e., λ/D) corresponds to ∼5au.
Figure 2.Result of the inner ADI reduction of the combined data from all three observing nights. Images(a) without and (b) with injected fake companions at ΔL=10.5 (or ∼1.5 MJaccording to the AMES-Cond model; see Section5),
at the positions of the gaps, are shown by the white circles. The color axis is in arbitrary units. Corresponding signal-to-noise ratio(S/N) maps confirming that (c)no statistically significant point sources appear within 50 au of the star and (d) thatthe injected companions would be detected if present in the data.
mass and the mass accretion rate M Mp ˙ with a given disk inner
radius Rin. For Rin=RJ, we obtain an approximate upper limit
of M Mp 10 8MJ yr
2 1
-
-˙ implying that a putative ∼0.1MJ
mass planet, such as might be responsible for opening the 24 au gap, is presently accreting at rates insufficient to build up a Jupiter mass within TW Hya’s pre-main-sequence lifetime.
This work also demonstrates an optimized high-contrast imaging observing strategy that combines the benefits of ADI with RDI to enhance the contrast limits achieved at small angular separations(0 3), unlocking the small inner working angle performance of vortex coronagraphs, which provide the high optical throughput (down to ∼1 λ/D) needed to detect faint companions.
Although these observations are motivated by the possibility that the TW Hya gaps are induced by planet–disk interactions, there are alternate mechanisms that may cause ring structures to appear in protoplanetary disks, including condensation fronts (Cuzzi & Zahnle2004) and zonal flows (Johansen et al.2009). Searching for protoplanets embedded in circumstellar disks tests the dynamical hypothesis; that is, detecting a point source in a disk gap would constitute compelling evidence that planets are opening the gaps. However, our non-detection does not necessarily rule out any of these scenarios.
Tighter constraints on the masses and accretion rates of protoplanets in the disk would require more multi-epoch coronagraphic observations with current ground-based infrared high-contrast imagers equipped with small inner working angle coronagraphs in the L′ band or longer wavelengths (Absil et al. 2016). Future instrumentation may enable higher sensitivity. For example, JWST-NIRCam will provide deep contrast limits of point sources in the outer gaps of TW Hya, but the inner working angle is not small enough to peer into the 24au gap. On the other hand, infrared adaptive optics instruments on future 30–40m class telescopes will likely surpass the sensitivity of NIRC2, and access even lower mass planets and/or lower accretion rates.
G.R. is supported by an NSF Astronomy and Astrophysics Postdoctoral Fellowship under award AST-1602444. The data presented herein were obtained at the W. M. Keck Observatory, which is operated as a scientific partnership among the California Institute of Technology, the University of California and the National Aeronautics and Space Administration (NASA). The Observatory was made possible by the generous financial support of the W. M. Keck Foundation. The authors wish to recognize and acknowledge the very significant cultural role and reverence that the summit of Maunakea has always had within the indigenous Hawaiian community. We are most fortunate to have the opportunity to conduct observations from this mountain. J.H.K. acknowledges support from NASA Exoplanets program grant NNX16AB43G to RIT. Part of this work was carried out at the Jet Propulsion Laboratory (JPL), California Institute of Technology, under contract with NASA. The research leading to these results has received funding from the European Research Council under the European Union’s Seventh Framework Programme (ERC Grant Agreement No. 337569), and from the French Community of Belgium through an ARC grant for Concerted Research Action. E.C. acknowl-edges support from NASA through Hubble Fellowship grant HF2-51355 awarded by STScI, which is operated by AURA, Inc. for NASA under contract NAS5-26555, for research carried out at the Jet Propulsion Laboratory, California Institute of Technology.
Facility: Keck:II (NIRC2).
Appendix
Derivation of Contrast Limits
The detection limits reported here provide afixed number of false positives per radial position R in the image, where the noise distribution associated with each position is calculated in an annulus whose inner and outer radii have a mean of R and a difference that corresponds to one FWHM of the off-axis PSF. The FPF as a function of R is given by
R N R R FPF 2 , 1 FP max p = ( ) ( )
where NFP is the acceptable number of false positives within
radial distance R<Rmax. R and Rmax are normalized by the
FWHM of the off-axis PSF (∼8 pixels) such that 2πR is the number of i.i.d. samples in an annulus about the star. Here, NFP=0.01 and Rmax=12.5 (equivalent to ∼1″). The FPF in
this case varies from 10−4at the inner working angle(∼0 1) to 10−5at 1″.
The threshold for detection as a function of radial positionτ (R) is given by R R Cst 1 FPFR 2 R 2 , 2 1 t s = - p -( ) ( ) (( ( ))∣( )) ( )
where σ(R) is the contrast corresponding to one standard deviation and Cst .
1
-( ) is the inverse of the Student-t cumulative distribution function, C x 1 2 t dt 2 1 , 3 x st 2 21
ò
n n pn n n = G + G + -¥ -n+ ⎛ ⎝ ⎜ ⎞ ⎠ ⎟ ( ∣ ) (( ) ) ( ) ( )whereν is the number of degrees of freedom, i.e., one less than the number of independent samples. Although the noise is assumed to be normally distributed, the Student-t distribution is
Figure 4. Mass accretion limits corresponding to the contrast limits within the most prominent gaps in the TW Hya disk, given as the product of the planet mass and the mass accretion rate M Mp ˙ as well as M˙ for a 0.1MJ
planet. Rinis the inner radius of the circumplanetary disk and RJis the radius of
used to account for the small number of i.i.d. samples available within the annuli at small angular separations (see the discussion in Mawet et al. 2014). Specifically, the number of i.i.d. samples is 2p -R 1 excluding the position of interest; therefore,ν=2π R−2. Thus, the threshold is also a function of separation, which varies from 8.1σ(R = 1) at the inner working angle to 4.5σ(R = 12.5) at 1″.
The completeness, or sensitivity, of an observation is described by the TPF(see, e.g., Lafrenière et al.2007; Wahhaj et al.2013). The signal level at a given completeness S(R) is given by
S R R R R Cst TPF 2 R 2 . 4 1 s t s p = + - -( ) ( ) ( ) ( ) ( ∣( )) ( )
The contrast associated with S(R) at 95% completeness (TPF=0.95) therefore varies from 10.1 σ(R = 1) at the inner working angle to 6.1σ(R = 12.5) at 1″. The contrast corresp-onding to one standard deviationσ(R) was calculated using the contrast_curve function in the VIP software package, which performs fake companion injection and retrieval to determine and compensate for signal losses owing to self-subtraction and over-self-subtraction effects(see, e.g., Absil et al. 2013). We injected planets in radial steps of one FWHM using a few planets at a time(depending on the frame size), with a spacing of 4–5 FWHM in between each planet. This was repeated until each separation was sampled along three directions in the image, evenly spaced in azimuth.
The resulting contrast limits are more conservative than that of the typically reported 50% completeness (TPF=0.5) contour with τ(R)=5 σ(R), but can be easily traced back to a meaningful prediction for false positives in the image. A 5σ (R) contrast curve assumes a fixed FPF as a function of R of 2.9×10⁻⁷and completeness of 50%. In comparison, we have employed a radially varying threshold that allows a higher number false positives(1% versus2.9 10 7 R 0.01%
max 2
p
´ - »
chance of a false positive within 1″) while accounting for the limited number of samples available in an annulus about the star at small angular separation. In addition, the upper limits on the contrast of point sources are obtained at a high value of completeness; that is, planets at the upper mass limit have a 95% probability of detection.
References
Absil, O., Mawet, D., Karlsson, M., et al. 2016,Proc. SPIE,9908, 99080Q
Absil, O., Milli, J., Mawet, D., et al. 2013,A&A,559, L12
Akiyama, E., Muto, T., Kusakabe, N., et al. 2015,ApJL,802, L17
Allard, F., Homeier, D., Freytag, B., & Sharp, C. M. 2012, in EAS Publications Ser. 57, Low-Mass Stars and the Transition Stars/Brown Dwarfs, ed. C. Reylé, C. Charbonnel, & M. Schultheis(Les Ulis: EDP Sciences),3
Andrews, S. M., Wilner, D. J., Hughes, A. M., et al. 2012,ApJ,744, 162
Andrews, S. M., Wilner, D. J., Hughes, A. M., Qi, C., & Dullemond, C. P. 2009,ApJ,700, 1502
Andrews, S. M., Wilner, D. J., Zhu, Z., et al. 2016,ApJL,820, L40
Baraffe, I., Chabrier, G., Barman, T. S., Allard, F., & Hauschildt, P. H. 2003,
A&A,402, 701
Bell, C. P. M., Mamajek, E. E., & Naylor, T. 2015,MNRAS,454, 593
Benisty, M., Juhasz, A., Boccaletti, A., et al. 2015,A&A,578, L6
Bergin, E. A., Cleeves, L. I., Gorti, U., et al. 2013,Natur,493, 644
Bowler, B. P. 2016,PASP,128, 102001
Bryden, G., Chen, X., Lin, D. N. C., Nelson, R. P., & Papaloizou, J. C. B. 1999,ApJ,514, 344
Canovas, H., Hardy, A., Zurlo, A., et al. 2017,A&A,598, A43
Cuzzi, J. N., & Zahnle, K. J. 2004,ApJ,614, 490
Debes, J. H., Jang-Condell, H., & Schneider, G. 2016,ApJL,819, L1
Debes, J. H., Poteet, C. A., Jang-Condell, H., et al. 2017,ApJ,835, 205
Donaldson, J. K., Weinberger, A. J., Gagné, J., et al. 2016,ApJ,833, 95
Dong, R., & Fung, J. 2017,ApJ,835, 146
Dong, R., Zhu, Z., Rafikov, R. R., & Stone, J. M. 2015,ApJL,809, L5
Ducourant, C., Teixeira, R., Galli, P. A. B., et al. 2014,A&A,563, A121
Gaia Collaboration 2016,A&A,595, A1
Garufi, A., Quanz, S. P., Avenhaus, H., et al. 2013,A&A,560, A105
Gomez Gonzalez, C. A. 2015, VIP: Vortex Image Processing Package for High-Contrast Direct Imaging doi:10.5281/zenodo.573261
Gomez Gonzalez, C. A., Wertz, O., Absil, O., et al. 2017,AJ,154, 7
Herczeg, G. J., & Hillenbrand, L. A. 2014,ApJ,786, 97
Hughes, A. M., Wilner, D. J., Calvet, N., et al. 2007,ApJ,664, 536
Isella, A., Carpenter, J. M., & Sargent, A. I. 2010,ApJ,714, 1746
Jeffries, R. D., Jackson, R. J., Franciosini, E., et al. 2017,MNRAS,464, 1456
Jenson-Clem, R., Mawet, D., Gomez Gonzalez, C. A., et al. 2017, ApJ, submitted
Johansen, A., Youdin, A., & Klahr, H. 2009,ApJ,697, 1269
Kastner, J. H., Rapson, V., Sargent, B., Smith, C. T., & Rayner, J. 2015, in Cambridge Workshop on Cool Stars, Stellar Systems, and the Sun 18, ed. G. T. van Belle & H. C. Harris,313
Lafrenière, D., Doyon, R., Marois, C., et al. 2007,ApJ,670, 1367
Lafrenière, D., Marois, C., Doyon, R., & Barman, T. 2009,ApJL,694, L148
Marois, C., Lafrenière, D., Doyon, R., Macintosh, B., & Nadeau, D. 2006,ApJ,
641, 556
Mawet, D., Choquet, É., Absil, O., et al. 2017,AJ,153, 44
Mawet, D., Milli, J., Wahhaj, Z., et al. 2014,ApJ,792, 97
Pecaut, M. J. 2016, in IAU Symp. 314, Young Stars Planets Near the Sun, ed. J. H. Kastner, B. Stelzer, & S. A. Metchev(Cambridge: Cambridge Univ. Press),85
Pinilla, P., Benisty, M., & Birnstiel, T. 2012,A&A,545, A81
Qi, C., Ho, P. T. P., Wilner, D. J., et al. 2004,ApJL,616, L11
Rapson, V. A., Kastner, J. H., Andrews, S. M., et al. 2015a,ApJL,803, L10
Rapson, V. A., Kastner, J. H., Millar-Blanchaer, M. A., & Dong, R. 2015b,
ApJL,815, L26
Serabyn, E., Huby, E., Matthews, K., et al. 2017,AJ,153, 43
Soummer, R., Pueyo, L., & Larkin, J. 2012,ApJL,755, L28
Thalmann, C., Mulders, G. D., Janson, M., et al. 2015,ApJL,808, L41
Vacca, W. D., & Sandell, G. 2011,ApJ,732, 8
van Boekel, R., Henning, T., Menu, J., et al. 2017,ApJ,837, 132
van der Plas, G., Wright, C. M., Ménard, F., et al. 2017,A&A,597, A32
Wahhaj, Z., Liu, M. C., Biller, B. A., et al. 2013,ApJ,779, 80
Weinberger, A. J., Becklin, E. E., Schneider, G., et al. 2002,ApJ,566, 409
Wright, E. L., Eisenhardt, P. R. M., Mainzer, A. K., et al. 2010,AJ,140, 1868
Zacharias, N., Finch, C. T., Girard, T. M., et al. 2013,ApJ,145, 44
Zhu, Z. 2015,ApJ,799, 16