HAL Id: hal-02938884
https://hal.archives-ouvertes.fr/hal-02938884
Submitted on 26 Nov 2020HAL is a multi-disciplinary open access archive for the deposit and dissemination of sci-entific research documents, whether they are pub-lished or not. The documents may come from teaching and research institutions in France or abroad, or from public or private research centers.
L’archive ouverte pluridisciplinaire HAL, est destinée au dépôt et à la diffusion de documents scientifiques de niveau recherche, publiés ou non, émanant des établissements d’enseignement et de recherche français ou étrangers, des laboratoires publics ou privés.
On the effect of a thermal treatment on the tensile and
fatigue properties of weak zones of similar Ti17 linear
friction welded joints and parent material
J.M. García, F. Gaslain, Thilo Morgeneyer
To cite this version:
J.M. García, F. Gaslain, Thilo Morgeneyer. On the effect of a thermal treatment on the tensile and fatigue properties of weak zones of similar Ti17 linear friction welded joints and parent material. Materials Characterization, Elsevier, 2020, 169, pp.110570. �10.1016/j.matchar.2020.110570�. �hal-02938884�
On the effect of a thermal treatment on the tensile and fatigue properties
of weak zones of similar Ti17 LFW joints and PM
GARCIA J.M., GASLAIN F., MORGENEYER T.F.
MINES ParisTech, PSL - Research University, Centre des Matériaux CNRS UMR 7633, BP 87 91003 Evry, France
Published in : Materials Characterization. Volume 169, 20 August 2020, 110570. DOI :https://doi.org/10.1016/j.matchar.2020.110570
Correspondence
Juan Manuel García – Email: jmgarcia.engineering@gmail.com
MINES ParisTech, PSL University, Centre des Matériaux. (CNRS UMR 7633), BP 87 91003, Evry, France. Funding information: Agence Nationale de la Recherche (Project number: ANR-14-CE27-0017).
Abstract
The tensile and fatigue properties and the damage mechanisms of as welded (LFW–AW) and post-weld heat treated (PWHT) similar Ti17 linear friction welded (LFW) joints as well as Ti17 parent material (PM) have been studied together with their underlying microstructures. The LFW–AW joints exhibited a depletion of the α phases in the weld centre zone (WCZ) and in the thermo-mechanically affected zone (TMAZ), which was previously qualified as a weak zone. Stereo Digital Image Correlation (SDIC) analysis of the strain field for monotonic loading of the PM showed strain heterogeneity that was linked by EBSD and Schmid's factor analysis to the large β grains containing α precipitates. Compared to the PM tensile specimens, the LFW–AW joint highlighted lower ultimate tensile strength (UTS) and a strongly reduced and scattered macroscopic ductility. Maps and spatio-temporal graphs of normalized strain rate fields obtained by SDIC clearly highlighted localization at the weak zone. For the target fatigue life of 105 cycles, the fatigue strength of the AW joint was about half that of the PM with fatigue crack initiation at the β grain boundary in the weak zones. Remarkably, the PWHT made the AW joints comparable to the PM in terms of microstructure and mechanical properties. The former weak zones recrystallized into β grains with α, the UTS and fatigue strength were almost recovered, macroscopic and local ductility were enhanced, failure during monotonic and cyclic loadings occurred far from the former weak zones.
Nomenclature
α (h.c.p.), hexagonal closed packed titanium crystal lattice; β (b.c.c.), body centred cubic titanium crystal lattice; F , friction axis; P , pressure axis; T , thickness axis; E, Young's modulus; Y , yield strength; UTS, Ultimate Tensile Strength; εmacro, macroscopic engineering strain; εPP, local strain
following the P axis; ˙εPP, local strain rate following the P axis; ˙εnorm, normalized strain rate with
respect to the instantaneous maximum; σmax, maximum fatigue stress; R, fatigue stress ratio; Nf,
fatigue life; ∆K, stress intensity factor; a, crack size; da/dN crack growth rate.
1
Introduction
Titanium alloys are used in multiple engineering fields such as the aerospace [1] and the biomedical industries [2, 3]. Despite their high cost, they highlight several advantages such as high resistance to corrosion, high strength/density ratio, creep resistance, fatigue crack propagation resistance, high compatibility of forming composites and weldability [4, 5].
β−metastable alloys are known for their high specific strengths, low elastic moduli, excellent fatigue/crack-propagation behaviour and excellent corrosion resistance [1, 6]. Nonetheless, their application has found some limitations because of their high formulations and machining costs, complex processing [7], low production volumes, and property scatter [8]. The application of different thermal treatments leads to the precipitation of the α phase following different sequences and kinetics [9] and, in some cases, developing texture [10]. These precipitations have a substantial impact on the tensile strength of the alloy [11]. β−metastable alloys are often but not only used in structural applications such as airframes [12]. For instance, in 1973, General Electric patented the invention of Ti−5Al−2Sn−2Zr−4Cr−4Mo for its utilization in fans and compressor discs due to its deep hardenability, fracture toughness and fatigue crack growth rates [13, 14]. This alloy has several denominations such as UNS R58650 for the American Unified Numbering System of alloys, TA5CD4 for the French denomination, TC17 for the Chinese standards and it is commonly known as Ti17.
In the aerospace industry, the increasing need to improve the buy-to-fly ratio led to the devel-opment of novel joining techniques [15]. A clear example of this is the invention of solid-state joining processes such as Linear Friction Welding [16]. In this process, a so called friction force is applied to a stationary workpiece positioned against an oscillating workpiece describing a linear oscillatory motion. Parent material and contaminants in the weld interface are extruded to form the so called flash. Once pure contact between the two materials has been achieved, a forging pressure is applied to achieve a target axial shortening also known as burn-off [17]. The high levels of plastic deformation
and localized heat generated around the weld interface provoke microstructural changes, unknown mechanical properties and considerable levels of residual stresses that are located in four distinct welding zones [17]: the weld centre zone (WCZ), the thermo-mechanically affected zone (TMAZ), the heat affected zone (HAZ) and the parent material (PM). LFW exhibits some advantages such as very short welding times, typically of the order of several seconds; the reduction of bulk milling operations and the possibility of performing dissimilar welds [18]. Conversely, LFW requires consid-erable investment and in some cases, compared to the PM, the weld can result in inferior mechanical properties.
The microstructural characterization and tensile properties of the Ti17 LFW joints have pre-viously been assessed. The microstructure of a dissimilar Ti17(lamellar)-Ti17(equiaxed) LFW joint exhibited a fine recrystallized zone at the WCZ with significant reduced microhardness [19]. A deple-tion of the hardening α phase was observed at the WCZ and TMAZ of a similar Ti5553 LFW joint that led to failure at the TMAZ during monotonic loading [20, 21]. Similarly, it has been recently explained that microstructures consisting in α depleted deformed β grains and fine equiaxed distorted βgrains were respectively developed at the WCZ and TMAZ of a similar Ti17 LFW joint that locally reduced microhardness [22]. The same microstructures were observed in the WCZ and Ti17 TMAZ of a dissimilar Ti17-Ti64 LFW joint by García et al. [23]. The authors have denominated the Ti17 TMAZ as a “weak zone” since it was the location for failure under monotonic loading, fatigue crack initiation and crack propagation during fracture toughness testing. The common factor among the above mentioned welds is the α depletion of the WCZ and TMAZ and their subsequent reduced mechanical properties. It seems clear that developing a thermal treatment that could favour the precipitation of the α phase for enhancing the mechanical properties of the weak zones in similar Ti17 LFW joints, is highly necessary.
The application of thermal treatments to LFW joints and their subsequent mechanical properties have already been assessed in literature. For instance, Tao et al. [24] carried out impact fracture toughness tests using specimens having notches centred at characteristics weld zones of dissimilar Ti17–Ti64 LFW joints, in the AW conditions and after two annealing thermal treatments. It has been shown that the reduced impact fracture toughness of the TMAZ and WCZ on the Ti17 side was increasingly improved with increasing annealing temperature. The standard thermal treatment for β−metastable alloys is solution treating followed by ageing (STA). The poor mechanical properties of the similar Ti5553 LFW joint studied by Dalgaard et al. [20] were significantly improved by a PWHT applied by Wanjara et al. [21]. The thermal treatment consisted in a solutionizing at 816 °C for 45 min in vacuum followed by argon quench and ageing at 621 °C for 8 h in argon followed by another argon quench. Precipitation of the α phase was achieved at the α depleted WCZ and
TMAZ. As a consequence, not only were the tensile properties improved but also, the PWHT tensile specimen never failed at the former weak zone (Ti17 TMAZ). Recently, Ballat-Durand et al. [22] proposed a STA thermal treatment for similar Ti17 LFW joints, in which the transition from the solution treatment to ageing phase is carried out through a slow temperature reduction. This thermal treatment is promising since the precipitation of the α was successfully achieved at the α depleted WCZ and TMAZ, and, with respect to the PM, microhardness was recovered up to 97 %. A study concerning the tensile and fatigue properties and damage mechanisms of similar Ti17 LFW joints having followed this thermal treatment is missing in the literature.
The present work is subscribed on the framework of a project focusing on several key aspects of LFW such as the microstructural characterization [22], the numerical simulation of the welding process [25], and the mechanical characterization reported herein. The aim of the present work is to identify the deformation behaviour, strength and fatigue strength of similar Ti17 LFW joints in the as welded and post welded heat treated conditions and to compare them to the behaviour of the parent material. Special interest is take in understanding the relationship between the macroscopic properties and the underlying microstructures previously characterized by Ballat-Durand et al. [22]. First, the crystal lattice orientation of PM grains is studied through multi-field electron backscatter diffraction (EBSD) mappings on the surface of PM and cross-weld tensile specimens. Second, the tensile properties are examined and the strain fields obtained by SDIC of all joints are compared to the underlying β grains crystal lattice orientation of the PM, through their Schmid's factor. The fracture mechanisms during monotonic loading are interpreted and related to the phases present in every microstructure. Third, the cyclic behaviour is assessed by a S–N approach and its associated fatigue crack initiation sites and propagation mechanisms are analysed. Finally, the contamination prior to welding, the benefits and effects of the post-heat weld treatment, as well as a potential optimization are discussed.
2
Experimental and materials
2.1
Parent Material
The PM used in this work was a Ti17 grade in the STA state provided by Timet. The solution treatment consisted in forging at 950 °C followed by air cooling. Then, the bulk was aged through an isothermal hold at 635 °C in a preheated furnace for 8 h and finally air cooled. The material was provided in the form of billets of 250 mm diameter. Blocks with 80 mm × 70 mm × 15 mm dimensions were machined by electrical discharge machining using a brass wire. The long direction of the blocks
coincided with the extrusion axis of the billet. The relationship between the two others directions of the blocks and the billet directions was unknown.
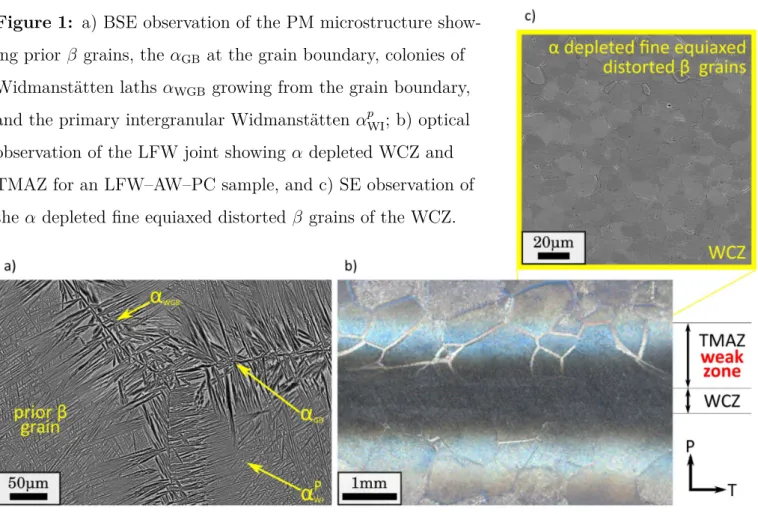
The microstructure of the PM billet used in this study was previously characterized by Ballat-Durand et al. [22] and is shown in Fig.1a. It consisted of 550 µm diameter prior-β grains (b.c.c.) containing α phases (h.c.p.) in four forms: grain boundary α (αGB), colonies of Widmanstätten
laths growing from the grain boundary (αWGB) and two kinds of intergranular Widmanstätten laths
(primary αp
WI and secondary αsWI). The entangled intergranular α p
WI had a length and width of
respectively 4.4 µm and 1.6 µm .
2.2
Linear friction welds
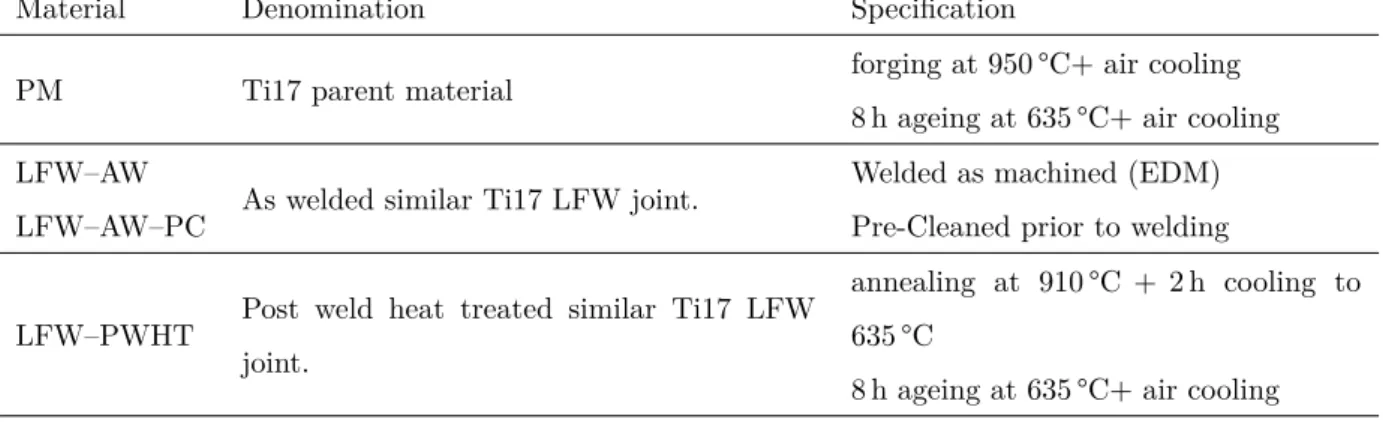
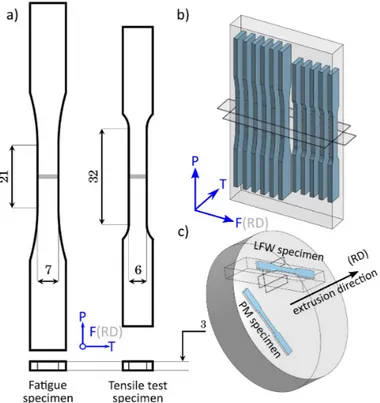
Three similar Ti17 LFW joints were produced by ACB. During joining, the frequency was f = 50 Hz, the amplitude was a = 2 mm, the friction and forging pressure were P = 90 MPa, and the target burn-off was 3 mm. Friction occurred parallel to the F axis, the friction and forging pressures were applied along the P axis, as shown in Fig.2. The third direction corresponded to the thickness T . The F axis was parallel to the long direction of the blocks and coincided with the RD direction of the billet. The first joint was welded in the as machined state after cutting by electrical discharge machining (EDM) using a brass wire (LFW–AW), the second joint was Pre-Cleaned prior to welding by grinding using a SiC paper P1200 for 2 min (LFW–AW–PC) and the third block was welded in the as machined state after cutting by EDM and post-weld heat treated (PWHT). The aim of producing the LFW–AW and LFW–AW–PC joints was to study the effect of prior to welding contamination on the mechanical properties of these joints. All configurations are summarized in Table1. The PWHT is described in Section 2.3.
Material Denomination Specification
PM Ti17 parent material forging at 950 °C+ air cooling 8 hageing at 635 °C+ air cooling LFW–AW
As welded similar Ti17 LFW joint. Welded as machined (EDM)
LFW–AW–PC Pre-Cleaned prior to welding
LFW–PWHT Post weld heat treated similar Ti17 LFW joint.
annealing at 910 °C + 2 h cooling to 635°C
8 hageing at 635 °C+ air cooling
Table 1: PM and similar Ti17 LFW joints configurations.
As a consequence of LFW, a depletion of the α phase occurred at the WCZ and TMAZ. The TMAZ exhibited a width of about 1.2 mm and its microstructure was formed by α depleted deformed
β grains (see Fig.1b). The Ti17 TMAZ is also known as a “weak zone” due to its proclivity to failure under various type of loadings by García et al. [23]. At the β grain boundary in the TMAZ, [22] observed a chemical contrast having a β crystal lattice that they denominated “traces of αGB+αWGB”
(see Fig.1b). The WCZ is shown in Fig.1c, its width was about 400 µm and it was formed by α depleted fine equiaxed distorted β grains having a diameter of about 10 µm [22].
Figure 1: a) BSE observation of the PM microstructure
show-ing prior β grains, the αGB at the grain boundary, colonies of
Widmanstätten laths αWGB growing from the grain boundary,
and the primary intergranular Widmanstätten αp
WI; b) optical
observation of the LFW joint showing α depleted WCZ and TMAZ for an LFW–AW–PC sample, and c) SE observation of the α depleted fine equiaxed distorted β grains of the WCZ.
2.3
Post-weld Heat treatment
The post-weld heat treatment applied to the LFW–PWHT joint in this study was performed by Ballat-Durand et al. [22] and it consisted of annealing at 910 °C for 2 h followed by furnace cooling to 635 °C in 2 h. The cooling rate was about 2.3 °C/min. Then ageing was performed at 635 °C for 8 hfollowed by air cooling.
After PWHT, the microstructure at the WCZ and TMAZ recrystallized into grains comparable to those of the PM. The grains at the former WCZ exhibited a diameter of a about 230 µm and microhardness of 390 HV. Compared to the PM, the grains at the former WCZ exhibited significant smaller diameter and a microhardness reduction of about 3% [22].
2.4
Microscopic observations
The samples were prepared by standard metallographic procedures consisting of mounting, grinding and polishing to a mirror-like quality. The parent material and welded joints were observed in a LEICA DMI 5000 M optical microscope and in a ZEISS Sigma 300 Scanning Electron Microscope (SEM) operated at 15 kV using a secondary electrons detector (SE) and a backscattered electrons detector (BSE). The fractographic analysis was carried out using a secondary SE detector in a ZEISS Sigma 300 SEM.
2.5
EBSD mapping and fractographic observations
EBSD characterization was performed over very large areas, i. e., the gauge length of the tensile specimens described in Section 2.6. The aims of the EBSD characterization are detailed in Section
3.1.
The tensile specimens were mounted in pairs in sample-holders customized for their geometry and were ground to a mirror-like quality using an Leco PX500 automatic polisher. The pressure force was set to 5 kN. The rotation frequencies of the polisher head and tray were respectively 25 Hz and 200 Hz. By increasing the difference between the rotation speeds of the polisher tray and the polisher head, long grinding periods are induced for which grinding marks continuously change their direction. In such a manner, the mirror-like quality is almost achieved by using only a SiC paper grit 1200 for 2 min. After grinding, the mirror-like quality was achieved by polishing using a solution composed of 200 mm3 colloidal oxide polish suspension and 200 mm3 distilled water for 24 h on a
Buehler VibroMet.
Multi-field EBSD mappings were carried out on a ZEISS Sigma 30 Scanning Electron Microscope (SEM) operated at 20 kV instrumented with a Nordif UF–1100 camera. EBSD patterns were indexed and computed using the TSL EDAX OIM v.7.3 software suite. The region of interest was the gauge length of three tensile specimens: one made of PM, one coming from the LFW–AW–PC joint and one coming from the LFW–PWHT joint. The specimen geometry is described in Section 2.6. For each tensile specimen, about 450 fields of 840 px×840 px were performed to cover an area of typically 32 mm × 6 mm with a step size of 10 µm. The working distance was 24 mm. Indexation was carried out taking into account only the β phase. No filter was applied for the visualization of the EBSD mappings of Fig.3. To perform the texture analysis (see Section 3.1) and the Schmid's computation (see Section 3.3), a grain size filter of 5 px and a minimal confidence coefficient of 0.2 filter were previously applied.
A study on the PM β grains texture over surfaces perpendicular to the extrusion axis of the billet was performed using the gauge length of the previously mentioned tensile specimens as metallographic samples. Texture in the plane normal to the billet extrusion axis is studied since this was the only direction able to be tracked during machining. To obtain a representative sample for the determination of texture, at least 2000 crystal orientations should be observed [26]. Considering the large size of PM grains of Ti17 (∼600 µm), large surfaces are required to properly carry out a study of texture.
As shown in Fig.2, the surface of the PM tensile specimen was perpendicular to the billet extrusion direction. Given that friction was parallel to the extrusion axis of the billet during welding, the PM far from the WCZ of a cross-weld tensile specimen is also contained in a plane perpendicular to the extrusion axis of the billet (see Fig.2). In this report, the texture analysis was carried out over a total of 2074 crystal orientations (1136 and 938 coming from the PM and cross-weld tensile specimens, respectively).
Schmid's factor mappings of the tensile specimen’ gauges lengths were performed for three slip systems: {110} [111], {112} [111] and {123} [111]. Considering that three slip systems were taken into account in the computation of the Schmid's factor, it is not possible to determine which one is more likely to be activated. On the contrary, given that Schmid's factor maps show the maximum computed factor among all slips systems, grains with lower Schmid's factors are likely to undergo relatively low plastic deformation, which could possibly be linked to low levels of local strain. To highlight this, the Schmid's factor colour bar in Fig.5 are inverted.
2.6
Tensile test
Four sets of tensile specimens were machined: 6 tensile specimens made of PM, 10 tensile specimens of the LFW–AW joint, 6 tensile specimens of the LFW–AW–PC joint and 6 tensile specimens of the LFW–PWHT joint. The denomination of every set of specimens is further explained in Table1. The PM tensile specimens were machined having their main surface perpendicular to the extrusion axis of the billet. All cross-weld specimens were machined parallel to a PT plane of the joint. The principal axis of the cross-weld specimens was parallel to the P direction. Gage length was 25 mm and cross section was 3 mm × 6 mm. Fig.2a shows the geometry of the tensile specimens. Tensile tests were conducted following the ASTM-E8 standard with a MTS 250 kN load frame at room temperature. Load frame cross-head speed was 0.032 mm s−1. Elongation was measured with optical extensometers
Figure 2: a) Specimen geometries for the tensile and fatigue specimens; schematic view of the
machining of the specimens b) on the welded joint and c) the billet. All specimens were machined parallel to a perpendicular plane to the extrusion axis of the billet and a P T plane for the weld. All measurements are given in millimetres.
2.7
Stereo Digital Image Correlation (SDIC)
During tensile testing, the local strain over the tensile specimens surfaces were monitored using a standard system of SDIC. A system of two 2048 px × 2048 px Manta G-419B cameras was set to follow the displacement of an artificial random black and white speckle applied with an airbrush over the gauge length of the tensile specimens. The distance between the cameras was a = 26 cm and the camera-object distance was b = 31 cm, leading to a field of view of 40 mm × 40 mm. Images were ex-ploited with Vic-3D™ from Correlated Solutions, Inc. (version 7.2.4, 2014). Acquisition was carried out taking 2 frames per second. Subset size was 35 px ≈ 175 µm, step size was 9 px and filter size was 15 px. Before tensile testing, the displacement and the Hencky εPP uncertainty measurements
were determined by correlating two consecutive images of the static specimen. Uncertainty in dis-placement measurements turned out to be 0.1 µm. This corresponds to a Hencky strain uncertainty of ∆εPP = 0.0002 with a standard deviation of σεPP = 9.56 × 10
−5%. The load line, the specimen
and the cameras frame were aligned using a laser level as a reference. Both cameras were aligned to gravity using a water spirit level.
2.8
Fatigue test
Standard fatigue tests of smooth specimens were carried following the ASTM 466-07 standard. Fa-tigue specimens made of PM and the three cross-weld joints described Table 1 were machined. PM samples were machined in a perpendicular plane to the extrusion axis of the billet. Tests were performed using 6 specimens made of PM, 5 LFW–AW weld specimens and 7 PWTHed cross-welded specimens. Cross-weld specimens were machined parallel to a P T plane of the joint, having its principal axis parallel to the P direction, as shown in Fig.2. The uniaxial tension zone had a length of 21 mm and a constant gauge section of 3 mm × 7 mm. A sinusoidal waveform was imposed using a MTS 250 kN servo-hydraulic load frame. The stress ratio was R = 0.1 and the test frequency was 20 Hz. The corners of specimens were rounded with a file and their surfaces were polished to a mirror-like quality. The target fatigue life was Nf = 105 cycles.
3
Results
3.1
Microstructure: EBSD analysis for location of the WCZ, β crystal
lattice orientation and PM texture analysis
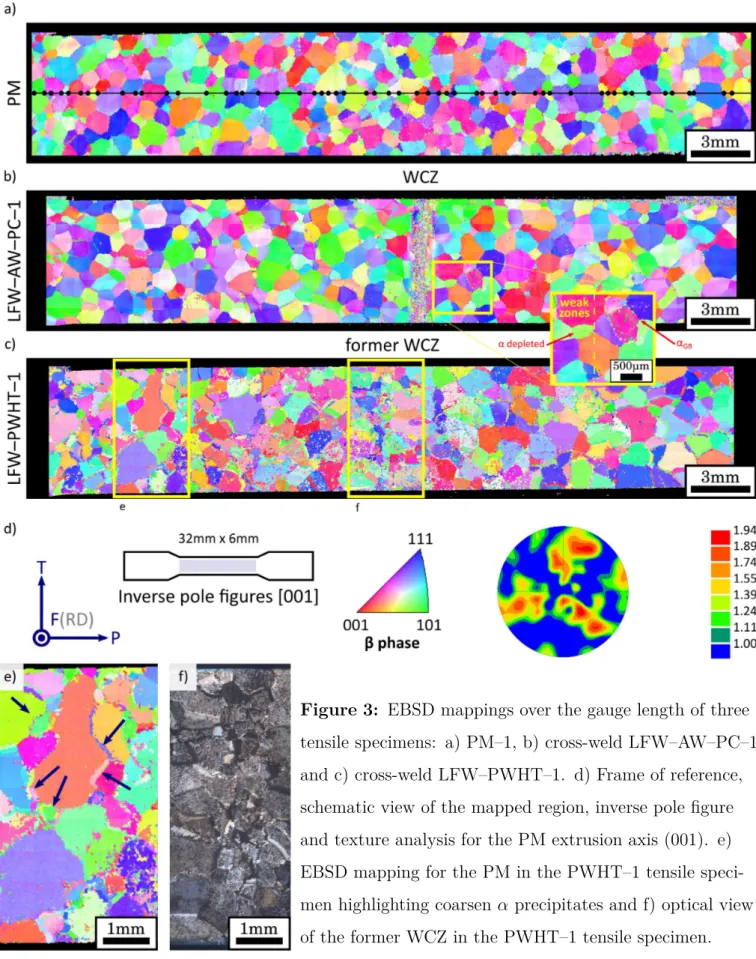
Crystal lattice orientation mappings over the gauge length surface of three tensile specimens were performed (see the schematic view of Fig.3d). The aim of these mappings is threefold. First and most importantly, to locate the WCZ on the cross-welded tensile specimens. This is particularly important for the PWHT tensile specimens since the only marker of the former WCZ is the grain size. Second, to acquire information about the underlying crystal lattice orientation so as to relate it to the local strain measured by SDIC of large β grains (see Section 3.3). Finally, to study potential textures on the PM parallel to the billet extrusion axis.
The inverse pole figures for the PM, LFW–AW–PC and PWHT tensile specimens are respectively shown in Figs.3a,3b and 3c. All inverse pole figures are referred to the frame of reference and pole figure in Fig.3d. The PM grain size was measured using the Average Grain Intercept method over the black generatrix line in Fig.3a. Every black dot represents a grain boundary intercept. With a total of 57 intercepts over a distance of 34.2 mm, the grain size turned out to be ∼600 µm. Considering the grain diameter and the 6 mm × 3 mm surface of gauge length of the tensile specimens, it can be estimated that roughly 10 × 5 grains could respectively be found on the gauge length of each tensile specimen, which is a very low number of grains compared to the tensile specimens made of other engineering materials. This could be the origin of the property scatter evoked by Cotton et al. [8].
Figure 3: EBSD mappings over the gauge length of three
tensile specimens: a) PM–1, b) cross-weld LFW–AW–PC–1 and c) cross-weld LFW–PWHT–1. d) Frame of reference, schematic view of the mapped region, inverse pole figure and texture analysis for the PM extrusion axis (001). e) EBSD mapping for the PM in the PWHT–1 tensile speci-men highlighting coarsen α precipitates and f) optical view of the former WCZ in the PWHT–1 tensile specimen. Considering the tensile specimen and grain sizes, the question about the representative elementary volume arises.
WCZ location on the cross-weld LFW–AW, LFW–AW–PC and PWHT tensile speci-mens Fig.3b shows the inverse pole figure of the LFW–AW–PC tensile specimen. The WCZ is
highlighted with a yellow rectangle, elsewhere the PM β grains can be recognized. The inverse pole figure of the PWHT tensile specimen is shown in Fig.3c. Compared to the inverse pole figures of the PM and LFW–AW–PC tensile specimens (see Figs.3a-b), the β indexation of the PWHT tensile specimen exhibits a lower quality (see Fig.3c). It is noteworthy that the indexation quality is par-ticularly low at the β grain boundary for all specimens. This can be explained by the presence of αGB and αWGB at these locations. This is clearly highlighted for the PWHT tensile specimen (see
blue arrows Fig.3e) but notice that this effect was more subtle for the PM and LFW–AW–PC tensile specimens. It seems that the PHWT has coarsened the α phases at the grain boundary, which may imply that the LFW–PWHT joint may have slight differences in the monotonic and cyclic behaviours with respect to the PM. Conversely, this effect is not observed in the Ti17 TMAZ (see the higher magnification view of of Fig.1). This highlights the depletion of the α phase at the weak zones.
Whilst the PWHT tensile specimen mapping is compromised with some noise, it is interesting to note that the former WCZ can easily be located even if it is not as clear as for the LFW– AW–PC tensile specimen (see the yellow rectangle at the centre of Fig.3c). To confirm this, an optical microscopic observation of this region is shown in Fig.3f. The relatively smaller recrystallized β grains at the former WCZ can be seen. This is remarkable since it shows that the PWHT has effectively achieved the recrystallization of the WCZ into PM β grains, as explained by Ballat-Durand et al. [22]. It is also interesting to notice that the β grains of the PM and the α depleted deformed β grains of the former TMAZ, previously denominated as a weak zone by García et al. [23], are no longer distinguishable.
Finally ,the determination of the locations of the WCZ (LFW–AW–PC) and former WCZ (PWHT), so as to compare them with failure location during monotonic and cyclic loading is of critical importance for judging the quality of the PWHT in terms of mechanical properties.
PM microstructure texture analysis The pole figure in Fig.3d accounts for 2074 β crystal
orientations in both PM and LFW–AW–PC tensile specimens (see Section 2.5). No pattern is observable. The maximum intensity value is 1.94. These findings indicate that no significant texture could be observed parallel to the extrusion direction of the billet. The EBSD mappings presented herein do not have a sufficient resolution fo the study of texture in the WCZ. A study on texture of the WCZ of the similar Ti17 LFW joint studied here was carried out by Ballat-Durand et al. [22] and, as for the similar Ti5553 LFW joint studied by Dalgaard et al. [20], a striking texture on {110}h111iparallel to the friction direction was revealed.
3.2
Tensile behaviour
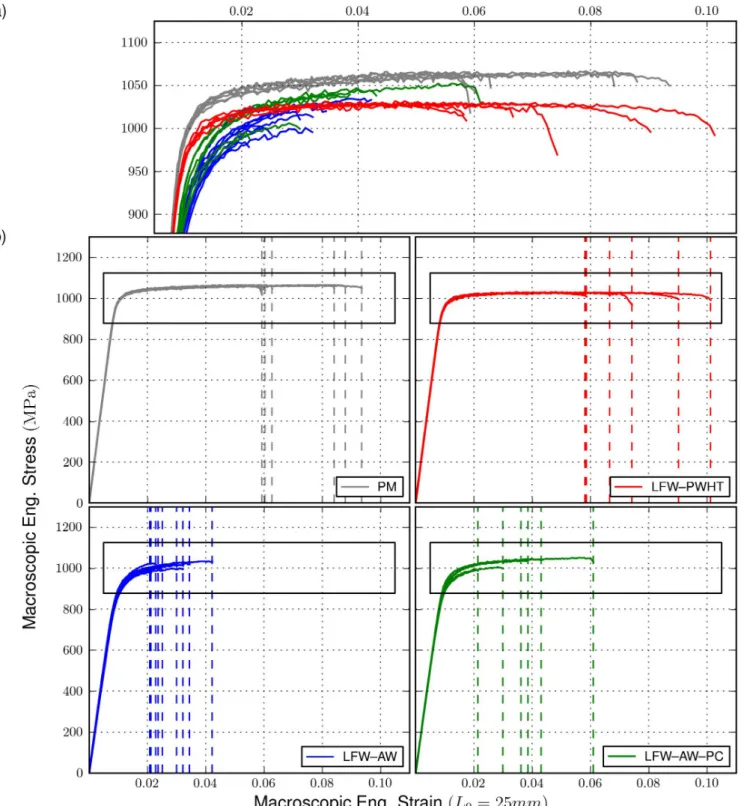
The aim of this Section is to study the tensile properties of the PM, LFW–AW, LFW–AW–PC and PWHT tensile specimens. Special interest is drawn on the tensile properties of the cross-weld tensile specimens (LFW–AW and LFW–AW–PC) and the tensile specimens coming from the LFW–PWHT joints. The tensile curves for each set of specimens are shown in Fig.4b. A comparison of the macroscopic plastic behaviours of all tensile specimens is shown in Fig.4a. The tensile curves are plotted in grey for the PM, in blue for LFW–AW joint, in green for the LFW–AW–PC joint and in red for the LFW–PWHT joint. The vertical dashed lines on each graph of Fig.4b indicate the strain to failure of each tensile specimen.
The PM tensile specimens showed a UTS of 1066 MPa and minimum, a mean and a maximum macroscopic engineering strains of 0.059, 0.074 and 0.093, respectively. The PWHT tensile specimens showed a mean UTS of 1030 MPa and minimum, a mean and a maxima macroscopic engineering strains to failure of 0.058, 0.047 and 0.101, respectively.
The LFW–AW tensile specimens showed a mean UTS of 1011 MPa and minimum, mean and maxima macroscopic engineering strains to failure of 0.020, 0.028 and 0.042, respectively. The LFW–AW–PC tensile specimens showed a mean UTS of 1061 MPa and minimum, mean and max-ima macroscopic engineering strains to failure of 0.021, 0.038 and 0.066, respectively. Notice that, compared to the PM, not only is the UTS lower but also, the macroscopic ductility is highly reduced. These properties are undesirable for engineering applications. Furthermore, no significant difference is observed between the behaviours of the LFW–AW and EMD-GD tensile specimens.
The PM tensile specimens showed a weak hardening, low macroscopic stress drop during necking and significant ductility. The strong scatter in macroscopic strain to failure is consistent with the property scatter previously described for this alloy [8]. Compared to the PM tensile specimens, the UTS is slightly reduced and the strain to failure is greater but it exhibits a comparable scatter. The slight UTS reduction and the coarsening of the α phases explained in Section 3.1 are in accordance with the relationship between the UTS and mean width of the α phases explained by Aeby-Gautier et al. [27] and Zhang et al. [28]. Nevertheless, its should be noted that the tensile properties of the PWHT tensile specimens are remarkably better that those of the cross-weld specimens.
Unlike the PM, the cross-weld specimens (LFW–AW and LFW–AW–PC) failed at the UTS with a reduced macroscopic ductility confirming the weld undermatching strength anticipated by the microhardness profiles previously registered [19, 22, 29]. The values of strain to failure and UTS registered for the cross-weld specimens are in good agreement with the results reported by Li et al. [29]. Furthermore, failure occurred without a drop on the macroscopic stress exhibiting no
Figure 4: a) Tensile test curves comparison and b) tensile test curves for the PM tensile specimens
(gray lines), LFW–AW tensile specimens (blue lines), LFW–AW–PC tensile specimens (green lines) and PWHT (red specimens). The vertical dashed lines in each subplot of Fig.4b indicate the strain to failure for each tensile specimen.
substantial necking. These findings clearly suggest that, for the welding configuration studied here, the α depleted WCZ and TMAZ are a threat for the integrity of the cross-welded structure in terms of monotonic behaviour. To properly assess the tensile behaviour of both the TMAZ and the WCZ, local strain measurements would be required.
3.3
DIC strain field measurement and localization
The main objective of this Section is to study the relationship between the strain fields obtained by SDIC and the underlying microstructure of three tensile specimens:
• the β grains containing α precipitates of a PM tensile specimen;
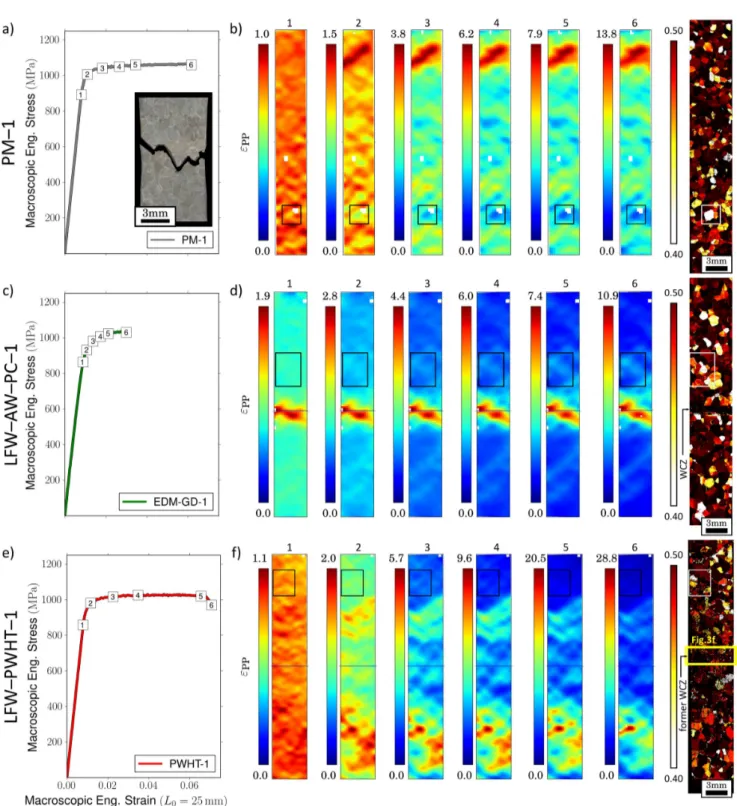
Figure 5: a-c-e) Tensile tests, b-d-f) εPP cumulated strain fields and Schmid's factor mappings for
the tensile specimens: a-b) PM–1, c-d) LFW–AW–PC–1 and e-f) PWHT–1. Strain in the strain maps is given in %.
• the large α depleted β grains of the TMAZ and fine equiaxed distorted β grains of the WCZ of a LFW–AW–PC tensile specimen and
• the recrystallized former WCZ and TMAZ of a PWHT tensile specimen.
The tensile test curve for the PM–1, LFW–AW–PC–1 and PWHT–1 tensile specimens are respectively seen in Figs.5a, 5c and 5e. For each specimen, the cumulated local strain parallel to the P axis (εPP)fields can be seen in the subplots of Figs.5b,5d and 5f. Each subplot corresponds to the
instants indicated with numbers on each tensile test curve. Each εPP map holds its corresponding
colour bar on its left. The minimal value has been set to zero for all maps. The white dashed lines on each map of Figs.5d and 5f respectively show the position of WCZ and the former WCZ.
PM tensile specimens The εPP field for the PM–1 tensile specimen is rather homogeneous during
elastic loading (see Fig.5b, map 1). After the onset of macroscopic plasticity on map 2, the ratio between the maximum and minimum εPP increases and is greater than 3. The εPP localizes in
diagonal bands such as the localization band at the top of the ROI. The maximum εPP was 13.8 %
having failed close to the upper grip. As for most engineering materials, the εPP field for a tensile
specimen made of Ti17 would be expected to be rather homogeneous but interestingly, this is not the case.
Using the crystal orientations obtained by EBSD shown in Section3.1, a Schmid's factor mapping for three slipping systems has been plotted in Fig.5b. Three slip systems of the β phase are mapped: {110} [111], {112} [111] and {123} [111]. Two facts should be noticed. First, strain bands in the εPP
fields go through several grains. It seems that, in every band, the observed mesoscopic deformation is the result of the contribution of about ten grains. A similar phenomenon has been observed on the micro DIC strain fields over Zirconium grade 702 and titanium aluminide registered by Héripré et al. [30]. Second, the strain bands measured by SDIC apparently avoid the low Schmid's factor grains (regions highlighted by rectangles in Figs.5b, 5d and 5f). Despite this information does not take into account the contribution of the α phases nor the complex stress field generated by the three-dimensional distribution of grain orientations, it is fairly reasonable to conclude that the observed εPP field heterogeneity is highly influenced by the β grains crystal orientation distribution.
LFW–AW–PC tensile specimens During elastic loading, the εPP field was somewhat greater
at the WCZ and TMAZ (see map 1 in Fig.5d). Far from the WCZ, strain bands similar to the those observed in the PM–1 tensile specimen are seen (see Fig.5b). During elastic loading, the measurement of εPP for the cross-weld specimens is greater at the WCZ and TMAZ than at the PM. This suggests
that the depletion of the α phase at these locations entails a significant reduction of the local Young's modulus with respect to the microstructure of the PM containing β grains with α precipitates. The WCZ and TMAZ exhibited higher εPP up to final rupture. This phenomenon is consistent with
the typical drop in microhardness at the WCZ and TMAZ exhibited by similar Ti17 LFW joints [19,22,29] and it explains the reduced macroscopic ductility exhibited by the LFW–AW–PC tensile specimens in Fig.4. This information is very interesting because it further highlights that the WCZ and TMAZ are threats for the integrity of the welded structure. Nevertheless, precisely locating both the first stages of plastic activity or failure on the welded structure is not possible by observing the εPP fields. This question is further analysed in Sections 3.4 and 3.5.
PWHT tensile specimens Unlike the LFW–AW–PC–1 tensile specimen, the εPP map
corre-sponding to the elastic domain is homogeneous (map 1 in Fig.5f). This suggests that the PWHT has successfully homogenized Young's modulus at the former WCZ and TMAZ. The second εPP
map corresponds to the onset of the macroscopic plastic activity. The εPP field becomes increasingly
heterogeneous over the loading history. Both the heterogeneity on the elastic domain and the strain bands on the plastic domain are reminiscent of the strain field of the PM–1 tensile specimen. More-over, no traces of the former WCZ can be detected in terms of strain. On the contrary, strain seems to be lower in the former WCZ, which may be due to the smaller grain size.
3.4
Normalized strain rate field and plastic activity tracking for the
LFW–AW–PC tensile specimen
In this Section, the chronological sequence of plastic activity on the welded structure is studied by the use of normalized strain rate ( ˙εnorm
PP ) maps. The ˙εnormPP is computed by normalizing the instantaneous
strain rate ( ˙εPP) on a generatrix line with respect to the maximum ˙εPP found on the entire ˙εPP field,
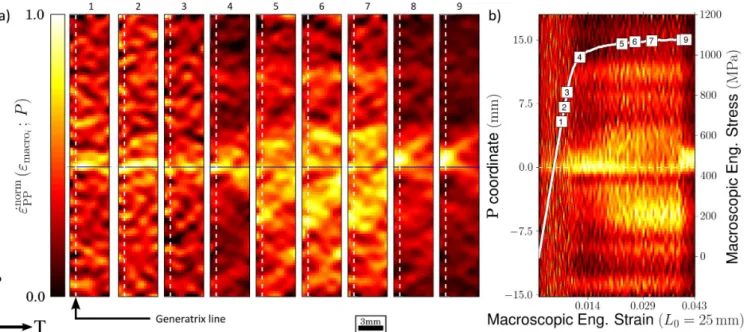
for each value of the macroscopic engineering strain. The expression for the computation of the normalized strain rate is written in Eq.1. A similar computation of the normalized strain rate has previously been introduced and explained by the authors of the present work [31].
˙ εnormPP (εmacroi; P ) = ˙ εPP(εmacroi; P ) max { ˙εPP(P ; T ; εmacroi)} (1) The ˙εnorm
PP fields of nine typical instants for the LFW–AW–PC–2 tensile specimen are shown in
Figs.6a. The frame of reference has been set so that the position of the WCZ is at the 0 coordinate of the P axis. A spatio-temporal graph of the ˙εnorm
Figure 6: a) Surface normalized strain rate field for nine instants on the tensile test curve for the
LFW–AW–PC-2 tensile specimen. and b) spatio-temporal graphs of the normalized strain rate over the generatrix line indicated in Fig.6a with the overlaid tensile test curve indicating the nine instants of Figs.6a-c. The expression for the computation of the normalized strain rate is detailed in Eq.1.
The first three ˙εnorm
PP maps correspond to the macroscopic elastic domain. The εPP and ˙εnormPP fields
are maxima in the vicinity of the WCZ (see Figs.6 and 5d). The ˙εnorm
PP map number 4 corresponds
to the first map after the onset of macroscopic plastic activity. It should be noticed that, not only is the ˙εnorm
PP a maxima at the WCZ but also, the ratio between the ˙εnormPP at the WCZ and the ˙εnormPP
far from it has increased. It seems that the first stage of plastic loading takes place at the WCZ. At the ˙εnorm
PP map number 5, the ˙εnormPP becomes heterogeneous suggesting that the WCZ underwent
some hardening inducing a strain increase on the entire gauge length. At the UTS (map number 8), localization is observed at the upper TMAZ. It is interesting to see that, despite the initial stages of plastic deformation occur at the WCZ, failure is located at the TMAZ. The failure location is in agreement with the weld undermatching strength values previously announced by the local lower microhardness [19, 20, 22, 29] and with the failure location of a dissimilar Ti17-Ti64 LFW joint studied by García et al. [23] and of a similar Ti5553 LFW joint identified elsewhere [20].
3.5
Strain to failure and failure location
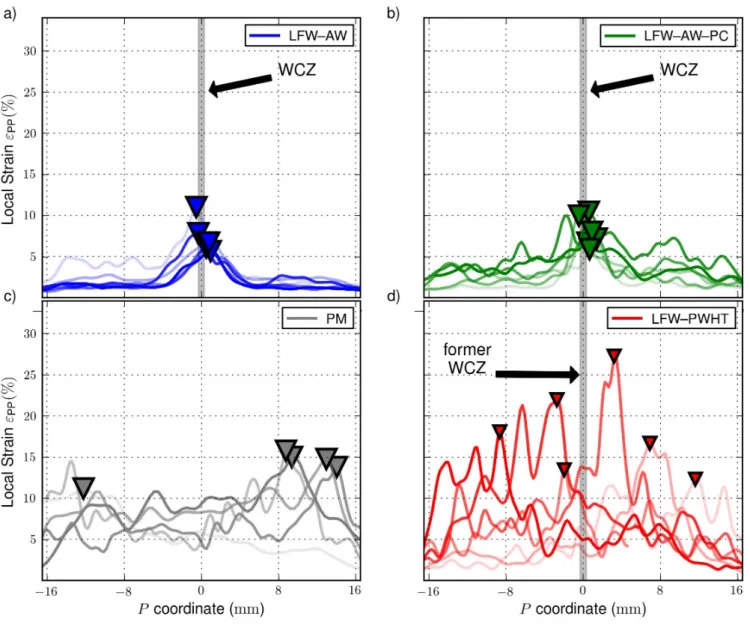
To illustrate further the effectiveness of the PWHT in terms of monotonic behaviour, the failure location and maximum εPP of all specimens are studied through the strain profiles of Fig.7. The
horizontal axis of each subplot represents the P coordinate of a generatrix line of the tensile specimens. The frame of reference has been set so that the position of the WCZ is at the 0 coordinate of the
P axis. The vertical axis represents the εPP strain level to failure. The strain profile is depicted in
blue for the LFW–AW tensile specimens (Fig.7a), in green for the LFW–AW–PC tensile specimens (Fig.7b), in grey for PM tensile specimens (Fig.7c) and in red for the PWHT tensile specimens (Fig.7d). Each specimen is represented with a different level of opacity in every subplot. For each specimen, failure location is indicated with triangles. The grey rectangle in the background of Figs.7a-b-d schematically shows the position of the WCZ and the former WCZ.
The maximum εPP respectively was 18 % and 28 % for the PM and PWHT tensile specimens.
The large scatter in maxima εPP shown by the PWHT tensile specimens is in agreement with the
macroscopic ductility scatter seen in Fig.4. The LFW–AW and LFW–AW–PC tensile specimens exhibited maxima εPP of about 12 %. Failure was located at the weak zone (Ti17 TMAZ). This
in agreement with the failure location of several similar β−metastable titanium alloys LFW joints studied previously [19,20,22,23, 29]. The most remarkable fact is that, unlike as for the cross-weld tensile specimens, the PWHT tensile specimens never exhibited failure at the former WCZ.
3.6
Monotonic loading fracture mechanisms
3.6.1 Fracture mechanisms of PM tensile specimen
A typical fractograph of a PM tensile specimen is shown in Fig.8a. The yellow dashed line in Fig.8a and the observation of Fig.8b highlights a feature with size and morphology similar to the β grains of the PM. Yellow arrows point to secondary cracks that are also observed. The size of flat fracture zones and their orientation resemble grain surfaces. The failure mechanisms seem to be partly intergranular. It seems that intergranular rupture occurred on prior β grains. This phenomenon is also observed and further studied on the fractographical analysis of the cross-weld specimens, discussed later in this Section. Equiaxed and elongated fracture features can be seen. It appears that failure occurred first through intergranular fracture followed by coalescence through transgranular fracture. In Figs.8d-e, objects at the β grain boundary that may be linked to the αGB can be seen. The topography of the
rupture surface is composed of two grain boundary planes forming an acute angle which also suggests a relationship with the underlying grain boundary.
3.6.2 Fracture mechanisms of the LFW–AW–PC tensile specimen
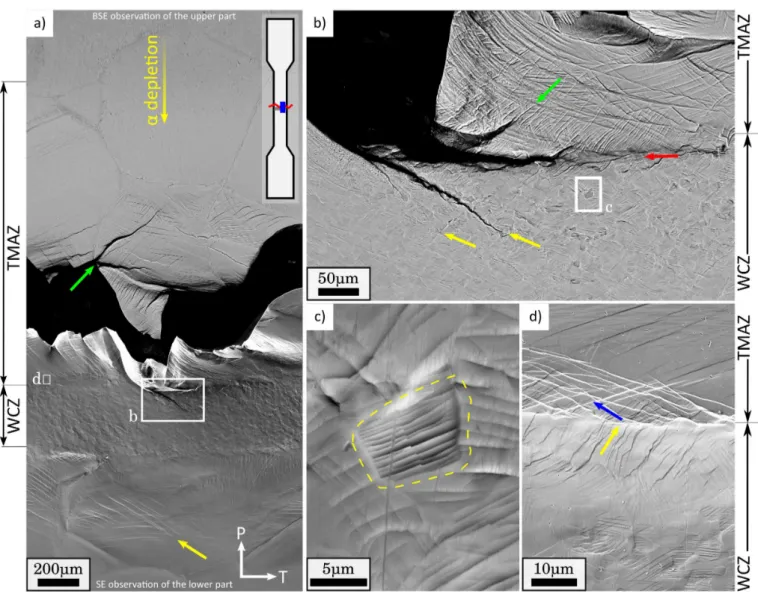
To identify the failure location on the as welded structure in a more accurate manner, post mortem observations were performed on the specimen surface. The failure location and both parts of the tensile specimen can be seen in Fig.9a. The upper and lower parts of the tensile specimen were
Figure 7: Strain profiles to failure over a generatrix line for the a) LFW–AW; b) LFW–AW–PC; c)
PM and d) PWHT tensile specimens.
observed using respectively BSE and SE detectors. Observations were carried out in the region highlighted in blue as depicted in the schematic drawing of the tensile specimen overlaid in Fig.9a.
The yellow arrow on the lower part indicates parallel curvilinear lines that convey the shape of slip bands (see Fig.9a). A horizontal region of about 400 µm height is revealed for which the surface roughness resembles the fine equiaxed distorted β grains of the WCZ. On both sides, the α depleted deformed β grains of the TMAZ can be seen. The chemical contrast at the TMAZ-HAZ transition is indicated with a yellow arrow that highlights the depletion of the α phase from the HAZ to TMAZ with a transparency gradient (see Fig.9a). The most remarkable fact is that rupture occurs at the TMAZ close to the frontier with the WCZ. Similar failure locations were found for comparable LFW joints elsewhere [20, 21, 23, 29]. The green arrow in Fig.9a indicates two cracks that have an intersection at a grain boundary. The longer crack seems to be transgranular and parallel to slip
on the fracture surface.
The zone depicted by the white rectangle of Fig.9a is observed using the BSE detector in Fig.9b. The red arrow points to the boundary between the WCZ and TMAZ. At the WCZ, the distorted β grains can be seen. In some regions, slip lines cross several grains which is consistent with the existence of microtextured zones that may favour deformation along similarly oriented planes, as documented by Ballat-Durand et al. [22]. In particular, the thicker yellow arrow of Fig.9b shows a crack in the WCZ that is parallel to mesoscopic localization bands. Nonetheless, it can be seen that the slip bands are locally oriented for many grains. An example of a WCZ fine equiaxed distorted β grains with locally oriented slip bands is shown in Fig.9c. This local orientation phenomenon is not seen on the TMAZ since grains are much bigger at this location. The WCZ-TMAZ boundary effect is highlighted by the fact that slip bands change their direction at this frontier (yellow and blue arrows). There is a high probability of finding orientations of small grains that make the slip transfer from the big TMAZ grains to the small WCZ grains difficult and thereby these small grains could increase local dislocation pile-up due to the strong size gradient and the quality of the grain boundary at WCZ-TMAZ frontier.
Figure 8: Fractograph of a typical PM tensile specimen showing a) the entire surface; b) the
intergranular fracture surface of β grain; c) dimples at the the intergranular fracture surface of β grain; d-e) fracture mechanisms at the β grain boundary.
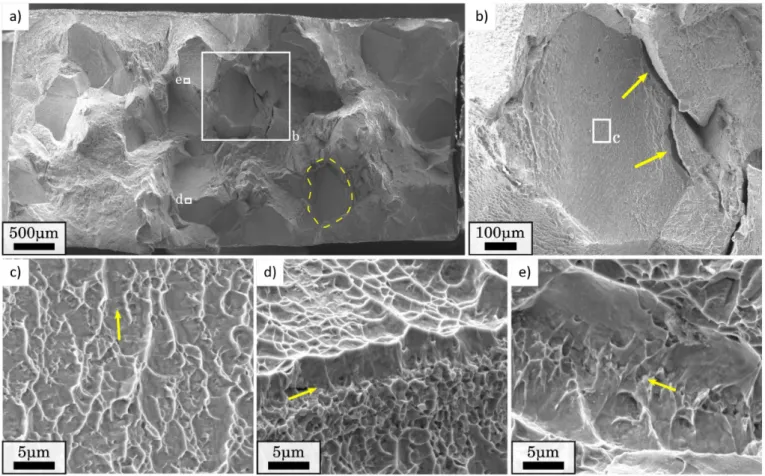
The fracture mechanisms of the microstructures of both the WCZ and TMAZ can be observed on the fracture surface of the LFW–AW–PC tensile specimen in Fig.10a. The dimples observed in Fig.10b are of a size of about 10 µm diameter and convey the shape of the WCZ fine equiaxed distorted β grains. As for the PM tensile specimen fracture surface studied earlier on this Section, some features resembling to the prior β grains can be seen (see the yellow dashed lines in Fig.10a). In Fig.10c, a cluster of elongated fracture features that were also observed on the fracture surface of the tensile, fatigue and fracture toughness specimens that failed at the weak zone (Ti17 TMAZ) of a dissimilar Ti17-Ti64 LFW joint by García et al. [23]. Other clusters of elongated fracture features are indicated by yellow arrows in Fig.10a. These clusters were related to the former α phases in the α depleted β grains of the weak zone (Ti17 TMAZ), as pointed out by García et al. [23]. It is worthwhile noticing that, in Fig.10d, another cluster of elongated fracture features is observed but
Figure 9: Post-mortem observations of the LFW–AW–PC tensile specimen surface showing a) the
upper and lower parts of the tensile specimen using respectively using BSE and SE detectors; b) WCZ-TMAZ boundary showing slips bands and secondary cracks ; c) a WCZ fine equiaxed distorted β grains showing the locally oriented slip bands, and d) Slip bands at the WCZ-TMAZ boundary.
here, the elongated fracture features are much smaller. This may suggest that, in this observation, the elongated fracture features associated with the former αWGB colonies of β grain. This interpretation
seems very likely since the cluster is located close to the border of a feature that conveys the shape of β grain (see yellow dashed line in Fig.10a).
In Fig.10e and 10f, 3D SEM observations of the clusters of elongated fracture features are shown. This observation is very interesting since the elongated fracture features exhibit a very similar morphology to the rhombus-shape voids observed by García et al. [23], which may confirm that these elongated feaures are indeed voids at the origin of a ductile rupture.
3.6.3 Fracture mechanisms ofLFW–PWHT tensile specimens
Fig.11a shows the fractograph of the LFW–PWHT–2 tensile specimen. In Fig.11b, an elongated feature very similar to the αp
WI in the core of β grains can be seen. Typical fracture features found
on the fracture surface of LFW–PWHT–2 tensile specimens are shown in Fig.11c-d. For the sake of comparison, features revealed on polished sections of the PM of PWHT samples, having strong
Figure 10: Fractographs of a LFW–AW–PC cross-weld tensile specimen showing a) the entire
fracture surface; b) equiaxed objects with comparable size to the distorted β grains at the WCZ; elongated dimples with comparable morphology to c) the αWI in the core of β grains and to d) the
αWGB colonies at the PM grain boundary –notice the difference in scale between c and d–; e and f)
Figure 11: a) Fractograph of the LFW–
PWHT–2 tensile specimen; b) elongated fracture feature similar to the αp
WI in the core of PM β
grains ; c-d) SEM fractographs of the PWHT tensile specimen for comparison with e-f) BSE observations of the PM microstructure far from the former WCZ.
similarities with features found on the SEM fractographs, were chosen and observed using the BSE detector. For instance, in the observations shown in Figs.11e and11f, the αGB and colonies of αWGB
can be seen at a grain boundary. In Figs.11c and 11d, linearly shaped objects are indicated with yellow arrows that show remarkable similarity with the αGB at the grain boundary (see Figs.11a and 11c), in terms of morphology, width and length. It seems plausible that these linearly shaped objects are indeed αGBlayers at the grain boundary. Furthermore, finer linearly shaped objects are indicated
with a green arrow in Fig.11b, which convey the shape of αWGB colonies. In Fig.11d, a flat surface
is indicated with a green arrow, it seems that fracture occurred at the interface of the β matrix and a αWGB platelet having the normal to its surface very close to the normal of the observation plane.
The presence of the different kinds of α phases is seen in every fracture mechanism. These findings are in agreement with the coarsening of the αGB layer and the αWGB colonies explained in Section 2.1 and the intergranular rupture mechanisms due to coarsening of the α precipitates explained by Ivasishin et al. [32].
3.7
Fatigue
3.7.1 Cyclic behaviour
Fig.12 shows the the Wöhler curves for the PM fatigue specimens (grey triangles), the LFW–AW fatigue specimens (blue triangles) and the LFW–PWHT fatigue specimens (red triangles). For the target life of 105 cycles, the fatigue strength was 450 MPa for the LFW–AW fatigue specimens and
720 MPa for both the PM and LFW–PWHT fatigue specimens. The Wöhler curves for the PM
and LFW–PWHT fatigue specimens are almost the same, having the LFW–PWHT curve a slightly lower slope. This is very desirable and can be explained by the similarity of the LFW–PWHT joint and PM microstructures. The LFW–AW fatigue specimens curve is far from this first two which is consistent with a different microstructure since, as will be shown in Section 3.7.3, failure took place at the TMAZ. The fatigue crack initiation site for the LFW–PWHT fatigue specimens was never on the former WCZ. Given the β grain size, only a few grains are contained in the thickness of the fatigue specimens, as explained in Section 2.5. This puts into question the representivity of the fatigue specimen and may explain the observed scatter in fatigue life, since fatigue crack initiation takes place in crystallographic planes and preferential orientations.
Figure 12: Wöhler curves for the PM (gray), LFW–AW (blue) and PWHT (red) fatigue specimens.
3.7.2 PM fatigue specimens fracture mechanisms
A representative fracture surface for PM fatigue specimens is shown in Fig.13a. Long fatigue ridges converge to a point on the specimen surface indicated by yellow arrows. Crack initiation occurred in a corner on the αGB layer at a β grain boundary (see Fig.13b) which is in accordance with the
fractographs registered by Sauer and Lütjering [33] and Foltz et al. [34]. Far from the crack initiation site, intergranular rupture on prior β grains highlighted by a yellow dashed line can be observed.
Figure 13: Fractograph of a typical PM fatigue specimen showing a) the entire fracture surface and
b) the fatigue crack initiation site on a αGB at the grain boundary.
3.7.3 LFW–AW fatigue specimens fracture mechanisms
Two typical fracture surfaces for LFW–AW fatigue specimens are shown in Figs.14a-c. Yellow arrows over fatigue ridges point to the fatigue crack initiation sites (see Figs.14a, 14d and 14e). For the fatigue specimen shown in Fig.14c, it seems that fatigue crack initiation took place in two different locations. The primary fatigue crack initiation site could not be identified. The yellow lines in Figs.14a, 14d and 14e point to bands with brighter colours in which the roughness of the fracture surface is slightly different. It seems that fatigue crack initiated at regions formerly covered by αGB at
βgrain boundaries, for both fatigue specimens. It is worthy of being noticed that, for both specimens, the fatigue ridges exhibit a topology similar to the elongated dimples seen in Fig.10c after monotonic loading. The morphology of the fatigue ridges hints to the “traces of αWGB” colonies growing from
the grain boundary of β grain at the TMAZ. The green arrows in Figs.14a and 14c point to large planar surfaces that are perpendicular to the loading direction. In these observations, features that convey the shape of the fine equiaxed distorted β grains were respectively developed at the WCZ that were also observed in the tensile fractograph of10. Furthermore, the red arrows in Figs.10a and
of Fig.10c and in the tensile, fatigue and fracture toughness fractographs registered by García et al. [23].
These observations suggest that fatigue crack initiated at a former αGB layer at an α depleted
deformed β grains at the TMAZ and propagated through the αWGB colonies into the core of β
Figure 14: Fractographs of a-b) the LFW–AW-1 and c-d-e-f-g) the LFW–AW-2 fatigue specimens.
Fatigue specimens life respectively were 0.48 × 10⁵ and 0.64 × 10⁵ cycles. Fatigue crack initiation
sites at the specimens surface for b) the LFW–AW-1 and d-e) the LFW–AW-2 fatigue specimens. f-g) 3D SEM fractographs of the LFW–AW fatigue specimen of Fig.14c-d-e.
Figure 15: Fractographs of a typical PWHT fatigue specimen showing a) the entire fracture surface
and b) the fatigue crack initiation site at the specimen surface, notice initiation occurs on a αGB at
the grain boundary.
grains. Propagation occurred up to the point when the stress intensity factor was high enough to lead to a ductile fracture partly at the α depleted deformed β grains in the TMAZ and partly at the fine equiaxed distorted β grains of the WCZ. It is commonly accepted that, during the stage I of fatigue crack propagation, more or less three microstructural entities are involved [35, 36, 37]. Crystallographic micro-propagation in air has also been found by Herbig et al. [38]. The particularity of these materials is the significant size of the β grains. Thus, it could be imagined that a stage I fatigue crack propagation occurred over the lines highlighted by yellow arrows in Figs.14b, 14d and
14e.
3.7.4 PWHT fatigue specimens fracture mechanisms
The fracture surface of a typical PWHT fatigue specimen is shown in Fig.15a. The fatigue ridges converge to a point at the specimen surface indicated with a yellow arrow. In the high magnification observation of Fig.15b, the fatigue crack initiation site can be seen. The underlying microstructure at the fatigue crack initiation site may be the αGB layer at a grain boundary (see blue arrow in
Fig.15b). This would be in accordance with the fatigue crack initiation previously registered for other β−metastable alloys [33,34]. Damage feature that have strong similarities with the coarsened αWGB colonies can also be seen (red arrow in Fig.15b).
4
Discussion
Absence of the α phase and weld undermatching strength of LFW joints in the as
high strength. The key microstructural feature to obtain this is the presence of the α precipitation, in particular the transgranular αWI [39]. The LFW–AW and LFW–AW–PC joints studied here
exhibited a depletion of the α phase at the WCZ and TMAZ. These microstructures have shown poor mechanical properties such as lower microhardness [19, 20, 22, 29], lower UTS, early strain localization at the WCZ and TMAZ during monotonic loading (see Fig.5 and [23]), failure at the weak zones during monotonic loading (see Fig.4a, Section and [20, 23, 29]), fatigue crack initiation at the weak zones with reduced fatigue strength (see Sections 3.7.3and [23]), and very poor fracture toughness properties with crack propagating at the weak zones [23]. These findings provide ample evidence that the depletion of the α phase is undesirable. Thus, the similar Ti17 LFW joint is not well suited for high strength applications. Some designers may still advocate the use of LFW for similar Ti17 joints by applying some over-dimensioning. However, this is particularly arguable, since one of the most interesting advantages of LFW is the weight optimization.
PWHT Homogenization The PWHT recrystallized the WCZ and TMAZ microstructures into
similar but smaller PM grains and favoured the precipitation of the α phase. The cross-weld micro-hardness profiles became constant and were enhanced up to 97 % with respect to the PM [22]. Unlike the LFW–AW and LFW–AW–PC tensile specimens, the PWHT tensile specimens never failed at the former WCZ or weak zones (see Section 3.3). Slight differences were observed in terms of me-chanical properties and were attributed to a coarsening of the α phases during PWHT. Despite this, compared to the PM tensile specimens, the PWHT tensile specimens exhibited a slightly lower UTS, slightly higher ductility, very similar fatigue strength, and a similar slope on the S–N curve. By the application of the PWHT, not only were the mechanical properties comparable to the PM (see Sections3.2 and 3.7) but also, they were much better than those of joints in the as welded state.
Improvement of the heat treatment As a general rule, the application of thermal treatments
is advisable after machining workpieces made of β−metastable titanium alloys. In the particular case of similar Ti17 LFW joints, it is highly recommended since the depletion of the α phase is a considerable threat. The mechanical properties of the LFW–PWHT joint studied here were clearly superior to those of the as welded LFW joint, yet, slightly lower than the PM. Thus, this thermal treatment could be further improved.
A brief qualitative analysis on the effect of the PWHT on the PM has been performed judging that the PWHT PM microstructure was similar to the as received PM microstructure [22]. As it can be seen on the EBSD map of Fig.5, the indexation of the β phase is less successful than the others (see Figs.5 and 5). It could be argued that the surface preparation for this specimen was not
adequate. Nevertheless, it should be noticed that the indexation seems to have been successful to a large extent and that it has allowed the β grains and the former WCZ to be identified. Contrarily, indexation seems to have been unsuccessful particularly where both the αGB and the αWGB colonies
are located, namely the grain boundaries. This is extensively explained in Section3.1.
The heat treatments applied to the PM and the as welded LFW joint differ in one key aspect: The cooling rate after solution treating (see Sections2.1and2.3). The PM was water quenched after solution treating whilst for the LFW–PWHT joint, temperature was gradually decreased from the solution treating to the ageing temperature in a total time of 2 h. The cooling rate applied to the PM was much higher than the one imposed to the LFW–PWHT joint. Lütjering [40] have shown that the αGB and the αWGB colonies are developed during cooling after solution treating and that
the thickness of the α precipitates increases with decreasing cooling rates. Two conclusions can be drawn from this. First, this reinforces the supposed coarsening of the αGB and αWGB colonies of the
LFW–PWHT joint explained in Section3.1 and could also explain the microhardness reduction, the poorer β EBSD indexation, the intergranular rupture during monotonic loading, and the lower UTS that the LFW–PWHT joint showed with respect to the PM. Second, even though the mechanical properties of the LFW–PWHT joint were better that those of the AW joints, the PWHT could still be optimized by increasing the cooling rate after solution treating, namely by air or water quenching. This is specially advised for workpieces having a thickness greater than 20 mm.
Despite the large improvement of the mechanical properties with respect to the LFW–AW joint exhibited by the LFW–PWHT joint, this heat treatment seems too intense for its industrial application. First, given that the main application of the LFW is the manufacturing of “Blisks” [18,
41], it should be considered that the application of such heat treatment seems infeasible considering the size of the workpieces to be treated. Second, the application of this PWHT seems unwise since it could affect the texture intentionally developed in the core of the Blisks during their manufacture. Finally, the object of applying a heat treatment is to enhance the precipitation of the α phase and to release residual stresses. Henceforth, a single annealing heat treatment seems sufficient.
Contribution of residual stress to fatigue crack initiation There is some agreement in
litera-ture concerning the presence of tensile residual stresses parallel to the P axis at the TMAZ of titanium alloys LFW joints [42,43,44]. The authors of the present work have previously documented an early plastic activity in the vicinity of the WCZ exhibiting overmatching strength of a similar Ti6242 LFW joints that led to fatigue crack initiation during cyclic loading [31]. Based on the results documented by Frankel et al. [42], this early localization was attributed to residual stresses parallel to the loading direction. The presence of residual stresses and their relief by PWHT has been previously evidenced
through displacement profiles obtained by SDIC of cross-weld samples after EDM machining [42]. In a similar manner, [44] measured the residual stresses of a dissimilar Ti17(β)-Ti17(α + β) LFW joint by the contour method. They claimed that X-ray diffraction exhibits a low spatial resolution for LFW joints but nevertheless, it served well for comparison and validation of the contour method measurements. It should be pointed out that, for the FEA computation of the welded structure residual stresses, the Young's modulus of the PM was used for the entire cross-welded structure [44]. This is particularly arguable since, compared to the PM, the WCZ exhibits a significant lower Young's modulus and this may therefore have led to an overestimation of the residual stresses. Thus, despite being relatively low, residual stresses surely contributed to the fatigue crack initiation at the TMAZ but unhappily they can not be captured by the normalized strain rate spatio-temporal graph as performed in [31], since the early localizations observed at the WCZ and TMAZ (see Fig.6) are also a consequence of their less resistant β microstructure. The PWHT also permits to relieve the residual stresses.
Self-cleaning and brass contamination In previous work, the authors have studied the strength
and fatigue strength of a similar Ti6242 LFW joint. Despite the overmatching strength, a dendritic defect related to prior to welding brass contamination was at the origin of a shortened fatigue life for a fatigue specimen and implied a strong fatigue life scatter [31]. In the investigation reported in the present paper, three joints were prepared so as to study the consequences of prior to welding brass contamination. Two of them were welded in the EDM as machined state (joints LFW–AW and PWHT) and one was ground prior to welding (LFW–AW–PC). During monotonic loading, failure was attributed to pile up of dislocations at the TMAZ-WCZ boundary and localization at the TMAZ. During cyclic loading, fatigue crack initiation occurred at the TMAZ, at the coarsened ex αGB layers
at the grain boundary. For both monotonic and cyclic loading, the Ti17 TMAZ were the weak zones of the welded structure. No consequences of the potential brass contaminants at the weld interface were observed. The chosen welding parameters may have been suitable to properly self-clean the weld interface. Nevertheless, it could be stated that as Ti17 and Ti6242 have different microstructures and physical properties, the interaction between the PM and the brass contaminants on the weld interface during welding may differ. Furthermore, the LFW–PWHT joint was welded in the EDM as machined state and, even after PWHT, the probable brass contaminants at the weld interface may have been a threat and yet, it was found not to be the case.
5
Conclusions
In this investigation, the mechanical properties in terms of tensile and fatigue behaviour of as welded and post weld heat treated similar Ti17 LFW joints were studied and compared to the Ti17 parent material. Special interest was drawn to the relationship between the macroscopic properties and the underlying microstructure. In addition, two welds were performed so as to study the effect of prior to weld contamination on the mechanical properties of as welded similar Ti17 LFW joints. The foremost conclusions with regards to the present findings are:
• The PM contained 600 µm diameter β grains and α precipitates. In terms of monotonic loading, it exhibited a UTS of 1066 MPa. Ductile inter and transgranular rupture at the αWGBand along
slip planes of the β grains were observed. The strain to failure was of about 0.074 compromised with a significant scatter. The macroscopic strain maps obtained by SDIC highlighted an early localization over a few grains of the coarse microstructure identified by SDIC. For the fatigue life of 105 cycles, the fatigue strength was of 720 MPa exhibiting a fatigue crack initiation on
the specimen surface.
• The as welded LFW–AW and LFW–AW–PC similar Ti17 joints, containing α depleted β grains at the TMAZ and 10 µm distorted β grains at the WCZ, showed undermatching strength. The UTS was 1044 MPa and the macroscopic engineering strain at fracture measured over a 25 mm basis was reduced to 0.04 and showed considerable scatter. The strain field was heterogeneous and localized at the TMAZ and the WCZ. Normalized strain rate fields showed an early strain activity at the WCZ that later shifted to the TMAZ where failure took place. Local strain to fracture measured by SDIC was also lower than for the PM. Cracking probably initiated at the TMAZ-WCZ frontier. Colonies of elongated dimples were observed at the grain boundary of the α depleted β grains of the TMAZ. For the fatigue life of 105 cycles, the fatigue strength
was of 450 MPa with a fatigue crack initiation probably located at the former αGB + αWGB
precipitates in the β grains of the TMAZ on the specimen surface.
• The LFW–PWHT joint recovered a microstructure close to that of the PM and failed far from the former WCZ during monotonic loading. It showed a UTS of 1030 MPa which was attributed to slightly coarser αGBand αWGBcolonies with respect to the PM. The ductility was
even increased compared to PM and also showed significant scatter in macroscopic engineering strain. As for PM, the strain showed early heterogeneity and the increased macroscopic strain to fracture was attributed to an increase in local strain to fracture as measured by SDIC. In terms of cyclic loading, an excellent fatigue strength of 720 MPa for the fatigue life of 105 cycles
was found. Compared to the PM, the slope of the SN was slightly lower which was attributed to the slight difference in the microstructure. Fatigue crack initiated far from the former WCZ. Fatigue crack initiation is likely to have occurred at the αGB phases of the β grain boundary.
In summary, the proposed heat treatment was successful since the mechanical properties of the heat treated LFW joint were almost identical to those of the PM.
Acknowledgments
The authors wish to thank UTC, CEMEF, Mines-ParisTech and Airbus Central R&T for the valu-able discussions. ACB is thanked for providing the welds for this study. Vladimir Esin at Centre des Matériaux is kindly thanked for his advice concerning sample preparation for EBSD mapping. Anne-Françoise Gourgues-Lorenzon and Henry Proudhon at Centre des Matériaux are kindly thanked for the discussions about rupture mechanisms and EBSD analysis. Yvon Millet at Timet is acknowl-edged for the discussions concerning the improvement of the applied heat treatment. The authors acknowledge the financial support from the French National Research Agency (ANR) and FRAE through OPTIMUM ANR-14-CE27-0017 project.
References
[1] R.R. Boyer. An overview on the use of titanium in the aerospace industry. Materials Sci-ence and Engineering:A, 213(1):103 – 114, 1996. ISSN 0921-5093. doi: https://doi.org/10. 1016/0921-5093(96)10233-1. URL http://www.sciencedirect.com/science/article/pii/
0921509396102331. International Symposium on Metallurgy and Technology of Titanium
Al-loys.
[2] H.J. Rack and J.I. Qazi. Titanium alloys for biomedical applications. Materials Science and Engineering: C, 26(8):1269 – 1277, 2006. ISSN 0928-4931. doi: https://doi.org/ 10.1016/j.msec.2005.08.032. URL http://www.sciencedirect.com/science/article/pii/
S0928493105002237. Proceedings of the First TMS Symposium on Biological Materials
Sci-ence.
[3] Marc Long and H.J Rack. Titanium alloys in total joint replacementa materials science per-spective. Biomaterials, 19(18):1621 – 1639, 1998. ISSN 0142-9612. doi: https://doi.org/10. 1016/S0142-9612(97)00146-4. URL http://www.sciencedirect.com/science/article/pii/