HAL Id: inserm-02147304
https://www.hal.inserm.fr/inserm-02147304
Submitted on 4 Jun 2019
HAL is a multi-disciplinary open access
archive for the deposit and dissemination of
sci-entific research documents, whether they are
pub-lished or not. The documents may come from
teaching and research institutions in France or
abroad, or from public or private research centers.
L’archive ouverte pluridisciplinaire HAL, est
destinée au dépôt et à la diffusion de documents
scientifiques de niveau recherche, publiés ou non,
émanant des établissements d’enseignement et de
recherche français ou étrangers, des laboratoires
publics ou privés.
Oligodendrocyte Glycoprotein B Lymphocytes in
Patients with Relapsing-Remitting Multiple Sclerosis
Annie Ngono, Maud Lepetit, Markus Reindl, Alexandra Garcia, Flora Guillot,
Athénaïs Genty, Mélanie Chesneau, Marion Salou, Laure Michel, Fabienne
Lefrère, et al.
To cite this version:
Annie Ngono, Maud Lepetit, Markus Reindl, Alexandra Garcia, Flora Guillot, et al.. Decreased
Frequency of Circulating Myelin Oligodendrocyte Glycoprotein B Lymphocytes in Patients with
Relapsing-Remitting Multiple Sclerosis. Journal of Immunology Research, Hindawi Publishing
Cor-poration, 2015, 2015, pp.1-12. �10.1155/2015/673503�. �inserm-02147304�
Research Article
Decreased Frequency of Circulating Myelin
Oligodendrocyte Glycoprotein B Lymphocytes in Patients with
Relapsing-Remitting Multiple Sclerosis
Annie Elong Ngono,
1,2Maud Lepetit,
1,3Markus Reindl,
4Alexandra Garcia,
1Flora Guillot,
1,2Athéna
\s Genty,
1Mélanie Chesneau,
1,2Marion Salou,
1,2Laure Michel,
1,3Fabienne Lefrere,
5Kathrin Schanda,
4Berthe-Marie Imbert-Marcille,
2Nicolas Degauque,
1,2Arnaud Nicot,
1,2Sophie Brouard,
1,2David-Axel Laplaud,
1,2,3and Jean-Paul Soulillou
1,21INSERM, UMR1064, 44093 Nantes, France
2Facult´e de M´edecine, Universit´e de Nantes, 44035 Nantes, France 3Service de Neurologie, CHU de Nantes, 44093 Nantes, France
4Clinical Department of Neurology, Innsbruck Medical University, 6020 Innsbruck, Austria 5INSERM, CIC 004, 44093 Nantes, France
Correspondence should be addressed to Jean-Paul Soulillou; jean-paul.soulillou@univ-nantes.fr Received 7 August 2014; Revised 26 October 2014; Accepted 14 November 2014
Academic Editor: Jianying Zhang
Copyright © 2015 Annie Elong Ngono et al. This is an open access article distributed under the Creative Commons Attribution License, which permits unrestricted use, distribution, and reproduction in any medium, provided the original work is properly cited.
Although there is no evidence for a role of anti-MOG antibodies in adult MS, no information on B lymphocytes with MOG-committed BCR is available. We report here on the frequency of anti-MOG B cells forming rosettes with polystyrene beads (BBR) covalently bound to the extracellular domain of rhMOG in 38 relapsing-remitting patients (RRMS) and 50 healthy individuals (HI). We show a substantial proportion of circulating anti-MOG-BBR in both RRMS and HI. Strikingly, MOG-specific B cells frequencies were lower in MS than in HI. Anti-MOG antibodies measured by a cell-based assay were not different between MS patients and controls, suggesting a specific alteration of anti-MOG B cells in MS. Although anti-MOG-BBR were higher in CNS fluid than in blood, no difference was observed between MS and controls. Lower frequency of MOG-BBR in MS was not explained by an increased apoptosis, but a trend for lower proliferative capacity was noted. Despite an efficient B cell transmigration across brain derived endothelial cells, total and anti-MOG B cells transmigration was similar between MS and HI. The striking alteration in MOG-specific B cells, independent of anti-MOG antibody titers, challenges our view on the role of MOG-specific B cells in MS.
1. Introduction
Multiple sclerosis is a chronic inflammatory disease charac-terized by leukocyte infiltration and white matter demyelina-tion [1]. Among lymphocytes, T cells are prevalent in inflam-matory lesions [2] and anti-myelin T cell frequency was found increased in MS patient blood [3]. Myelin antigen-specific T lymphocytes have attracted a great deal of attention due to their potential for induction by adoptive transfer experimen-tal allergic encephalomyelitis (EAE), an animal model of the immune component of the disease [4–6]. However, myelin reactive T cells are also found in healthy individuals (HI) [3,
7]. Antibodies against myelin derived possible autoantigens, and particularly anti-MOG, have been widely studied with no clear evidence of linkage with the disease prevalence or severity in adult MS disease [8]. However, several recent studies indicated that antibodies to MOG are present in a subset of predominantly pediatric inflammatory demyelinat-ing diseases different from MS such as ADEM or AQP4-IgG seronegative NMO (see [9] for review). A possible role of B cells in MS has been more recently highlighted through the beneficial clinical effect of anti-CD20 monoclonal antibodies which, before modifying antibodies titers, deplete B cells [10] and modify B cell functions [11]. Indeed, B cells present
Volume 2015, Article ID 673503, 12 pages http://dx.doi.org/10.1155/2015/673503
Table 1: Summary of patients and sample characteristics. 𝑛 Age % females % relapses EDSS RR MS 38 36.74± 9.8 71% 24% 1.75± 0.33 SP MS 8 53.25± 7.86 75% — — HI 50 38.18± 11.48 62% — — CIS 9 36.44± 14.82 67% — — Controls 8 40.13± 21.70 50% — —
38 patients with relapsing-remitting form, 50 healthy individuals, and eight patients with secondary progressive form were included in this study. Forintrathecal analysis, nine patients with clinically isolated syndrome and eight controls were included. Among the eight controls without neurolog-ical disease, there was four hydrocephalus, one anti-N-methyl-D-aspartate (NMDA) receptors’ encephalitis, one leukopathy, one tetrapyramidal syn-drome, and one idiopathic high pressure hydrocephalus.
several functions thought to play a role in MS autoimmune processes [8]. Harp et al. have shown that, in MS, B cells com-mitted to myelin proteins are efficient as antigen presenting cells [12]. B cells can also exhibit a regulatory function in auto-immune diseases [13,14] or in a transplantation setting [15,
16]. Yet, an alteration of this function in MS [17] remains controversial [18]. B cell tolerance to autologous determinants depends on a first checkpoint which occurs in bone marrow [19]. Autoreactive B cells are nevertheless released in the periphery [20] where a T cell dependant second checkpoint operates. However, a substantial proportion of circulating B cells still remains poly- or cross-reactive despite these processes.
In this paper, using a novel approach [21] to detect MOG committed B cells in comparison with circulating anti-MOG antibodies, we show that (i) as for anti-MOG T cells [7,22] normal individuals present a substantial high level of circu-lating anti-MOG B cells and (ii) although there were no differ-ences in circulating anti-MOG antibodies, MS patients have a significantly lower circulating anti-MOG B cell frequency than healthy individuals.
2. Materials and Methods
2.1. Patients and Healthy Controls. Patients included in this
study were diagnosed with MS using revised Mac Donald criteria [23]. 38 Relapsing-Remitting patients (RRMS), listed inTable 1, were recruited. RRMS group was composed of 27 females and 11 males ranging from 23 to 60 years old (mean age: 36.74). All patients were scored on the Kurtzke Expanded Disability Status Scale (EDSS) and were without immunomo-dulatory treatment for at least three months and immuno-suppressive treatment for at least six months before testing. Another group of eight patients with secondary progressive MS, from 40 to 64 years old (mean age: 53.25) was also included with 6 females and 2 males. 50 healthy individuals (HI) participated in the study, 31 females and 19 males ranging from 22 to 61 years old (mean age: 38.24).
Nine patients with clinically isolated syndrome (CIS) and eight with other noninflammatory or inflammatory neurological disease (OND or OIND) were also enrolled in the intrathecal study. There were six females and three males ranging from 20 to 61 years old in the CIS group (mean age:
36.44). The control group (Table 1) was composed of four females and four males ranging from 15 to 77 years old (mean age: 40.13). Our study complies with the Nantes University Hospital Ethical Committee guidelines and all participants signed an informed consent for the study.
2.2. Obtention of Protein-Coupled Beads. Extracellular domain
of recombinant human MOG1-125(rMOG) (Eurogentec, France)
expressed in E. coli, human albumin (LFB, France), and non-toxic tetanus toxin C-fragment (Sigma, France) proteins were coupled to fluorescent Bio-Plex COOH beads (Bio-Rad, France) as described [21]. The carboxyl groups of fluorescent COOH beads were activated by EDC (1-ethyl-3-[3-dimethyl-aminopropyl]carbodiimide hydrochloride) (Fisher Scien-tific, France) and S-NHS (sulfo-N-hydroxysulfosuccinimide) (Fisher Scientific); then the Bio-Plex amine coupling kit (Bio-Rad) was used to couple proteins to the activated COOH beads. The coupling reaction was systematically checked through flow cytometry using the appropriate antibodies. For MOG, we checked that the anti-MOG 8.18C5 mouse antibody, shown to react with the folded MOG pattern [24], effectively recognizes the MOG1-125covalently coated beads.
In addition, we checked that these MOG1-125coated beads are
also recognized by B cells from transgenic 8.18C5 antibody mice [21].
2.3. Frequencies and Phenotype of Blood MOG-Specific B Cells.
Plasmas were collected from blood samples and mononuclear cells were isolated by Ficoll-Hypaque density gradient cen-trifugation (PAA, France) and frozen in serum-DMSO 10%. Purified B cells were obtained by negative magnetic selection (Miltenyi, France) from cryopreserved PBMC. Briefly, 3× 10⁵ B cells were stained with CD19-PE (Clone HIB19) (BD, France), CD27-QDot 605 (CLB-27/1) (Invitrogen, France), IgD-FITC (IA6-2) (BD), CD5-FITC (53-7.3) (BD), CD38-PECy5 (Clone LS198-4-3) (Beckman Coulter, France), CD40 (5C3) (BD), KI-67-FITC (B56) and IgG1,Q isotype control (BD) at 4∘C for 30 minutes. The cells were then washed twice with PBS/2%FCS/2 mM EDTA buffer and incubated with protein-coated beads for 1 hour at 4∘C and DAPI was added before FACS assay to select only the live cells. Specificity was tested through competitive incubation of the B cells with soluble MOG or albumin for 30 minutes prior to the addition of MOG-coated beads. The B cells were also prein-cubated with anti-IgG+IgA+IgM polyclonal Fab’2 fragments. Polyreactivity was also tested by the same approach. Briefly, soluble dsDNA (Sigma, France), LPS (Sigma), and insulin (Sigma) were added during 30 minutes on B cells prior to the incubation with MOG-coated beads. The frequency of antigen-specific B cells was evaluated on 3⋅ 104live CD19+ cells recorded for each sample through flow cytometry, using a LSR II (BD). All analyses were performed with FlowJo software, version 7.6.12 [21].
The absolute B-lymphocyte count was determined by combining a precise volume of blood with appropriate anti-bodies (CD45-V500—Clone HI30—and CD19-PE) in Tru-Count tubes (BD) for 15 minutes at room temperature. Then, the red blood cells were lysed with FACS lysing solution (BD). The TruCount tubes were analyzed through flow cytometry and the quantity of B cells/𝜇L of blood was obtained.
2.4. Apoptosis Assay. An annexin V-FITC apoptosis
detec-tion kit (BD) was used to evaluate the apoptosis in the BBR fraction. Briefly, 3 ⋅ 105 purified B cells were stained with CD19-PE and incubated with protein-coupled beads for 1 hour. Annexin V-FITC was added and incubated with the cells for 15 minutes at room temperature (RT). Then, binding buffer and DAPI were added before analyzing by flow cytometry. Live B cells (annexin V−DAPI−), early apoptotic B cells (annexin V+DAPI−), and late apoptotic B cells (annexin V+DAPI+) were selected.
2.5. Quantification of Intrathecal MOG-Specific B Cells. After
lumbar puncture, 10 mL of CSF was immediately added to a RPMI supplemented medium. The CSF samples were centrifuged at 1500 rpm for 7 minutes to collect the cells and supernatants were collected. Cell pellets were resuspended in PBS/2%FCS/2 mM EDTA buffer and stained with CD19-PE antibody for 30 minutes at 4∘C. The CSF cells were then washed and incubated with either albumin or MOG-coupled beads as indicated above.
Out of 29 CSF samples obtained during the study period, only 17 CSF (58%) patients contained more than 50 live CD-19 reactive B cells per sample, the minimal amount considered required for data interpretation. The total cell numbers for these CSF ranged from 50 to 2710 live B cells. Blood samples were obtained from each CIS and control patient, for comparison (9 from CIS and 8 from non-MS).
2.6. B Cell Transmigration Assay through Endothelial Cell Line.
The human blood-brain-barrier (BBB) endothelial cell line HCMEC/D3 is an immortalized endothelial cell line derived from a primary cell culture coexpressing hTERT and the SV40 large T antigen via a lentiviral vector system [25]. Transmigration assays were performed using the Transwell system (8.0𝜇m pore filters; BD Falcon, France) as previously described [26]. Cell concentration was tested and concentra-tions which allowed more than 5% human albumin diffusion in the lower chamber after 6 hours were discarded. Two days before the migration assay, 1 × 10⁶ HCMEC/D3 cells were cultured on the apical side of the filter insert. All cells were grown in endothelial basal medium-2 (EBM-2, Lonza) supplemented with human serum (PAA). 5× 10⁵B cells were added on top of the BBB layer. After 18 h at 37∘C with 5% CO2, the contents of the bottom chamber were collected with EDTA to detach any adherent cell, and B cells were counted. The transmigrated cells were washed, stained with CD19-PE, and incubated with albumin or MOG coupled beads as indicated previously.
2.7. Assessment of Anti-MOG and EBNA1 Reactive Circulating Antibodies. Anti-MOG antibodies were assessed with an
immunofluorescent cell-based assay (CBA) as described in detail elsewhere [27]. Briefly, all plasma and CSF samples were tested for reactivity against the human MOG expressed in HEK293 cells using an immunofluorescence live cell assay. The plasma samples were tested at a 1/20 dilution and CSF samples were undiluted. Titers were considered positive above a cut-off of 1 : 160 [27]; correlations were also performed using direct OD values.
The detection of anti-EBNA1 IgG in plasma samples was performed routinely using the DiaSorin kit (Liaison EBNA1 IgG) on an automat (Liaison XL).
2.8. Statistical Analysis. All data are expressed as mean ±
SEM. Mann-Whitney tests were used to compare pairs of different groups and Wilcoxon test to compare two variables in the same group.𝑡-test was used to compare pairs of groups with more than 30 individuals. One way ANOVA or Kruskall Wallis tests were used to compare more than 2 groups. All statistical analyses were performed with GraphPad Prism 5. Results were considered significant when𝑃 < 0.05.
3. Results
3.1. Validation of the Method and Reactivity of the 8.18C5 Antibody. Mouse monoclonal antibody 8.18C5 recognizes
conformational MOG1-125(Ig-like domain) but not the linear
MOG epitopes in mice [24]. 8.18C5 antibody was used to both check the efficiency of the MOG coupling to the beads and the covalently bound MOG reactivity to the antibody. The reactivity of the MOG coated beads with the 8.18C5 antibody was potent (91%) as shown in Supplementary Figure 1a available online at http://dx.doi.org/10.1155/2015/673503. The MOG covalently coated beads were also recognized by the transgenic IgH-MOG B cells (corresponding to the 8.18C5 heavy chain) [28]. Spleen B cells of these mice exhibited 59% of MOG-BBR, with a drop of 90% when the B cells were preincubated with soluble rMOG but not with albumin (Supplementary Figure 1b).
3.2. Quantification of MOG-Specific B Cell Frequencies in MS Patients. MOG is a myelin antigen only expressed in the
CNS, which induces EAE, and is suspected to play a role in MS [29]. In this study, MOG-coated polystyrene beads were used to identify in vitro CD19+ cells able to make rosettes with the MOG coated beads (referred to as BBR for bead/B
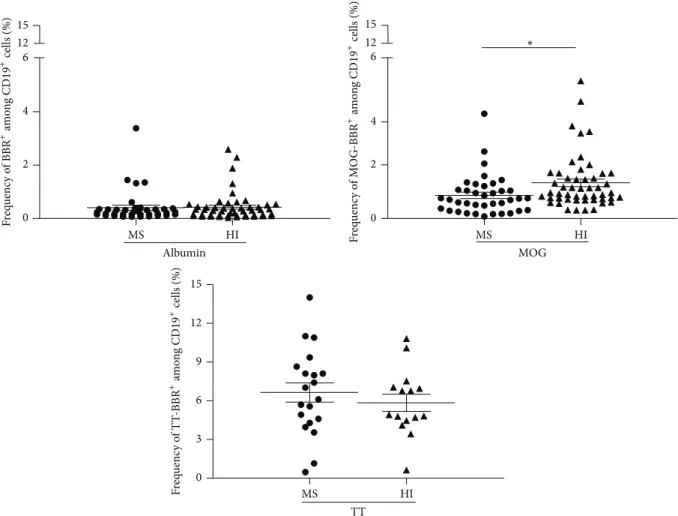
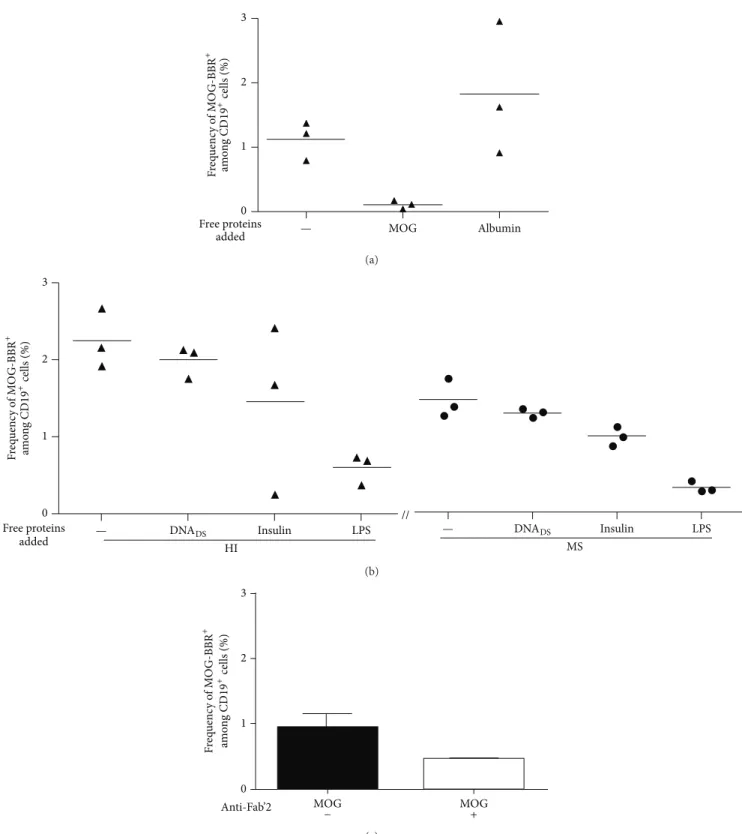
cell rosettes) as described elsewhere [21]. Several negative controls were used: uncoated beads, albumin coated beads, or T cells instead of B cells. Tetanus toxin (TT) coated beads were used as the positive controls [30]. Using this approach, we observed substantially high frequencies of circulating B cells rosetting with rMOG coated beads in both cohorts (MS patients and HI) (Figure 1). However, unexpectedly, the frequency of anti-MOG B cells was statistically lower in RRMS (𝑛 = 38) than in the cohort of 50 healthy individuals (HI) tested in parallel (0.86± 0.12 and 1.33 ± 0.14%, resp., 𝑃 = 0.0188,Figure 1). In contrast, the frequency of B cells which recognized albumin coated beads was not statistically different in MS (0.40 ± 0.09%) and HI (0.42 ± 0.07%) (Figure 1). RRMS patients and HI show a similar and high frequency of B cells recognizing TT coated beads, 6.64± 0.74 and 5.84± 0.66%, 𝑃 = 0.37 (Figure 1). The specificity and the polyreactivity of the MOG-coated beads were assessed by addition of 20𝜇g of soluble rMOG, albumin, dsDNA, LPS, and insulin. The addition of soluble rMOG resulted in a dose dependent inhibition of MOG-specific B cell frequency (from 1.12± 0.17 to 0.11 ± 0.03) whereas soluble albumin did not provide competition (Figure 2(a)). Soluble LPS dropped by
MS HI 0 2 4 6 12 15 Albumin MS HI 0 2 4 6 12 15 MOG ∗ MS HI 0 3 6 9 12 15 TT F req uenc y o f BBR + am o n g CD 19 + cells (%) F req uenc y o f M O G-BBR +am o n g CD 19 +cells (%) F req uenc y o f T T -BBR +am o n g CD 19 +cells (%)
Figure 1: Quantification of MOG-specific B cell frequencies in MS patients and HI. Purified B cells, stained with CD19 antibody, were incubated with human albumin, rMOG, or tetanus toxin (TT) coated beads. After exclusion of dead cells (DAPI+), the frequency of B cells which recognized albumin or rMOG was obtained in MS patients (𝑛 = 38) and HI (𝑛 = 50)∗𝑃 = 0.0188, unpaired 𝑡-test. The frequency of B
cells bound to TT coated beads was also assessed in MS patients (𝑛 = 20) and in HI (𝑛 = 15) (ns, 𝑃 > 0.05, Mann-Whitney test).
73% the recognition of MOG-specific B cells (from 2.24± 0.22 to 0.59± 0.11). However, dsDNA (from 2.24 ± 0.22 to 1.99± 0.12) and insulin (from 2.24 ± 0.22 to 1.45 ± 0.63) have a smaller competing effect on the MOG-specific B cell fre-quency (Figure 2(b)). Polyreactivity of MOG-specific B cell in MS patients and HI was similar. MOG-specific frequencies after dsDNA and insulin incubation were, respectively, 1.30± 0.03 (11% of inhibition) and 0.99± 0.07 (32%) in MS group (Figure 2(b)).
The Fab’2 fragment anti-human Ig (A, G, and M isotypes) was also able to decrease the MOG-specific B cell frequency (nearly 50%) (Figure 2(c)), further suggesting that the inter-action of the tested B cells with MOG-coated beads involved the surface membrane BCR.
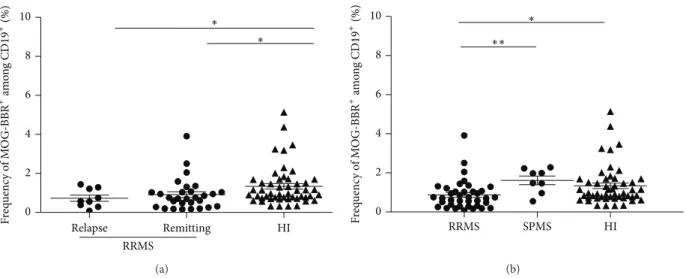
The frequency of MOG-BBR cells in MS was then classified according to the state of the disease and to the clinical form. No significant difference between the frequency of MOG-BBR of patients in relapse (𝑛 = 9, 0.72 ± 0.15%) and in clinical remission (𝑛 = 29, 0.92 ± 0.16%) was observed (Figure 3). Both groups had a lower frequency of MOG-BBR compared to HI (𝑃 = 0.01 and 𝑃 = 0.02, resp.). In the same condition to detect MOG-specific B cells, a small group
(𝑛 = 8) of patients with a secondary progressive form of MS (SPMS) showed a similar MOG-BBR frequency to the HI (1.61± 0.21 and 1.33 ± 0.14%, resp., ns). The difference between the values of MOG-BBR for the SPMS and RRMS groups was statistically significant (𝑃 = 0.005).
3.3. Phenotype of MOG-BBR Cells
3.3.1. Na¨ıve, Memory Phenotype and Activation State. CD27
is a marker of human memory B cells [31]. The absolute value of B cells was assessed in RRMS patients and HI and no significant difference was observed (data not shown). More-over, we find the same proportion of memory B cells in both groups (Supplementary Figure 2a). Assessment of frequency of memory (CD27+) and na¨ıve (CD27−) B cells recognizing MOG-coated beads indicates 32.6 ± 3.16% CD27+ MOG-BBR and 64.86± 2.88% of CD27−MOG-BBR in MS patients versus 37.31± 3.84% of CD27+MOG-BBR and 59.77± 4.02% of CD27−MOG-BBR in HI (Supplementary Figure 2b). The frequency of switched and unswitched memory MOG-BBR, as approached by CD27+IgD− and CD27+IgD+distribution, did not differ between MS and HI (Supplementary Figure 2c).
MOG Albumin 0 1 2 3 Free proteins added F req uenc y o f M O G-BBR + am o n g CD 19 + cells (%) — (a) // F req uenc y o f M O G-BBR + am o n g CD 19 +cells (%) 3 2 1 0 Free proteins
added — DNADS Insulin LPS
— DNADS Insulin LPS HI MS (b) MOG MOG + 0 1 2 3 Anti-Fab’2 − F req uenc y o f M O G-BBR + am o n g CD 19 +cells (%) (c)
Figure 2: Reactivity of MOG-specific B cells. B cells were preincubated with 20𝜇g of soluble MOG, albumin, dsDNA, insulin, or LPS before the addition of MOG-coated beads (𝑛 = 3). (a) The frequency of MOG-BBR drops with the soluble MOG preincubation but not with albumin preincubation. (b) The recognition of MOG-coated beads decreased after the addition of soluble LPS (% of inhibition: 73%), dsDNA (11%), and insulin (35%). Competitive assay was tested in MS (𝑛 = 3); the percentage of inhibition after soluble antigen addition was the same proportion as HI: LPS (78%), dsDNA (11%), and insulin (32%). (c) B cells were preincubated with Fab’2 anti-human IgG+IgA+IgM. The frequency of B cells recognizing MOG-coated beads was assessed on 3 HI. Fab’2 antibody modified the frequency of MOG-specific B cells (ns,𝑃 > 0.05, Wilcoxon test).
Relapse Remitting HI 0 2 4 6 8 10 RRMS ∗ ∗ F req uenc y o f M O G-BBR +am o n g CD 19 +(%) (a) RRMS SPMS HI 0 2 4 6 8 10 ∗ ∗∗ F req uenc y o f M O G-BBR +am o n g CD 19 +(%) (b)
Figure 3: Quantification of MOG-specific B cell frequencies in MS patients according to disease activity and MS forms. (a) RR patients were classified according to disease state, for example, relapse or remission. We analysed the difference in MOG-BBR frequencies for patients in relapse (𝑛 = 9) and patients in clinical remission (𝑛 = 29) versus HI (𝑛 = 50) (1𝑃 < 0.05), Kruskal-Wallis test. No difference between patients in relapse and patients with clinical remission was observed (ns,𝑃 > 0.05). (b) Eight patients with secondary progressive (SP) forms were included and compared to RR patients and HI. There was a statistically significant difference between SPMS patients and RR MS patients (𝑃 < 0.05) but not between SPMS patients and HI (𝑃 > 0.05), Kruskal-Wallis test.
Na¨ıve MOG-BBR were more frequent than the memory phenotype in both groups (𝑃 = 0.01). In this compartment, activated na¨ıve B cells (CD27−CD38+) were more represented than mature na¨ıve B cells (CD27−CD38−) in MOG-BBR subsets (Supplementary Figure 2d).
The B cells were also stained for CD40 activation marker, a candidate for contributing to autoimmune processes in which B cell activation may play a role [32]. We assessed the CD40 MFI of MOG-specific B cells in MS and HI. No signifi-cant difference was observed between RRMS (𝑛 = 12) and HI (𝑛 = 11) in the MOG-BBR subset (Supplementary Figure 2e).
3.3.2. Proliferation State. Ki-67, expressed during all active
phases of the cell cycle [33], was used to assess the prolifera-tive status of MOG-specific B cells in RRMS patients and HI. Although the detection of KI-67 was difficult in unstimulated B cells, a trend (𝑃 = 0.06) was found for the two cohorts: 1.44± 0.37% MOG-BBR positive for KI-67 in MS patients (𝑛 = 16) and 3.49 ± 0.86% in HI (𝑛 = 17) (Figure 4). MOG-specific B cells were stained more strongly by KI-67 than B cells in MS and HI (𝑃 < 0.05, data not shown).
3.4. Apoptosis of Anti-MOG-BBR Cells. Among several
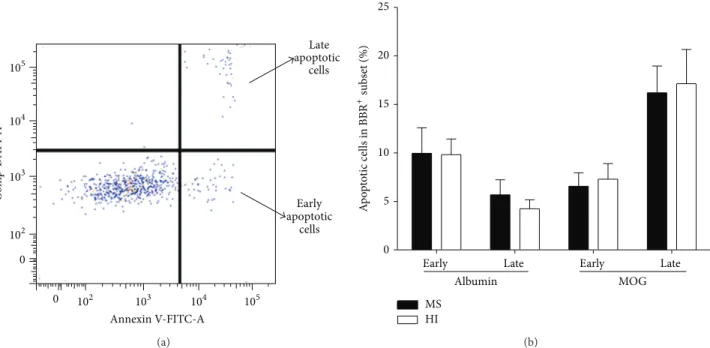
pos-sible explanations for the decreased frequency of MOG-BBR in MS patients compared to HI, apoptosis was considered. A combination of annexin V (recognizing phosphatidylserine (PS) on the cell surface) and DAPI was used to detect early (annexin V+, DAPI−) and late (annexin V+, DAPI+) apoptotic cells (Figure 5(a)). Ten patients with RR-MS and 10 HI were tested. Early and late apoptosis markers of MOG-BBR showed no difference in MS and HI (for early apoptosis: 6.56± 1.38 and 7.29 ± 1.61%, 𝑃 = 0.88; for late apoptosis: 16.20± 2.75 and 17.14 ± 3.53%, resp.,Figure 5(b)).
MS HI 0 3 6 9 12 F req uenc y o f KI 67 +in M O G-BBR +(%)
Figure 4: KI-67 expression in MOG-specific B cells: KI-67 marker was used to determine the proliferating states of MOG-BBR. The frequency of MOG-BBR positive for KI67 in MS (𝑛 = 16) was not different to HI (𝑛 = 17), (ns, 𝑃 = 0.06) Mann-Whitney test.
3.5. Intrathecal MOG-Specific B Cells. Although cell numbers
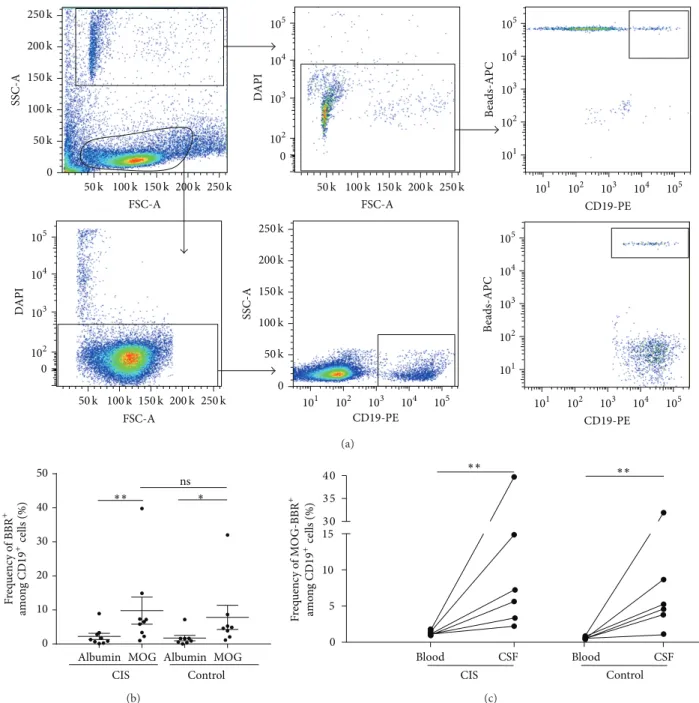
in CSF samples reduced intrathecal study, we then checked if MOG-specific B cells accumulated in the spinal fluid of 8 patients with a clinically isolated syndrome (CIS), in whom there was a clinical need for CSF analysis and in 8 patients with other neurological disorders, both inflammatory and noninflammatory, as controls. All analyses were performed with CSF immediately processed after harvesting. As men-tioned in the M&M, only 58% of the samples contained enough cells to perform the test. There was an average of 525± 105 B cells (CD19+DAPI−) in fresh CSF samples (ranging from 50 to 2710 B cells) in the tested samples. An example of the gating strategy is represented inFigure 6(a). Cells in CSF samples were selected according to the SSC and
105 104 103 102 0 105 104 103 102 0 C o m p-D API-A Annexin V-FITC-A Early apoptotic cells Late apoptotic cells (a)
Early Late Early Late 0 5 10 15 20 25 MS HI Albumin MOG A p o p to tic cells in BBR +subs et (%) (b)
Figure 5: Analysis of apoptosis in MOG-specific B cells. (a) We used annexin V and DAPI to characterize MOG-BBR apoptosis cells in MS (𝑛 = 10) and HI (𝑛 = 10). We analysed annexin V+DAPI−(early apoptotic cells) and annexin V+DAPI+(late apoptotic cells) in the
MOG-BBR subset. The gating strategy was represented. (b) We compared the frequency of MOG-BBR apoptotic cells in MS and HI in early (ns,𝑃 > 0.05) and late states (ns, 𝑃 > 0.05), Mann-Whitney test.
FSC parameters as beads and rosettes which had a small size (FSC) and high SSC. DAPI and CD19 markers were first used to analyze only live B cells and exclude dead rosettes. The costaining of APC and PE determines MOG-specific B cells (beads-APC/CD19-PE). Then, the Boolean gate function was used to determine the % of rosettes selected in CD19 live cells, giving the frequency of MOG-specific B cells.
We found an identical intrathecal frequency of MOG-specific B cells in CIS (10.28± 4.48%) and control individuals (8.62± 3.98%) (𝑃 = 0.6) (Figure 6(b)). The CSF frequency of MOG-BBR was higher in both groups compared to the albumin-BBR frequency in CIS (Figure 6(b)) and circulating MOG-BBR (1.28± 0.11 and 0.57 ± 0.10%) in CIS patients and in the control group, respectively (𝑃 < 0.05) (Figure 6(c)).
3.6. Anti-MOG-BBR Transfer through Brain-Derived Endothe-lial Cells. We first tested whether B cells from RRMS patients
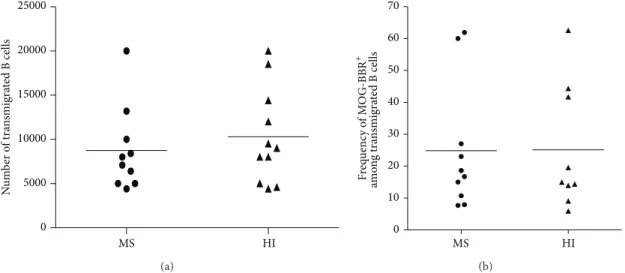
transmigrated more efficiently than B cells from HI across the endothelial cell layer in vitro. In MS, 8750 ± 1505 B cells transmigrated overnight compared to 10309± 1622 B cells in HI out of 5 × 10⁵ CD19+ cells initially placed in the double chamber device (about 2% of transmigrating B cells). Despite confirming that human B cells migrate efficiently across the blood-brain barrier [34], there was no statistical difference between the MS and HI values (𝑃 = 0.49, Figure 7(a)). We then checked whether MOG-BBR accumulated more efficiently in MS patients compared to HI by assessing the capacity of the B cells to make MOG-BBR after a transmigration assay. We observed no statistical difference in the transmigration rate of MOG-specific B cells in MS (24.85± 6.32%) and in HI (25.11 ± 6.50%) (Figure 7(b)).
3.7. Plasma Anti-MOG IgG Reactivity. The presence of
anti-MOG antibodies was tested with a cell-based assay (CBA). A cut-off of 1 : 160 was chosen and used for discrimination of ADEM and other groups, as in previous studies [27]. Above this threshold, we found only two seropositive samples in a single RR MS patient (Supplementary Figure 3a). Surpris-ingly, one normal individual also exhibited a strong reaction. The frequency of BBR-MOG for this patient was 0.32%, which is not within the highest frequency values of RR MS patients. Similar observation can be done for the anti-MOG seroposi-tive HI. We did not observe a significant correlation between MOG-specific BBR and CBA reactive soluble antibodies (𝑟2= 0.032, 𝑃 > 0.05) (Supplementary Figure 3b). Since beads were coupled to the extracellular domain of MOG, reactivity to this antigen was also analyzed by ELISA, but again no differences were observed between MS patients and controls and no sig-nificant correlation between MOG-specific BBR and MOG reactive soluble antibodies was found (data not shown).
The presence of anti-EBNA1 IgG, reported to be asso-ciated with MS [35, 36], was tested to see whether the frequency of MOG-specific B cells correlates with EBNA-1 titers. Anti-EBNA1 IgG titers were higher in MS patients than HI (𝑃 = 0.03) (Supplementary Figure 4) but no correlation was evidenced between the frequency of MOG-specific B cells and anti-EBNA1 titers (data not shown).
4. Discussion
Despite the beneficial effect of anti-CD20 in treating the disease, the potential role of B cells in multiple sclerosis (MS) has been less well documented than that of T cells. In this
0 0 SSC-A FSC-A FSC-A 105 104 103 102 105 104 103 102 101 105 104 103 102 101 DA P I 0 105 104 103 102 DA P I CD19-PE B eads-APC 105 104 103 102 101 105 104 103 102 101 CD19-PE 105 104 103 102 101 CD19-PE B eads-APC 250 k 200k 150k 100k 50k 0 SSC-A 250 k 200k 150k 100k 50k 250 k 200k 150k 100k 50k 50k 100k 150k 200k 250 k FSC-A 250 k 200k 150k 100k 50k (a)
Albumin MOG Albumin MOG 0 10 20 30 40 50 CIS Control ns F req uenc y o f BBR + am o n g CD 19 + cells (%) ∗∗ ∗ (b) CIS Blood CSF Blood CSF Control F req uenc y o f M O G-BBR + am o n g CD 19 +cells (%) ∗∗ ∗∗ 0 5 10 15 3 0 3 5 4 0 (c)
Figure 6: Intrathecal MOG-specific B cells in CIS and patients with non-MS-related pathologies. (a) The gating strategy of CSF analysis is represented. The number of B cells in this CIS sample was 1771 cells. The BBR frequency was obtained by FlowJo analysis which calculated the percentage of MOG-specific B cells among B cell subsets: 107 BBR corresponds to 5.69%. (b) Cells from fresh CSF samples were stained with CD19 antibody and incubated with rMOG and human albumin coated beads. After exclusion of dead cells (DAPI+), the frequency of BBR recognizing rMOG and albumin was assessed in CIS (𝑛 = 9) and control patients (𝑛 = 8) (ns, 𝑃 > 0.05). Mann-Whitney test and Wilcoxon
test were used to compare albumin-BBR and MOG-BBR in CIS (𝑃 < 0.05) and control patients (𝑃 < 0.05) (c). The frequency of circulating
and intrathecal MOG-BBR was assessed in CIS (𝑛 = 6) and control patients (𝑛 = 6). Intrathecal frequency of MOG-BBR was higher than circulating frequency (ns,𝑃 > 0.005, Mann-Whitney test).
paper, we explore the frequency of MOG-specific B cells in the blood of patients with MS and in the spinal fluid of CIS patients, using a novel method based on the measurement of a direct interaction between a B lymphocyte and a fluorescent polystyrene bead to which human MOG is covalently bound [21].
The extracellular Ig-like MOG domain is unique in that it is the only protein structure known to induce both demyeli-nating autoantibody and encephalitogenic T cell responses in EAE [37]. MOG is a quantitatively minor component of myelin in CNS [38]. Antibodies directed toward the confor-mational MOG1-125and not directed toward the linear MOG,
N u m b er o f tra n smigra te d B cells MS HI 0 5000 10000 15000 20000 25000 (a) MS HI 0 10 20 30 40 50 60 70 F req uenc y o f M O G-BBR + am o n g tra n smigra te d B cells (b)
Figure 7: Transmigration of B cells across brain vessel derived endothelial cells. (a) B cells were negatively selected and a transmigration assay across HCMEC/D3 cell line was performed. Transmigrated cells in MS (𝑛 = 10) and HI (𝑛 = 11) were counted; no difference was observed (ns,𝑃 > 0.05, Mann-Whitney test). (b) Transmigrated B cells were stained and incubated with MOG coated beads. The frequency of MOG-BBR was assessed in MS patients (𝑛 = 10) and HI (𝑛 = 9) (ns, 𝑃 > 0.05, Mann-Whitney test).
such as the mouse antibody 8.18C5 [24], are instrumental in inducing anti-MOG antibody mediated EAE [39]. Several studies suggest that they are present in a subset of predomi-nantly pediatric inflammatory demyelinating diseases which are distinct from MS [9]. While a significantly higher level of anti-EBNA1 titers was found in MS patients, no correlation with anti-MOG-BBR frequency was observed. Regarding the rMOG used, it is important to note that the 8.18C5 antibody recognizes 91% of the MOG1-125 after covalent binding to
the beads, suggesting that a good proportion of the bound MOG1-125exhibit the correct folding. However, to what extent
the folding of MOG1-125affects the frequency of B cells with
a membrane antigen receptor interacting with MOG-coated beads could not be precisely assessed in this test, which differs from the cell-based assay used to measure soluble anti-MOG antibodies. Finally, since we did not test antibody secretion of MOG-BBR, we cannot exclude that this subset is able to produce some MOG antibodies. Nevertheless, it is important to note that we observed a significant difference in anti-MOG1-125committed B cells between the MS patients and the
controls (𝑃 = 0.018), whereas no difference in anti-MOG antibody titers against conformational and linear MOG has been found [40] in adult MS patients, clearly suggesting a B cell specific alteration in this disease.
A first finding was that the frequency of B cells engaging with MOG-coated beads was unexpectedly high, both in the MS patients and in healthy individuals (HI). This observation has been in parallel with the well documented description of high frequency of MOG-specific T cells in HI [7]. It is likely that B cell specific maturation processes are involved in the high anti-MOG B cell frequencies.
BCR cross-reactivity and/or polyreactivity studies of blood B cells [19] have indeed ambiguously shown a sub-stantial percentage of circulating B cells (20% of immature B cells remain autoreactive, with 4% of them being polyreactive cells) having escaped the first BCR-dependant bone marrow
selection checkpoint, which triggers apoptosis or reediting for autoreactive BCR [19, 20]. However in these seminal studies, the end point was the production of Ig against a panel of antigens in limiting conditions. A study of the direct binding of the B cell to its antigen may be a more sensitive tool for frequency calculation. We also tested the polyreactivity of MOG-BBR to dsDNA, LPS, and insulin antigens [19]. However, unexpectedly high values of competition for anti-MOG BCR were found for LPS, a major component of the outer membrane of Gram negative bacteria, and a toll-like receptor agonist. Cross-reactivity of surface BCR of MOG-BBR for dsDNA was roughly of the same magnitude as the cross-reactivity/polyreactivity of secreted antibodies anti-dsDNA after the first repertoire checkpoint of B cells [19]. Higher competition was noted for insulin. These differences may be due to a difference in maturation of surface B cell receptor that we explored versus secreted antibodies [19]. This polyreactivity normally downregulated in the last phase of B cell development has been proposed as the link between infection and autoimmune diseases leading to a breakdown of the immunological tolerance as documented in clinical settings and in animal models [41, 42]. In line with this, a study has shown an increase of immune reactivity to bacterial LPS in NMO patients [43]. However, our study was not designed to specifically address this issue and this observation requires confirmation and caution in interpretation.
In addition, our method used Luminex beads which, when used for testing specific antibodies such as anti-HLA, exhibits a gain of sensitivity of an order of magnitude compared to classical methods [44]. The case that an assay using the same readout (FACS) and material (Luminex) also displays a gain in sensitivity is conceivable.
Strikingly, we found a significant decreased MOG-specific B cell frequency in the blood of MS compared to age/gender matched control individuals. Importantly, the samples from HI and MS were routinely processed back to
back in the tests. Furthermore, no difference was exhibited in the frequencies of B cells recognizing tetanus toxin and albu-min coated beads between patients with MS and HI. Finally, the anti-MOG B cell frequency was decreased neither in a small group of MS patients with secondary progressive form (SPMS) nor in the CIS patients suggesting that this alteration occurs in the course of the relapse-remitting disease rather than at its onset. We did not find evidence for a specific phe-notype bias of the anti-MOG B cells, with normal distribution (both for MS and HI) of na¨ıve, memory cell phenotypes.
Recently, a subset of potentially autoreactive B cells, B1 cells, defined as CD3−CD20+CD27+CD43+ [45], was found to be lower in the blood of MS patients versus HI [46]. Although no test for the MOG specificity of the B1 cells was carried out in this study, the magnitude of the decrease in B1 cells (29% of the B cells) in the referred study was however too small (1.2% in MS patients versus 1.7% in normal individuals) to account significantly for our observation (RRMS had a 36% decrease in MOG-BBR). Furthermore, the B cell selection kit that we used did not select CD43+ cells, which accounted for most of the B1 cells. To the best of our knowledge, only one study is available on anti-MOG B cell frequency, using biotinylated MOG in a small cohort (𝑛 = 9) of patients with RRMS [12]. This interesting study suggests that circulating memory anti-MOG B cells of MS patients could provide a greater help to CD4+T cells than memory anti-MOG B cells of HI. However, no significant difference of frequency in anti-MOG B cells between MS patients and HI was noted in this study. The reason for this discrepancy with our study is not clear, although our cohort was 4 times bigger (38 MS and 50 HI). Recently, another study reported that autoreactive B cells in MS were more prone to produce polyreactive antibodies to an extract of white matter [47] than in HI. However, no frequency of myelin or MOG-specific B cells was analyzed. Finally, our data do not support that idea that normal individual B cells have no reactivity against brain extracts, as was recently suggested [48]. However, it must be said that Kuerten et al. used in vitro polyclonally stimulated B cells and CNS extract.
Reasons for the significant decrease in anti-MOG circu-lating B cells remain so far undefined. Particularly, we could not find evidence for an increase in early or late apoptosis of anti-MOG B cells. However, the growth potential of MOG-specific B cells, as assessed by expression of the KI-67 marker, shows a trend (𝑃 = 0.06) for a lower expression in MS patients that may contribute to the lower frequency of anti-BBR in MS. The possibility that the “missing” MOG-specific circulating B cell population could be in the CNS was suggested by a documented increase of anti-MOG IgG in spinal fluid from MS patients [49] and by the shared BCR clonotypes between blood and CSF [50]. We could only measure the level of anti-MOG B cells in the CSF of CIS patients. However, we could not document a possible increased homing of MOG-specific B cells in CSF of our RR-MS patients since there is no clinical indication for CSF analysis in overt MS disease, making the study unethical.
Connections between the periphery and CNS allowing trafficking of antigens and presenting or effector cells have been well documented [51,52] and may offer a substratum for
transfer and homing of anti-MOG B cells in the brain. More recently evidenced connecting pathway may also be involved [53,54]. Nevertheless, there was no difference of anti-MOG-BBR in transmigration assays although B cells (2%) showed efficient transmigration through a brain-derived endothelial cell layer, in concordance with another study [34].
In conclusion, our study gives the initial evidence of an abnormal circulating pool of anti-MOG B cells. In vitro analyses were unable to detect discrete changes in surface molecules involved in B cell homing in noncirculating sites of the immune system. It is possible that the mechanisms that govern this decreased MOG-specific frequency are no longer active at the time of the assay. Significantly, our observation involved a specific B cell alteration which is independent of the pattern of anti-MOG antibodies and which is not restricted to the optimal MOG conformation as is the case for soluble antibodies detected in the cell-based assay [9]. Recently, a cellular involvement of B cells, independent of their humoral function, was shown in pathogenesis of EAE [55]. Finally, whether MOG-specific B cells are actually involved in the disease pathology is not directly confirmed by our observations, considering that a high percentage of these specific B cells are also observed in HI blood, mimicking the situation described for T cells with myelin autoreactivity [3,7]. In this respect, the positive effect of anti-CD20 on the disease outcome might be misleading in terms of the actual role of MOG-specific B cells in the disease. Indeed, besides the destruction of a fraction of potentially pathogenic B cells (partial depletion in lymph nodes [11]), such reagents also affect the properties of bystander B cells and may induce these cells to produce more immunoregulatory cytokines or to exhibit modified functions, as recently suggested [11,56].
5. Conclusion
In this paper, we detected MOG-specific B cells in MS by a novel approach using fluorescent beads covalently bound to extracellular domain of MOG. We show for the first time that, as for T cells, healthy individual blood harbors autoreactive MOG B cells. In addition, we showed a significantly lower frequency of MOG-specific B cells in patients with relapsing-remitting MS compared to HI. The decrease of this subset suggests their implication in MS and stresses further studies.
Abbreviations
BBR: B cell beads rosettes CBA: Cell-based assay CSF: Cerebrospinal fluid HI: Healthy individuals
MOG: Myelin oligodendrocyte glycoprotein MS: Multiple sclerosis
RR: Relapsing-remitting SP: Secondary progressive.
Conflict of Interests
The authors declare that there is no conflict of interests regarding the publication of this paper.
Authors’ Contribution
Annie Elong Ngono and Maud Lepetit have equally con-tributed as co-first authors and Sophie Brouard, David-Axel Laplaud, and Jean-Paul Soulillou have equally contributed as co-senior authors and are listed by alphabetical order.
Acknowledgments
The authors thank Fabienne Glacial and Pr. Pierre Olivier Couraud for kindly providing brain de-rived endothelial cells (Cochin Institute), Emilie Dugast and Bryan Nicol for tech-nical help, and Gurumoorthy Krishnamoorthy and Harmut Wekerle for kindly providing the IgHMOG transgenic sple-nocytes. Annie Elong Ngono was supported by a grant from the R´egion Pays de Loire: “TRAK in MS” program.
References
[1] C. Lucchinetti, W. Br¨uck, J. Parisi, B. Scheithauer, M. Rodriguez, and H. Lassmann, “Heterogeneity of multiple sclerosis lesions: implications for the pathogenesis of demyelination,” Annals of
Neurology, vol. 47, no. 6, pp. 707–717, 2000.
[2] A. Compston and A. Coles, “Multiple sclerosis,” The Lancet, vol. 372, no. 9648, pp. 1502–1517, 2008.
[3] B. Bahbouhi, S. Pettr´e, L. Berthelot et al., “T cell recognition of self-antigen presenting cells by protein transfer assay reveals a high frequency of anti-myelin T cells in multiple sclerosis,”
Brain, vol. 133, no. 6, pp. 1622–1636, 2010.
[4] A. Ben-Nun, H. Wekerle, and I. R. Cohen, “Vaccination against autoimmune encephalomyelitis with T-lymphocyte line cells reactive against myelin basic protein,” Nature, vol. 292, no. 5818, pp. 60–61, 1981.
[5] H. Wekerle, “Lessons from multiple sclerosis: models, concepts, observations,” Annals of the Rheumatic Diseases, vol. 67, supple-ment 3, pp. iii56–iii60, 2008.
[6] A. G. Baxter, “The origin and application of experimental autoimmune encephalomyelitis,” Nature Reviews Immunology, vol. 7, no. 11, pp. 904–912, 2007.
[7] A. Elong Ngono, S. Pettr´e, M. Salou et al., “Frequency of circulating autoreactive T cells committed to myelin determi-nants in relapsing-remitting multiple sclerosis patients,” Clinical
Immunology, vol. 144, no. 2, pp. 117–126, 2012.
[8] M. Krumbholz, T. Derfuss, R. Hohlfeld, and E. Meinl, “B cells and antibodies in multiple sclerosis pathogenesis and therapy,”
Nature Reviews Neurology, vol. 8, no. 11, pp. 613–623, 2012.
[9] M. Reindl, F. Di Pauli, K. Rost´asy, and T. Berger, “The spectrum of MOG autoantibody-associated demyelinating dis-eases,” Nature Reviews Neurology, vol. 9, no. 8, pp. 455–461, 2013. [10] S. L. Hauser, E. Waubant, D. L. Arnold et al., “B-cell depletion with rituximab in relapsing-remitting multiple sclerosis,” The
New England Journal of Medicine, vol. 358, no. 7, pp. 676–688,
2008.
[11] E. G. Kamburova, H. J. P. M. Koenen, K. J. E. Borgman, I. J. Ten Berge, I. Joosten, and L. B. Hilbrands, “A single dose of rituximab does not deplete b cells in secondary lymphoid organs but alters phenotype and function,” American Journal of
Transplantation, vol. 13, no. 6, pp. 1503–1511, 2013.
[12] C. T. Harp, S. Ireland, L. S. Davis et al., “Memory B cells from a subset of treatment-na¨ıve relapsing-remitting multiple sclerosis
patients elicit CD4+T-cell proliferation and IFN-𝛾 production in response to myelin basic protein and myelin oligodendrocyte glycoprotein,” European Journal of Immunology, vol. 40, no. 10, pp. 2942–2956, 2010.
[13] C. Mauri and A. Bosma, “Immune regulatory function of B cells,” Annual Review of Immunology, vol. 30, pp. 221–241, 2012. [14] S. Fillatreau, C. H. Sweenie, M. J. McGeachy, D. Gray, and S. M. Anderton, “B cells regulate autoimmunity by provision of IL-10,” Nature Immunology, vol. 3, no. 10, pp. 944–950, 2002. [15] L. le Texier, P. Thebault, A. Lavault et al., “Long-term
allo-graft tolerance is characterized by the accumulation of B cells exhibiting an inhibited profile,” The American Journal of
Transplantation, vol. 11, no. 3, pp. 429–438, 2011.
[16] M. Chesneau, A. Pallier, F. Braza et al., “Unique B cell dif-ferentiation profile in tolerant kidney transplant patients,” The
American Journal of Transplantation, vol. 14, no. 1, pp. 144–155,
2014.
[17] S. Knippenberg, E. Peelen, J. Smolders et al., “Reduction in IL-10 producing B cells (Breg) in multiple sclerosis is accompanied by a reduced na¨ıve/memory Breg ratio during a relapse but not in remission,” Journal of Neuroimmunology, vol. 239, no. 1-2, pp. 80–86, 2011.
[18] Y. Iwata, T. Matsushita, M. Horikawa et al., “Characterization of a rare IL-10-competent B-cell subset in humans that parallels mouse regulatory B10 cells,” Blood, vol. 117, no. 2, pp. 530–541, 2011.
[19] H. Wardemann, S. Yurasov, A. Schaefer, J. W. Young, E. Meffre, and M. C. Nussenzweig, “Predominant autoantibody production by early human B cell precursors,” Science, vol. 301, no. 5638, pp. 1374–1377, 2003.
[20] E. Meffre and H. Wardemann, “B-cell tolerance checkpoints in health and autoimmunity,” Current Opinion in Immunology, vol. 20, no. 6, pp. 632–638, 2008.
[21] N. Degauque, A. E. Ngono, A. Akl et al., “Characterization of antigen-specific B cells using nominal antigen-coated flow-beads,” PLoS ONE, vol. 8, no. 12, Article ID e84273, 2013. [22] K. Raddassi, S. C. Kent, J. Yang et al., “Increased
frequen-cies of myelin oligodendrocyte glycoprotein/MHC class II-binding CD4 cells in patients with multiple sclerosis,” Journal
of Immunology, vol. 187, no. 2, pp. 1039–1046, 2011.
[23] C. H. Polman, S. C. Reingold, G. Edan et al., “Diagnostic criteria for multiple sclerosis: 2005 revisions to the ‘McDonald Criteria’,”
Annals of Neurology, vol. 58, no. 6, pp. 840–846, 2005.
[24] C. Breithaupt, B. Sch¨afer, H. Pellkofer, R. Huber, C. Lining-ton, and U. Jacob, “Demyelinating myelin oligodendrocyte glycoprotein-specific autoantibody response is focused on one dominant conformational epitope region in rodents,” Journal of
Immunology, vol. 181, no. 2, pp. 1255–1263, 2008.
[25] B. B. Weksler, E. A. Subileau, N. Perri`ere et al., “Blood-brain barrier-specific properties of a human adult brain endothelial cell line,” The FASEB Journal, vol. 19, no. 13, pp. 1872–1874, 2005. [26] B. Bahbouhi, L. Berthelot, S. Pettr´e et al., “Peripheral blood CD4+ T lymphocytes from multiple sclerosis patients are characterized by higher PSGL-1 expression and transmigration capacity across a human blood-brain barrier-derived endothe-lial cell line,” Journal of Leukocyte Biology, vol. 86, no. 5, pp. 1049–1063, 2009.
[27] F. di Pauli, S. Mader, K. Rostasy et al., “Temporal dynamics of anti-MOG antibodies in CNS demyelinating diseases,” Clinical
[28] T. Litzenburger, R. F¨assler, J. Bauer et al., “B lymphocytes pro-ducing demyelinating autoantibodies: development and func-tion in gene-targeted transgenic mice,” Journal of Experimental
Medicine, vol. 188, no. 1, pp. 169–180, 1998.
[29] D.-H. Lee and R. A. Linker, “The role of myelin oligodendrocyte glycoprotein in autoimmune demyelination: a target for multi-ple sclerosis therapy?” Expert Opinion on Therapeutic Targets, vol. 16, no. 5, pp. 451–462, 2012.
[30] I. J. Amanna, N. E. Carlson, and M. K. Slifka, “Duration of humoral immunity to common viral and vaccine antigens,” The
New England Journal of Medicine, vol. 357, no. 19, pp. 1903–1915,
2007.
[31] U. Klein, K. Rajewsky, and R. K¨uppers, “Human immunoglob-ulin (Ig)M+IgD+peripheral blood B cells expressing the CD27 cell surface antigen carry somatically mutated variable region genes: CD27 as a general marker for somatically mutated (memory) B cells,” The Journal of Experimental Medicine, vol. 188, no. 9, pp. 1679–1689, 1998.
[32] A. L. Peters, L. L. Stunz, and G. A. Bishop, “CD40 and autoimmunity: the dark side of a great activator,” Seminars in
Immunology, vol. 21, no. 5, pp. 293–300, 2009.
[33] J. Gerdes, U. Schwab, H. Lemke, and H. Stein, “Production of a mouse monoclonal antibody reactive with a human nuclear antigen associated with cell proliferation,” International Journal
of Cancer, vol. 31, no. 1, pp. 13–20, 1983.
[34] A. Alter, M. Duddy, S. Hebert et al., “Determinants of human B cell migration across brain endothelial cells,” Journal of
Immunology, vol. 170, no. 9, pp. 4497–4505, 2003.
[35] R. A. Farrell, D. Antony, G. R. Wall et al., “Humoral immune response to EBV in multiple sclerosis is associated with disease activity on MRI,” Neurology, vol. 73, no. 1, pp. 32–38, 2009. [36] L. I. Levin, K. L. Munger, M. V. Rubertone et al., “Temporal
relationship between elevation of Epstein-Barr virus antibody titers and initial onset of neurological symptoms in multiple sclerosis,” The Journal of the American Medical Association, vol. 293, no. 20, pp. 2496–2500, 2005.
[37] C. Linington, T. Berger, L. Perry et al., “T cells specific for the myelin oligodendrocyte glycoprotein mediate an unusual autoimmune inflammatory response in the central nervous system,” European Journal of Immunology, vol. 23, no. 6, pp. 1364–1372, 1993.
[38] N. Baumann and D. Pham-Dinh, “Biology of oligodendrocyte and myelin in the mammalian central nervous system,”
Physio-logical Reviews, vol. 81, no. 2, pp. 871–927, 2001.
[39] H.-C. von B¨udingen, S. L. Hauser, J.-C. Ouallet, N. Tanuma, T. Menge, and C. P. Genain, “Frontline: epitope recognition on the myelin/oligodendrocyte glycoprotein differentially influences disease phenotype and antibody effector functions in autoim-mune demyelination,” European Journal of Immunology, vol. 34, no. 8, pp. 2072–2083, 2004.
[40] S. J. Pittock, M. Reindl, S. Achenbach et al., “Myelin oligo-dendrocyte glycoprotein antibodies in pathologically proven multiple sclerosis: Frequency, stability and clinicopathologic correlations,” Multiple Sclerosis Journal, vol. 13, no. 1, pp. 7–16, 2007.
[41] C. A. Muniz Caldas and J. Freire de Carvalho, “The role of environmental factors in the pathogenesis of non-organ-specific autoimmune diseases,” Best Practice and Research:
Clinical Rheumatology, vol. 26, no. 1, pp. 5–11, 2012.
[42] G. R. Persson, “Rheumatoid arthritis and periodontitis— inflammatory and infectious connections. Review of the litera-ture,” Journal of Oral Microbiology, vol. 4, Article ID 11829, 2012.
[43] P. O. Barros, U. C. Linhares, B. Teixeira et al., “High in vitro immune reactivity to Escherichia coli in neuromyelitis optica patients is correlated with both neurological disabilities and ele-vated plasma lipopolysaccharide levels,” Human Immunology, vol. 74, no. 9, pp. 1080–1087, 2013.
[44] S. Ferrari-Lacraz, J.-M. Tiercy, and J. Villard, “Detection of anti-HLA antibodies by solid-phase assay in kidney transplantation: friend or foe?” Tissue Antigens, vol. 79, no. 5, pp. 315–325, 2012. [45] D. O. Griffin and T. L. Rothstein, “Human B1 cell frequency: iso-lation and analysis of human B1 cells,” Frontiers in Immunology, vol. 3, article 122, 2012.
[46] C. Tørring, C. C. Petersen, L. Bjerg, E. Kofod-Olsen, T. Petersen, and P. H¨ollsberg, “The B1-cell subpopulation is diminished in patients with relapsing-remitting multiple sclerosis,” Journal of
Neuroimmunology, vol. 262, no. 1-2, pp. 92–99, 2013.
[47] T. Kinnunen, N. Chamberlain, H. Morbach et al., “Specific peripheral B cell tolerance defects in patients with multiple sclerosis,” Journal of Clinical Investigation, vol. 123, no. 6, pp. 2737–2741, 2013.
[48] S. Kuerten, G. Pommerschein, S. K. Barth et al., “Identification of a B cell-dependent subpopulation of multiple sclerosis by measurements of brain-reactive B cells in the blood,” Clinical
Immunology, vol. 152, no. 1-2, pp. 20–24, 2014.
[49] M. Markovic, V. Trajkovic, J. Drulovic et al., “Antibodies against myelin oligodendrocyte glycoprotein in the cerebrospinal fluid of multiple sclerosis patients,” Journal of the Neurological
Sci-ences, vol. 211, no. 1-2, pp. 67–73, 2003.
[50] H.-C. von B¨udingen, T. C. Kuo, M. Sirota et al., “B cell exchange across the blood-brain barrier in multiple sclerosis,” Journal of
Clinical Investigation, vol. 122, no. 12, pp. 4533–4543, 2012.
[51] A. Palanichamy, L. Apeltsin, T. C. Kuo et al., “Immunoglobulin class-switched B cells form an active immune axis between CNS and periphery in multiple sclerosis,” Science Translational
Medicine, vol. 6, no. 248, p. 248ra106, 2014.
[52] B. Melchior, V. N´erri`ere-Daguin, N. Degauque et al., “Compart-mentalization of TCR repertoire alteration during rejection of an intrabrain xenograft,” Experimental Neurology, vol. 192, no. 2, pp. 373–383, 2005.
[53] J. J. Iliff, M. Wang, Y. Liao et al., “A paravascular pathway facilitates CSF flow through the brain parenchyma and the clearance of interstitial solutes, including amyloid𝛽,” Science
Translational Medicine, vol. 4, no. 147, Article ID 147ra111, 2012.
[54] L. Yang, B. T. Kress, H. J. Weber et al., “Evaluating glymphatic pathway function utilizing clinically relevant intrathecal infu-sion of CSF tracer,” Journal of Translational Medicine, vol. 11, no. 1, article 107, 2013.
[55] N. Molnarfi, U. Schulze-Topphoff, M. S. Weber et al., “MHC class II-dependent B cell APC function is required for induction of CNS autoimmunity independent of myelin-specific antibod-ies,” Journal of Experimental Medicine, vol. 210, no. 13, pp. 2921– 2937, 2013.
[56] P. Shen, T. Roch, V. Lampropoulou et al., “IL-35-producing B cells are critical regulators of immunity during autoimmune and infectious diseases,” Nature, vol. 507, no. 7492, pp. 366–370, 2014.