Science Arts & Métiers (SAM)
is an open access repository that collects the work of Arts et Métiers Institute of Technology researchers and makes it freely available over the web where possible.
This is an author-deposited version published in: https://sam.ensam.eu Handle ID: .http://hdl.handle.net/10985/17675
To cite this version :
Aleksandar PETROV, Jean-Philippe PERNOT, Franca GIANNINI, Philippe VÉRON, Bianca FALCIDIENO - Understanding the relationships between aesthetic properties and geometric quantities of free-form surfaces using machine learning techniques - International Journal on Interactive Design and Manufacturing (IJIDeM) p.nc - 2019
Any correspondence concerning this service should be sent to the repository Administrator : [email protected]
Understanding the relationships between aesthetic properties
and geometric quantities of free‑form surfaces using machine
learning techniques
Aleksandar Petrov1 · Jean‑Philippe Pernot1 · Franca Giannini2 · Philippe Véron1 · Bianca Falcidieno2
Received: 11 September 2019 / Accepted: 18 October 2019 © Springer-Verlag France SAS, part of Springer Nature 2019 Abstract
Designing appealing products plays a key role in commercial success. Understanding the relationships between aesthetic properties and shape characteristics of a product can contribute to define user-friendly and interactive designing tools sup-porting the early design phases. This paper introduces a generic framework for mapping aesthetic properties to 3D free form shapes. The approach uses machine learning techniques to identify rules between the user-defined classifications of shapes and the geometric parameters of the underlying free form surfaces and to create an efficient classification model. The frame-work has been set up and validated focusing on the flatness aesthetic property but is generic and can be applied to others. Several experiments have been conducted to understand if there is a consistency among people in the judgement of a specific aesthetic properties, if and to which extent the surrounding of the judged surface affects the perception consistency, and which are the surface geometric quantities influencing the perception. A graphic user interface has been designed to allow a fast classification of thousands of shapes automatically generated. The experiments have been conducted following a systematic methodology comparing two different approaches. The results confirm that the perception of flatness is commonly shared by the majority and the most relevant attributes have been identified. Additionally, it results that the surrounding information extension and context influence the perception of the flatness strengthening the classification consistency. The way those results can be used to design new interactive tools and to improve the product design process is discussed.
Keywords Free-Form surfaces · Machine Learning Techniques · Data Mining · Aesthetic Properties
Abbreviations
MLT Machine learning techniques AE Affective engineering PDP Product design process
FIORES Formalization and Integration of an Optimized Reverse Engineering Styling Workflow IDS Instance data set
GUI Graphical user interface
WEKA Waikato Environment for Knowledge Analysis M Morphing
Ts Target shapes DP Deformation path
TsCM Target shapes of a coffee machine TsCB Target shapes of a car back TsCD Target shapes of a car door
1 Introduction
Today, the worldwide competitiveness pushes companies to innovate and to propose products which best fit the custom-ers’ requirements at affordable prices. Not only it is impor-tant to fulfill the functional and technical requirements, but it is also crucial to pay attention to the aesthetic appearance
* Aleksandar Petrov [email protected] Jean-Philippe Pernot [email protected] Franca Giannini [email protected] Philippe Véron [email protected] Bianca Falcidieno [email protected]
1 LISPEN EA 7515, HeSam, Arts et Métiers ParisTech, Aix-en-Provence, France
and emotional impact of the products. Even if more subjec-tive, those criteria are key factors often driving the final customers’ choice and affecting the commercial success of the products. In this context, it is important to understand and to model the relationships between the shapes and some aesthetic properties to design appealing products able to trig-ger purchase intent.
The first contribution of this paper is to propose and to test a generic framework for collecting and processing the judgments on the classification of free form shapes with respect to aesthetic properties. The key element of the pro-posed framework is the application of supervised MLTs to deduce the relationships between the user-specified aesthetic properties and geometric quantities automatically extract-able of the free form shapes and to create an efficient clas-sification model.
The classification model created in the learning process can be later used to evaluate ‘new’ and unclassified shapes according to some previously defined properties. A scenario in which the user interactively explores large varieties of shapes within a virtual environment is foreseen. When a shape is selected by the user, different alternative shapes can be suggested and at the same time classified with respect to aesthetic properties in order to give fast feedbacks. Such an automatic characterization of shapes is of foremost inter-est to support the user in his/her decisional process, and its implementation within a virtual environment would be very beneficial for interactive design of shapes. Moreover, the geometric quantities used for shape characterization can be also used as inputs of an interactive deformation tool so as to allow closer loops of shape modification and shape characterization. This would enable scenarios where the user can also perform interactive shape deformations by means of modifying the aesthetic characteristics with simple use of a slider. Overall, having fast shape characterizations coupled to real-time shape modifications would definitively improve the product design process in its early design phases.
The second contribution of this paper regards the genera-tion of a large database and the developed semi-automatic classification approach to allow a very fast classification of thousands of shapes.
The third contribution corresponds to the results of sev-eral experiments conducted to answer to four main ques-tions: (1) Is there a common perception of the flatness?, (2) Is the amount of the surrounding surface influencing the perception of flatness?, (3) Is the surrounding context influencing the perception of flatness?, (4) What are the most relevant geometric parameters which best character-ize the flatness? The experiments have been conducted fol-lowing a systematic methodology comparing two different approaches: one based on a general classification obtained by the majority principle, and one that uses mutual com-parisons. The answers to those questions and the associated
knowledge can then be used to design new interactive tools to support and improve the product design process (PDP).
The flatness property has been considered for validating the proposed framework, but the approach is generic and can be used for other aesthetic properties.
This paper is organized as follows. The next section reviews related works. Section 3 introduces the framework. Section 4 details the elements of the framework and notably the generation of the instances, the extraction of the geomet-ric characteristics of those instances and the adopted semi-automatic classification approach. Section 5 introduces the experiments and methods set up to answer to the questions above. The final section concludes this paper and discusses the limitations and results.
2 Related works
The methodology used to understand the affective influence of shapes and to link those subjective impressions to design parameters and characteristics refers to as affective engineer-ing (AE). Integrated in the PDP, AE provides a platform where emotional features are incorporated into the design of appealing products [1]. Once identified, the relationships between the shapes and the emotions can then be used to tune the shapes of a product since early design phases of the PDP. Reference [2] provide an overview of the most com-mon AE methodologies used to investigate the relationships between shape features and emotions from various discipli-nary perspectives, including psychology and computer sci-ence. When designers create shapes, they use the aesthetic character (properties) of the shape in order to evoke certain previously defined impression and emotions. The aesthetic properties identified by the Formalization and Integration of an Optimized Reverse Engineering Styling Workflow (FIORES-II) [3] project play a key role in the perceptual impression of shapes and correspond to terms often used by designers when modeling shapes.
However, those approaches only refer to free form curves and have not yet been fully formalized for free form surfaces. Actually, this is due to the fact that trying to define the aes-thetic properties of 3D shapes and map them to free form surface characteristics using classical observation techniques is practically impossible. Those mechanisms are very com-plex and involve many factors. Therefore, finding of direct relationships between aesthetic properties and the geomet-ric characteristics of free-form surface is very tedious task. This is even more difficult when the aim is to map emotions to a shape and requires implementing more sophisticated methods.
This is due to the fact that describing a shape is a very difficult and ambiguous task which relies on personal knowl-edge, experience, culture, judgment as well as on different
languages [4]. Despite this complexity, various efforts have been done to describe verbally shapes according to over-all characteristics [5, 6]. However, they mainly focus on retrieval issues and are not enough precise to specify which areas should be more affected by the modifications.
Talton et al. [7] propose semantic-driven exploratory modeling tools allowing rapid creation of complex 3D mod-els by unexperienced users with no specialized skills. Unlike extracting semantics by asking a consumer to describe the shape, Orsborn et al. [8] propose a method to develop and analyze consumer preferences within a quantified aesthetic space. The mapping between the aesthetic preferences of the customers and the product shapes is performed using a utility function.
Burnap et al. [9] propose the use of customer and prod-uct features, instead of customer and prodprod-uct variables, which could increase the prediction accuracy of the design preference model. To relate the product design to customer preferences, MacDonald et al. [10] introduce a constructed preference design method. This method allows browsing a large set of possible solutions answering user preferences.
Similar to our framework, Yumer et al. [11] propose a method That allows the user to explore the set of pos-sible shapes that can be created from an input set of shapes and there is no possibility for the user to express his/her intentions (e.g. “make this shoe more fashionable”). The semantic attributes of the shape are compiled by a group
of professional designers. While this method is applied to explore the space of shapes generated from an input set of shapes, our proposed framework enables the extraction of geometric parameters that can further be used in developing high-level modification and deformation tools.
Xu et al. [12] present a general overview of an entire data-driven 3D shape processing and analysis concept. The 3D models are sparsely enhanced with segmentation and label-ling (classification) in order to support data-driven shape analysis and processing supported by MLTs. Here the MLTs are used as tools to fill the gap between geometric models and semantic information.
As a conclusion, this literature review shows the need for developing advanced techniques for the analysis of the com-plex relationships between the emotional impact of shapes and the geometric quantities of the underlying free-form curves and surfaces. In this context, aesthetic properties of the shape plays a key role and can be seen as intermediate means to link the emotions to the geometric quantities. Thus, in this paper, we set up a generic framework using MLTs to discover the classification rules.
3 Overall framework specification
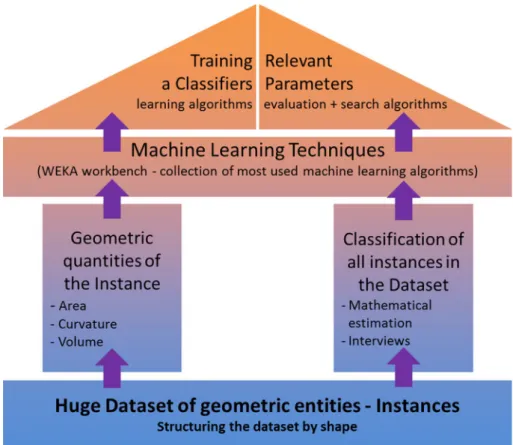
MLTs exploit statistical mechanisms to discover classifica-tion rules from already categorized data and use them to make predictions on new occurrences. Therefore, training set (the base of the temple in Fig. 1) is crucial since it affects the relevance of the extracted classification rules. Thus, in our context, not only the number but also the shapes themselves are critical. The general validity of the identified classifica-tion rules is not guaranteed if the variability of the shapes is limited and if it does not cover the possibilities of shape arrangements that may affect the perception of a given aes-thetic property. Thus, specific methods for the creation of those instances have been devised through the modification of instance replications. The way the training and testing sets are defined is explained in Sect. 4.2.
The second element of the framework is the left pillar of the temple in Fig. 1. It gathers the geometric quantities char-acterizing the instances, i.e. free form surfaces in this paper, which are potentially meaningful for the identification of the classification rules. Here, the key issue is to define which geometric quantities are relevant regarding a given aesthetic property. An important point to consider is to tune the geo-metric characteristics to obtain shape descriptors independ-ent of size, position and oriindepend-entation of shapes. The choice of the geometric quantities is crucial since the instances will be characterized and described by those values from which MLTs extract the classification rules. Those quantities are detailed in Sect. 4.3
The third element of the framework is the pillar repre-senting the classification of all the instances of the dataset (right pillar in Fig. 1). It firstly requires the specification of the classes to be considered, then the assignment to each instance of the dataset. The instance classification is per-formed through interviews. Using Interviews, several issues inherent to the reliability of the classification have to be addressed. For instance, an efficient and intuitive way for conducting the interviews over a sufficiently representative sample (e.g. number, backgrounds) has to be set up. This method is detailed in Sect. 4.4.
The fourth element is the applied MLT. In the proposed approach, we used the Waikato Environment for Knowledge Analysis (WEKA) workbench [13], which gathers together a collection of machine learning algorithms and data pre-processing tools [14]. Here, the main challenge relies on the identification of the classifier and associated control param-eters maximizing the rate of well-classified instances. In our case, we have to face a multi-label classification problem [15] since each instance is associated with multiple labels. The use of multiple labels implies an extra dimension that affects both the learning and evaluation processes [16]. If the instances are classified with more than one label (multiple
labeling) then, before applying the basic single label learn-ing algorithms, dedicated problem transformation methods have to be applied [17]. In the implemented version of our framework, five of the most widely used learning algorithms have been tested and tuned: C4.5 Decision Tree [18], Naïve Bayes [19], k-Nearest Neighbor [20], support vector machine [21] and classification rules [22]. The method used to iden-tify the best learning algorithm is introduced in Sect. 5.2.
The final element of the framework is the roof that rep-resents the experiments and results. Here, two approaches for comparing individual classifications have been used to answer the listed four questions. The first approach consists of comparing the human classification of all participants with respects to a general classification (i.e. the one consid-ering all the provided classifications), the second approach performs mutual comparisons between the classifications of several participants. The two approaches are introduced in Sect. 5.4. Then, the analyses and tests performed are pre-sented in Sects. 5.4–5.7.
4 Setting up the framework for free form
surfaces
Differently from what has been possible for free form curves [23, 24], for free form surfaces, there exists no known rela-tionship between the aesthetic properties and the geometric quantities of free form surfaces. Therefore, several issues have to be faced. First, the type of aesthetic property has to be identified (Sect. 4.1). Then, to apply MLTs, a huge dataset has to be generated (Sect. 4.2) and the geometric quantities characterizing free form surfaces have to be iden-tified and extracted from all the instances of the dataset (Sect. 4.3). Finally, the surfaces/instances have to be clas-sified (Sect. 4.4).
4.1 Aesthetic properties: from the straightness of curves to the flatness of surfaces
In this work, the flatness of surfaces has been taken into consideration as the extension of the straightness property of curves [3]. From an engineering point of view, a flat surface corresponds to a surface that belongs to a given interval of tolerance defined by two parallel planes. From a percep-tual point of view, this condition might be not enough. For instance, conditions on curvature not greatly varying from zero could be more interesting. Anyhow, curvature value is not the unique indicator of flatness and a direct extension of the curve straightness equation to surface flatness is not possible because the geometry for surfaces is more com-plex than for curves. Thus, for surfaces, we have designed a specific approach for their classification with respect to aesthetic properties.
4.2 Generation of the instances dataset
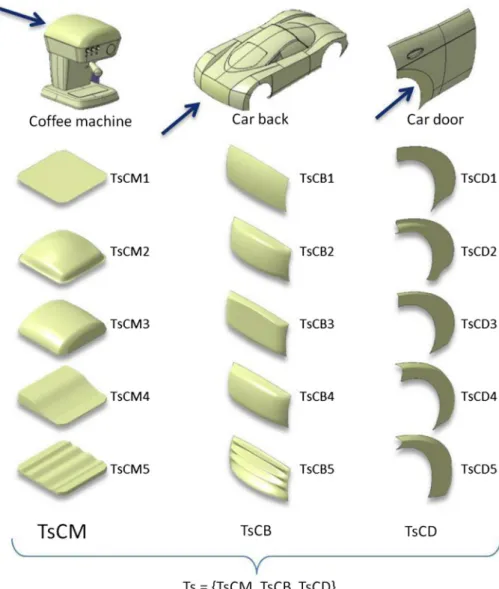
The input to MLTs is a set of classified instances (the base of the temple in Fig. 1). Each instance is an independent exam-ple embedding the concept/rule to be reverse engineered and it is characterized by the values of a set of attributes. Therefore, the choice of the instances is very important: the dataset should contain shapes that are representative of the possible surfaces appearing on industrial products and suit-able for the flatness evaluation while presenting meaning-ful variations of the key shape characteristics. Additionally, since we are interested in understanding the rules which drive the perception of the flatness of surfaces belonging to complex objects, it becomes crucial to understand if and how such a perception is changing depending on the type of product as well as on the surrounding surfaces, i.e. the shape context embedding the considered surface. Thus, we decided to consider surfaces belonging to two very common industrial products: a coffee machine and a car (Fig. 2).
Moreover, since the objective is also to pave the basis also for modification tools, it is important to consider surfaces obtainable through continuous variation. Starting from the assumption that the flattest surface is the planar one, to gen-erate the Instance Dataset (IDS) we performed a continuous deformation of a single planar patch to reach specific sur-faces, called Target shapes (Ts), belonging to three selected products: a coffee machine (CM), a car back (CB) and car door (CD). During the deformation, each surface originates an IDS instance. Various Ts have been considered to satisfy the need of shape variation (e.g. symmetry, asymmetry or undulation) on the perception of flatness.
4.2.1 Deformation paths and morphing process for shape instances generation
Being the shape classification obtained through interviews (Sect. 4.4), the order in which shapes are presented is important since it may affect the overall perception. Thus,
Fig. 2 Target shapes of three
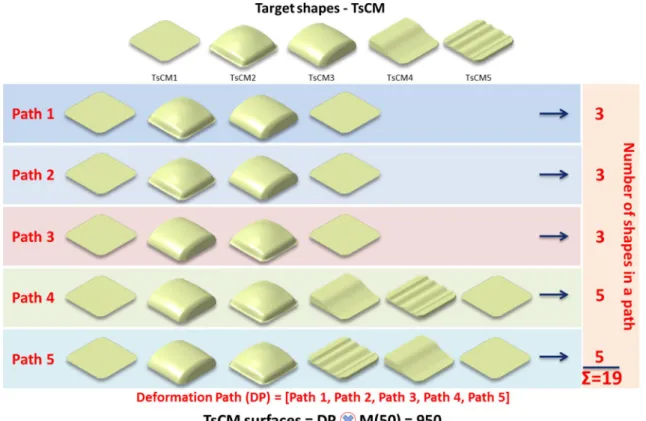
modifications of the initial surface are performed following a so-called deformation path (DP) defined by the sequence of Ts. This sequence is followed by a morphing (M) operator which generates many instances between the Ts. The objec-tive of each DP is to obtain a wide range of possible shapes covering as much as possible variations of their geometric properties in order to understand how they affect the percep-tion of flatness. The aim is to understand how a shape can be modified within the same class or to change the class. One path can be composed of few or all Ts ordered in a different sequence. The complete DP of ordered shapes is the col-lection of all paths together. For example, considering the coffee machine, the final DP gathers together all the defined 5 paths of shapes having TsCM1 as a starting and ending Ts (Fig. 3). Considering all the paths, 19 transitions between the Ts has been obtained. The 50 morphed surfaces have been generated between two consecutive Ts create the TsCM set of 950 surfaces for the coffee machine. Similarly, DPs have been defined for the other two spaces of shapes (TsCB and TsCD) for the car back and car door, and the corresponding IDSs have been generated.
The two first paths, i.e. Path 1 and Path 2, are voluntarily the same. Such a repetition at the beginning of each sub-set is relevant to address the “learning phase” of the inter-view. After completing the interview with all participants, the instances corresponding to Path 1 are removed from the
dataset IDS before applying MLTs. To investigate the human classification consistency and the effect of surface presen-tation ordering in the classification, the same sequence of instances is repeated and inverted several times.
4.2.2 Definition of the surface surrounding
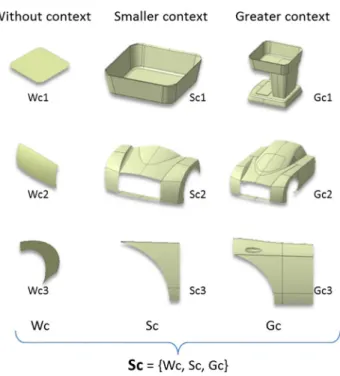
Beside the investigation of the existence of a common judg-ment for the flatness, we are also interested in understanding if It Is valid in absolute terms, or if It Is affected by the ele-ments neighboring the classified shape. Intuitively, looking at some shape areas, trying to judge or describe it, the eye not only focuses on the surface but (often subconsciously) it also moves on the nearest surroundings and returns back. This suggests that the perception of flatness for a given area might be affected by the surrounding. To investigate Its influence, we included in the IDS also instances corre-sponding to the previous 950 surfaces inserted in different contexts. In particular, we considered two different extension of the neighbor shapes (Fig. 4).
4.2.3 Generation of the complete IDS
The same approach described for the coffee machine has been adopted for the car back and car door considering the two sets of Ts (TsCB and TsCD) as described on Fig. 2.
Thus, three sets of 950 surfaces are generated, i.e. a total of 2850 surfaces. Then placing the three sets in the three previously introduced surroundings (Fig. 4), the complete IDS has been created containing 8550 instances (i.e. 2850 for Wc, for Sc and for Gc).
However, since it can be difficult to manage such a huge dataset during the classification process, it has been divided it into smaller sets. Therefore, we decided to maintain the division according to the specific paths (Ts) and contexts (Sc) creating 3 × 3 = 9 sets of surfaces. These 9 sets are ran-domly ordered. The same sequence is presented to all par-ticipants in order to maintain the same experimental condi-tions. This reordering is very important for guaranteeing that the participants classify the surface according to their actual not biased impression.
4.3 Definition of the surface parameters/attributes using intrinsic geometric quantities
In the proposed approach, we use MLTs to understand the rules linking the classification of free form surfaces, i.e. the level of flatness in the present case, to the free form surfaces themselves. However, MLTs cannot directly work on free form surfaces. Thus, a preprocessing step is performed in Matlab extracting the geometric attributes we think appro-priate to characterize the classified free form shapes (left pillar in Fig. 1).
Two sets of geometric quantities have been specified. The first set represents the geometric quantities related to
the surface to be classified (Fig. 5; Table 1) whereas the second set includes those related to the surrounding (Fig. 6; Table 2).
As discussed in [24], the use of size independent geomet-ric attributes to obtain classification models independent on the size of the geometric entities (curves and surfaces) is necessary. A common way of obtaining size independent parameters is to define ratios between two geometric quanti-ties or two groups of geometric quantiquanti-ties of identical nature (dimension). Thus, 36 surfaces parameters (R1–R36) have been defined (see Table 3) using the geometric quantities of surfaces listed in Tables 1 and 2.
Even if we tried to be quite exhaustive, knowing that MLTs identify the most important parameters, it is clear that this list is a subset of the possible surface parameters. Some of them have been chosen because they are extension of the geometric quantities for straightness of curves to geometric quantities for flatness of surfaces. Differently from curves, we included parameters to characterize the surrounding and its influence over the perception of flatness.
4.4 Fast classification of surfaces with dedicated GUI
The third element of the framework and the right pillar of the temple is the classification of all the instances (Fig. 1) of the IDS through interviews. The classification classes of flatness needed to be defined. When defining classification classes, two aspects are important: (1) the number of classes, and (2) the naming of the classes. The former aspect refers to how to determine the most optimal number of classifica-tion classes. The number of classes has to guarantee a suf-ficiently accurate and understandable classification. Then, four classes have been considered. The naming, which has to be intuitive to the layperson’s perceptions, avoiding the use of geometrical or mathematical terms. Thus, we opted
Fig. 4 Considered surroundings for the three spaces of shapes
four quantitative judgments of flatness: Flat, Almost Flat, Not Flat, and Very Not Flat.
Considering that it is not reasonable to ask to classify the 8550 instances one by one, a Guiding User Interface (GUI) has been created in Matlab to fasten the classification. It allows the user to classify surfaces in a very intuitive and
simple way, i.e. by only moving a slider for changing shapes and clicking buttons for assigning flatness class.
The human classification has been conducted by interviewing 65 participants from three different coun-tries (France, Italy, and Macedonia) and with different backgrounds (engineers, mathematicians, students, PhD candidates, researchers). The average time for classifying the entire IDS varies from 20 to 60 min.
Table 1 Geometric quantities of a shape and associated bounding box As—Surface area
Ap—Area of the surface projection on the biggest face of the minimum bounding box Vs—Volume between the surface and its projection on the same plane as Ap V—Volume of the minimum bounding box of the surface
A1—The area of the biggest face of the minimum bounding box A2—The area of the second biggest face of the minimum bounding box A3—The area of the smallest face of the bounding box
D—Diagonal of the minimum bounding box E1—The longest edge of the minimum bounding box E2—The second longest edge of the minimum bounding box E3—The shortest edge of the minimum bounding box Na—Average normal of the surface ( 1p
∑p
1Nai ), where p the number of the surface discretization points and Nai is the normal value on the ith
point on the surface Mc—Mean curvature ( 1p
∑p
1Hi ), where p is the number of the surface discretization points and Hi is the mean curvature value on the i-th point
on the surface
Gc—Gaussian curvature ( 1p
∑p
1Ki ), where p is the number of the surface discretization points and Ki is the Gaussian curvature value on the ith
point on the surface Ac—Absolute curvature ( 1p
∑p
1Ai ), where p is the number of the surface discretization points and Ai is the absolute curvature value on the ith
point on the surface
Rp—Radius of a sphere that has same area as Ap (Rp = √
Ap
4π) Rs—Radius of a sphere that has same area as As (Rs =
√ As
4π)
Np—Number of points on the surface with positive Gaussian curvature Nn—Number of points on the surface with negative Gaussian curvature Nz—Number of points on the surface with zero Gaussian curvature
N—Number of points on the surface for which the Gaussian curvature is computed, N = Np + Nn + Nz
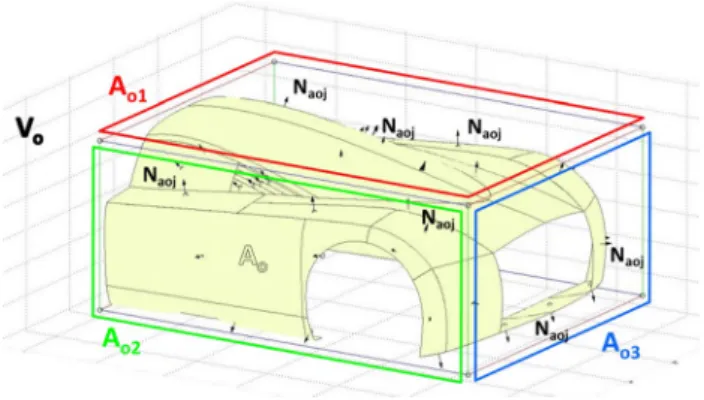
Fig. 6 Geometric quantities related to the surrounding
Table 2 Geometric quantities related to the surrounding Vo—Volume of the bounding box of the object Ao—Total area of the object
Ao1—Area of the biggest face of the object bounding box Ao2—Area of the second biggest face of the object bounding box Ao3—Area of the smallest face of the object bounding box Nao—Average normal of a surrounding surface patch in the object
( 1
p
∑p
1Naoi), where p is the number of the surface patches
discre-tization points and Naoi is the normal value on the ith point on the
Table 3 Surface attributes built on top of the basic geometric quantities
Ratio between the surface area As and its projection Ap R1 = As
Ap
Ratio between the surface volume Vs and bounding box volume V R2 = Vs
V Ratio between the longest edge E1 and the diagonal D of the bounding box R3 = E1
D Ratio between the second longest edge E2 and the diagonal D of the bounding box R4 = E2
D Ratio between the smallest edge E3 and the diagonal D of the bounding box R5 = E3
D Ratio between the dimensions of the bounding box R6 = E2
E1
R7 = EE32
R8 = EE31
Ratio between the areas of the planes of the bounding box R9 = A2
A1
R10 = A3
A2
R11 = AA31
Ratio between the planes areas (A1, A2, A3) and the area of the bounding box R12 = A1
A1+A2+A3
R13 = A1+AA22+A3
R14 = A1+AA32+A3
Multiplication of the mean curvature with the radius Rp of a sphere that has same area as the surface projection area (Ap)
R15 = Mc * Rp Multiplication of the mean curvature with the radius Rs of a sphere that has same area as the
surface area (As)
R16 = Mc * Rs Multiplication of the mean curvature with the ratio between the surface volume Vs and the surface
projection area Ap R17 = Mc
Vs
Ap
Multiplication of the mean curvature with the ratio between the surface volume Vs and the surface area As
R18 = McVAss
Multiplication of the Gaussian curvature and the surface projection area Ap R19 = Gc * Ap Multiplication of the Gaussian curvature and the surface area As R20 = Gc * As Multiplication of the absolute curvature with the Radius Rp of a sphere that has same area as the
surface projection area Ap
R21 = Ac * Rp Multiplication of the absolute curvature with the radius Rs of a sphere that has same area as the
surface area As
R22 = Ac * Rs Multiplication of the absolute curvature with the ratio between the surface volume Vs and the
surface projection area Ap
R23 = AcAVsp
Multiplication of the absolute curvature with the ratio between the surface volume Vs and the
surface area As R24 = Ac Vs As Positive curvature R25 = Np N Negative curvature R26 = Nn N Zero curvature R27 = Nz N Average normal R28 = √X2+Y2+Z2 X =1 p ∑p 1Xai, Y = 1 p ∑p 1Yai, Z =1 p ∑p 1Zai Nai=(Xai, Yai, Zai) Ratio between the surface area and the area of the objects R29 = As
Ao+As
Ratio between surface and object bounding box volumes R30 = VoV+V
Ratio between surface volume and object bounding box volume R31 = Vs
Vo+Vs
Ratio between the smallest plane of the surface MBB (A3) and the plane of the object BB parallel
to it (Ao1) R32 =
A3
Ao1+A3
Ratio between the second biggest plane of the surface MBB (A2) and the plane of the object BB parallel to it (Ao2)
5 Experiments
Before detailing the studies which have been designed to answer our questions, the adopted methods are first introduced.
5.1 Grouping instances of the IDS
Depending on the considered question the elements in the IDS (Fig. 7) are better suited than others. The entire IDS, without grouping is used for the first and fourth study. In
order to answer question 2 (second study), the IDS has been grouped by context in three groups: 1. Without con-text (Set of surfaces 1, 3 and 8), 2. Smaller concon-text (Set of surfaces 4, 5 and 7) and 3. Greater context (Set of surfaces 2, 6 and 9). Next, to answer question 3 (third study), the IDS has been grouped by object in three groups: 1. Car door (Set of surfaces 5, 8 and 9), 2. Car back (Set of sur-faces 3, 6 and 7) and 3. Coffee machine (Set of sursur-faces 1, 8 and 4).
Table 3 (continued)
Ratio between the biggest plane of the surface MBB (A1) and the plane of the object MBB parallel to it (Ao3)
R34 = A1
Ao3+A1
Ratio between the diagonal of the surface bounding box D and the diagonal of object bounding
box R35 =
D Do+D
Distribution of the surrounding normal with respect to the target surface normal
R36=1 k k ∑ j=1 dot(Na,Naoj) �Na��Naoj�
Na—average normal of a target surface Nao—average normal of a surrounding patch
k—number of patches in the surrounding
5.2 Identifying the most suitable learning algorithm
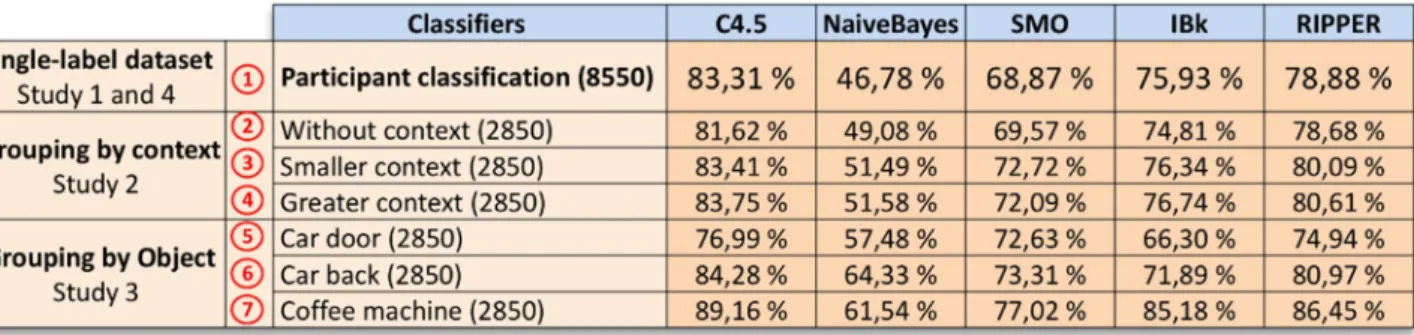
There exists a huge amount of learning algorithms (classifi-ers) which all have their own characteristics and capabilities to solve specific problems. To identify what could be consid-ered as the best classifier in our context, the seven groups of classified instances introduced in Sect. 5.1 have been tested with five classifiers: classification tree (C4.5), Naïve Bayes (NaiveBayes), support vector machine (SMO), k-Nearest Neighbors (IBk) and classification rules (RIPPER).
There exist two ways to provide the testing set for the evaluation of the classifiers: internal and external provi-sions. In our application, the Internal provision of testing set is more suitable than external (there is no another set of surfaces to be used as testing set). Practically, multiple experiments have shown that tenfolds cross-validation gives the best estimation of error [14]. Thus, the cross-validation strategy can be used to compare the performances of differ-ent predictive modeling tasks.
For example, using the 8550 instances classified by the 65 participants, and using the classifier C4.5 for each partici-pant separately with tenfolds cross-validation, we obtained 65 percentages whose average is equal to 83.31%. The same applies for the other groups and classifiers. The results are shown in Fig. 8. The percentages of all participants are aver-aged to obtain a single estimation in order to compare the different classifier. At the end, the C4.5 classifiers appear to be the best. As a consequence, only this algorithm will be used for the next experiments.
5.3 Handling multi‑label classifications
Since the basic learning techniques can deal only with single-labeled classification problems, a method for trans-forming multiple-label classification problems into single-label classification problems has to be applied. The prob-lem of dealing with multiple labeled datasets of instances can be solved in two ways: (1) replacing the multi-labeled
classification with single-labeled classification by using the majority voting principle [25, 26], and (2) application of Problem Transformation [15] methods. In this work, the majority voting principle has been used. Indeed, each par-ticipant may have a different perception of the flatness of each shape. The use of the majority voting principle results in extracting a single-labeled classification, i.e. a general classification. The procedure for extracting a general clas-sification is explained in the following. For instance, if a surface has been classified as flat by more than 33 out of 65 participants, then this class is chosen as the final surface class.
However, following this principle, some instances remain unclassified. Having continuous modification of the shapes means that if the surface k is classified as class1 and surface k + 2 is classified in class2 then the surface in between the two (i.e. surface k + 1) must belong either to class1 or class2. Therefore, if surface k + 1 cannot be associated to a class by the majority of participants, then this surface will be clas-sified same class as the class of the neighboring surfaces (k and k + 2) that have higher number of votes.
In the next studies, both comparisons approaches have been applied and are further discussed. The first approach consists in comparing the human classification of all partici-pants with respect to a given reference classification which, in this case, is the general classification. This approach is called referential comparisons. The second approach con-sists in carrying out n * (n − 1) mutual comparison between the individual classifications. The idea is to find out the most shared classification for each surface. By doing this, we want to examine whether the classification rules that one person has followed are also recognized and shared by the others. This second approach is called mutual comparisons. These approaches will be exemplified in the next subsection.
5.4 Study 1: Is there a common perception of flatness?
For this study, the 8550 instances of group 1 are used. These two approaches are discussed in the next subsections
together with their practical application to answer the first question.
5.4.1 Approach 1: Use of referential comparisons
This approach consists in first extracting a general classifi-cation model and then testing it with the human classifica-tion of the interviewees to estimate how representative such general classification is. In this case, the dataset of surfaces classified according to the general classification is used to train a classifier, and then the trained classifier is tested with the dataset classified by the interviewees. As discussed in Sect. 5.2, the learning algorithm C4.5 (classification tree) has been used to train the classifier.
The classification accuracy varies from 38.3 to 71.7% and the average accuracy of all 65 participants is 52.7%. The classification accuracy of the first 33 (majority) participants varies from 52.3 to 71.7%. This means that the majority of the participant’s agreement between the human classifica-tions and the general classification is greater than 50%, i.e. there is an agreement for more than half of the instances.
By using the referential comparison, we can conclude that the perception of flatness is shared by the majority of the participants, i.e. there is a common perception of flatness.
5.4.2 Approach 2: Use of mutual comparisons
To understand if the classification rules followed by a per-son are also shared by the others, a mutual compariper-son is carried out by using the classification of each participant to train a classifier (still using C4.5 classification tree), then the obtained classifier is tested using the classifications of the other 64 participants and finally the results of the testing are used for the comparison. This process is repeated for the 64 other participants.
Overall, the average accuracy for the classifier of partici-pant 1 applied on the other 64 participartici-pants is 48.4%. The
average accuracy of the machine classification model for a participant can be considered as an overall measure for the “level of shareability” of the classification for this partici-pant. The average classification accuracy for each the ticipants varies from 34 to 49.2% and the average of all par-ticipants classification accuracy is 42.1%. This classification accuracy is obtained by averaging the classification accura-cies of all participants when the classifier trained using the classification of participant k is tested by the classification of the other (n − 1) participants.
The average individual agreements between n * (n − 1) mutual comparisons is lower than 50%. This means that there is no agreement over the majority of instances and no classification is shared by the other human classifica-tions. By using the mutual comparisons, it can be concluded that not one single classification can be distinguished to be shared by the majority of participants.
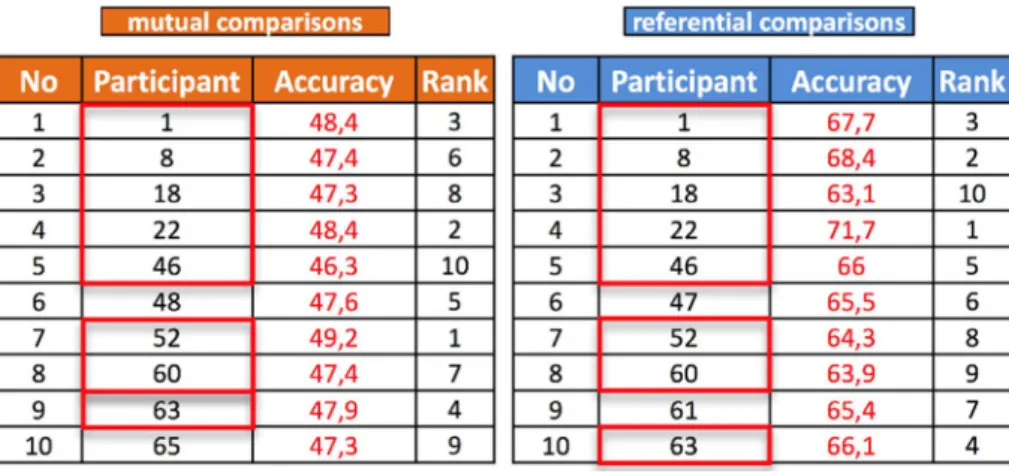
Finally, the Fig. 9 highlights the ten top-ranked classi-fications when following the two approaches, i.e. the com-parisons to a general classification in approach 1 and the n(n − 1) mutual comparisons in approach 2. Here, one can notice that 8 classifications are in the 10 top-ranked classi-fications of the two approaches, thus there is a large overlap (80%). As a conclusion, the general classification can be considered as relevant to express a common perception of flatness. Furthermore, considering that the n(n − 1) mutual comparisons indicate how much provided classifications are recognized by the others, they can also help in defining the relevant attributes (see study 4 in Sect. 5.7).
5.5 Study 2: Is the amount of available surrounding information influencing the perception
of flatness?
The main hypothesis which has driven the reasoning is: if the surrounding does not affect the perception of flatness, then the participants will follow the same classification rules for the same surfaces regardless the surrounding.
Fig. 9 Parallel between the ten top-ranked classifications when using the mutual comparisons (left) and comparisons to a general classification (right)
In order to investigate the influence of the surrounding, the general classification was divided into three groups regarding the size of the context. Next, classification models for each of the group was created and testes with the corre-sponding classification of each participant. The classification accuracy for the group without context varies from 30.1 to 71.7% and the average accuracy is 51.4%. The classification accuracy for the group with smaller context varies from 33.1 to 72.1% and the average accuracy is 52.2%. The classifica-tion accuracy for the group with greater context varies from 30 to 74.5% and the average accuracy is 54.3%. Although the difference is very small (2.9%), such an ordering of the accu-racies confirms our hypothesis that the surrounding context influences the perception of flatness. Actually, the amount of surrounding information is correlated to the strength and consistency of the classification among individuals.
Following the second approach, i.e. using n(n − 1) mutual comparisons, the same order of the classification accuracy is obtained, the average classification accuracy, for the accu-racies obtained when the classifiers trained on the group without context is tested with the corresponding group of the other 64 participant, is 86.51%. the corresponding accuracies for the group with smaller and greater context are 88.26% and 88.67%. Although the difference is small (2.16%), the returning ordering validate what has been also conclude with the approach 1 i.e. by increasing the context the perception of flatness became more stable.
5.6 Study 3: Is the surrounding context influencing the perception of flatness?
In this study, the idea is to analyze whether not only the amount but also the type of surrounding influences the per-ception of flatness. For instance, for a given object (e.g. cof-fee machine), when a participant classifies a set of surfaces with a different amount of surrounding, he/she intuitively follows classification rules. However, these rules might differ from those he/she follows when classifying surfaces belonging to other shape environments and objects (e.g. car door and car back).
In order to investigate the influence of the object, the general classification was divided into three groups
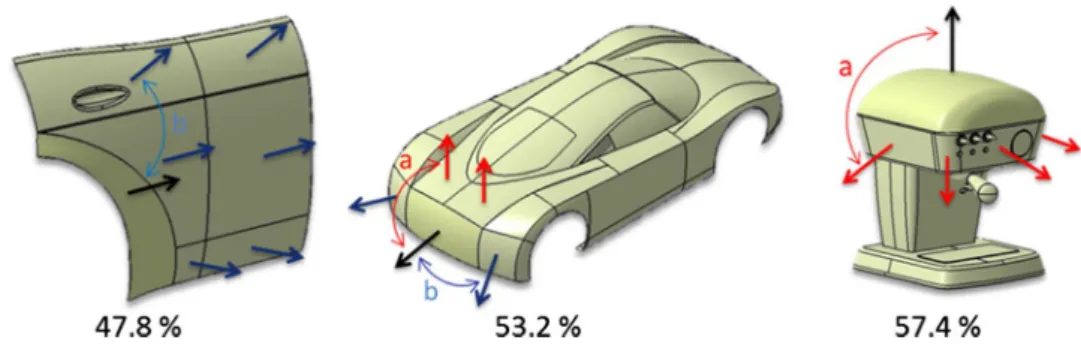
regarding the type of object (coffee machine, car door and car back). Next, classification models for each of the group was created and testes with the corresponding classifica-tion of each participant. The classificaclassifica-tion accuracy for the group coffee machine varies from 27.9 to 75.7% and the average accuracy is 57.4%. The classification accuracy for the group car back varies from 25.6 to 81.5% and the average accuracy is 53.2%. The classification accuracy for the group car door varies from 25.1 to 71.5% and the aver-age accuracy is 47.8%. There is a quite large difference between the average accuracies for the car door (47.8%) and the coffee machine (57.4%). Unlike in study 2, the dif-ference between the car door and the coffee machine group of instances is 9.6%, which means that the influence of the type of surrounding is more significant.
Following the approach 2, i.e. using n(n − 1) mutual comparisons, similar results can be observed. The average classification accuracy, for the accuracies obtained when the classifiers trained on the group coffee machine is tested with the corresponding group of the other 64 participant, is 93.16%. The corresponding accuracies for the group car back and car door are 89.53% and 81.79%. Similarly to the first approach, the difference between the car door and the coffee machine group of instances is 11.37%, which means that the influence of the type of surrounding is more significant.
Finally, the results obtained when applying the two analy-sis approaches are conanaly-sistent and validate that the type of surrounding influences the perception of flatness. When comparing the three types of surrounding contexts, it clearly appears that the sharper the transition is, the more accurate the trained classifiers is. That Is, participants more consist-ently classify the surfaces when they are surrounded by sur-faces connected with sharp edges (Fig. 10).
After completing the first three studies, an intermediate conclusion can be sketched. There is a common perception of flatness by the majority over the majority of instances (study 1). This perception consistency is not strongly affected by the amount of available surrounding informa-tion (study 2), and not strongly affected by the type of the surrounding context (study 3).
Fig. 10 Influence of the sharp-ness on the accuracy of the classifiers
5.7 Study 4: What are the most relevant
geometric parameters which best characterize the flatness?
This study uses the proposed framework to extract the most meaningful geometric parameters to characterize the flatness property. Finding out the most relevant parameters allows their use in determining an appropriate measure of a given aesthetic property.
5.7.1 Most relevant geometric parameters identification
To solve the problem of identifying which surface param-eters (among the 36 paramparam-eters introduced in Sect. 4.3) best characterize the flatness property, the Attribute Selection (AS) approach has been adopted. The aim of AS is to find the smallest subset of features that are highly correlated with the learning model, thus improving its learning performance. In this case, the CfsSubsetEval evaluation algorithm is used, and then BestFirst search algorithm is applied to propose a subset of attributes.
The AS method is applied to the classification of all 65 participants obtaining 65 subsets of parameters. Then, the most recurring ones have been identified by counting the number of times that parameters appear. From the results, only four parameters (1, 2, 4 and 28, Table 3) have been selected for the majority i.e. the surface parameters selected by the AS more than 32 times. Additionally, there are param-eters (parameter 17 and 36) occurring 31 times (which is only two less than the majority) while parameters 25 and 27 were selected as relevant 21 and 20 times, respectively. This means parameters 17 and 36 could also be possibly relevant and cannot be omitted without additional testing.
Since the general classification represents (in some way) the classification of all participants, the same AS algorithms are applied over it identifying a set of parameters {1, 2, 4, 8, 17, 28, 36}. By analyzing the results, it can be concluded that also parameters 17, 36, and 8 are important. Parameter 8 can be omitted because it is selected 19 times which is much far away from the majority principle.
Finally, the list of most relevant parameter is as follow: 1. Parameter 1 (As/Ap)
2. Parameter 2 (Vs/V) 3. Parameter 4 (E2/D) 4. Parameter 17 (Mc * Vs/Ap) 5. Parameter 28 (|Na|)
6. Parameter 36 (distribution of the normal)
5.7.2 Discussion
Analyzing the list of most relevant parameters, two subsets of parameters can be distinguished. The first subset consists
of parameters 1, 2, and 17, and the second subset consists parameters 4, 28, and 36.
From the first list, it is clearly demonstrated that the sur-face flatness can be considered as an extension in 3D space of the curve straightness. Therefore, it is natural to expect that the extension in 3D space of the geometric quantities of curves appear in the list of most relevant surface param-eters. Actually, the revised measure of straightness proposed by [27] makes use of intrinsic geometric quantities like its length (L), area (A), curvature (C), and cord length (l). Clearly, the length of the curve (L) can be mapped to the sur-face area (As) in the 3D space. The area (A) in the measure of straightness can be mapped to the volume (Vs) between the surface and a plane (one of the minimum bounding box planes). The cord length (l) between the curve end points can be seen as the area (Ap) of the region obtained by projecting the surface onto a reference plane. Lastly, as for curves for which at a given point there is only one value of the curva-ture (C), for free form surface Mean (Mc) curvacurva-tures at the surface points appear important.
The second list of parameters consists of two surface parameters (4 and 28) still related to the analyzed surface, and one parameter (36) related to the surrounding. Thus, the adopted AS algorithm also confirms that the surround-ing information also affects the flatness property judgment.
6 Conclusion and future works
This paper addresses the verification of a common percep-tion and judgment of a specific surface shape property, the so-called flatness, together with the identification of the con-cerned shape characteristics.
This is performed through the set up and use of a gen-eral framework exploiting MLTs for the detection of hidden classification rules and the selection of the most prominent involved parameters. The instances have been generated using a new morphing process, and they have been classi-fied using a dedicate environment for fast classification of shapes. The most relevant surface geometric quantities have also been identified and validated through a comparison with what was already known for free form curves. Consider-ing that the surface shape perception can be affected by its surrounding (adjacent shape behavior and extension) and context (object in which the surface is inserted), surfaces in different types of objects and with different types and exten-sions of the neighboring surfaces have been considered. The results obtained, even if promising, are indicating some dif-ferences in the perception of flatness quality. Additionally, it resulted that considering the flatness of a surface embedded in a shape reduces these differences, and in particular, the differences diminish when increasing the extension of the surrounding shape and the shape differentiation between the
surface and the surrounding. This aspect is important since in the foreseen modelling scenario, the user should modify a part of the object and not a single surface out of its context, thus more generally valid rules can be determined. Even if we considered a large number of surfaces, additional tests should be carried out with additional surfaces and contexts (surrounding shapes and products) to confirm the prediction capabilities of the detected rules and of the importance of the extracted geometric properties. Future work would also include the consideration of geometric properties more dis-tributed along the surface to detect other possible significant parameters for the flatness characterization.
The proposed framework can be used within a virtual reality environment in order to best experience it and allow for interactive design of shapes. Coupled with a surface deformation tool, the classification model learnt from the training phase can be used in closed loops deformation-eval-uation in order to converge more rapidly towards the shape which best fits the designer’s requirements.
The same framework can also be applied for mapping other aesthetic properties as tension, convexity. In general, the proposed framework can be used as a guided path for identifying a mapping between different semantics and free form shapes. An alternative use of the framework is the application of unsupervised learning algorithms (e.g. clus-tering) replacing the supervised learning algorithms. This alternative use can help in clustering the IDS and the attrib-utes in order to find the same internal correlation between instances. Finally, the framework is very generic and can be applied in other research fields.
References
1. Nagamachi, M.: Kansei/Affective Engineering. CRC Press, Boca Raton (2011)
2. Giannini, F., Monti, M.: A survey of tools for understanding and exploiting the link between shape and emotion in product design. In: Proceedings of the TMCE 2010, Ancona, Italy (2010) 3. FIORES-II: Character Preservation and Modeling in Aesthetic
and Engineering Design, Project N: GRD1-1999-10385 (2000).
http://www.fiore s.com/. Accessed May 2014
4. Wiegers, T., Wang, C., Vergeest, S.J.: Shape terms in different languages. In: Fifth International Conference on Natural Compu-tation, Tianjin, China (2009)
5. Kassimi, M.A., Beqqali, O.E.: 3D model classification and retrieval based on semantic and ontology. Int. J. Comput. Sci. Issues 8(5), 1–7 (2011)
6. Lian, Z., Rosin, P.L., Sun, X.: Rectilinearity of 3D meshes. Int. J. Comput. Vis. 89, 130–151 (2010)
7. Talton, O.J., Gibson, D., Yang, L., Hanrahan, P., Koltun, V.: Exploratory modeling with collaborative design spaces. ACM Trans. Graph. 5, 167 (2009)
8. Orsborn, S., Cagan, J., Boatwright, P.: Quantifying aesthetic form preference in a utility function. J. Mech. Des. 131, 061001 (2009) 9. Burnap, A., Pan, Y., Liu, Y., Ren, Y., Lee, H., Gonzalez, R., Papalambros, Y.P.: Improving design preference prediction accu-racy using feature learning. J. Mech. Des. 138, 071404 (2016) 10. MacDonald, E.F., Gonzalez, R., Papalambros, P.: The construction
of preference for crux and sentinel product attributes. J. Eng. Des.
20, 609–626 (2009)
11. Yumer, M.E., Chaudhuri, S., Hodgins, J.K., Kara, L.B.: Semantic shape editing using deformation handles. ACM Trans. Graph. 34, 86 (2015)
12. Xu, K., Kim, G.V., Huang, Q., Kalogerakis, E.: Data-driven shape analysis and processing. Comput. Graph. Forum 36, 1–27 (2015) 13. Waikato, U.O.: “WEKA,”. http://www.cs.waika to.ac.nz/ml/weka/.
Accessed 31 May 2015
14. Witten, H.I., Frank, E., Hall, A.M.: Data Mining—Practical Machine Learning Tools and Techniques. Elsevier Inc., Burling-ton (2011)
15. Read, J.: Scalable multi-label classification. Ph.D. thesis, Depart-ment of Computer Science, University of Waikato, Hamilton (2010)
16. Read, J., Pfahringer, B., Holmes, G.F.E.: Classifier chains for multi-label classification. Mach. Learn. 85, 333–359 (2011) 17. Tsoumakas, G., Katakis, I.: Multi-label classification: an
over-view. Int. J. Data Wareh. Min. 3, 1–13 (2007)
18. Quinlan, R.: C4.5: Programs for Machine Learning. Morgan Kauf-mann Publishers, San Mateo (1993)
19. George, J.H., Langley, P.: Estimating continuous distributions in Bayesian classifiers. In: 11th Conference on Uncertainty in Arti-ficial Intelligence, San Mateo, CA (1995)
20. Tan, P.-N., Steinbach, M., Kumar, V.: Introduction to Data Min-ing. Addison-Wesley, Reading (2006)
21. Vladimir, V.: The Nature of Statistical Learning Theory. Springer, New York (1995)
22. Cohen, W.W.: Fast effective rule induction. In: Machine Learning: Proceeding of the Twelfth International Conference, Lake Tahoe, CA (1995)
23. Giannini, F., Monti, M., Podehl, G.: Aesthetic-driven tools for industrial design. J. Eng. Des. 17(3), 193–215 (2006)
24. Petrov, A., Pernot, J.-P., Véron, P., Giannini, F., Falcidieno, B.: Aesthetic-oriented classification of 2D free-form curves. In: Tools and Methods for Competitive Engineering—TMCE 2014, Buda-pest, Hungary (2014)
25. Lam, L., Suen, Y.C.: Application of majority voting to pattern recognition: an analysis of its behavior and performance. IEEE Trans. Syst. Man Cybern. Part A Syst. Hum. 27, 553–568 (1997) 26. Kitter, J., Hatef, M., Duin, P.W.R., Matas, J.: On combining classi-fiers. IEEE Trans. Pattern Anal. Mach. Intell. 20, 226–239 (1998) 27. Giannini, F., Montani, E., Monti, M., Pernot, J.-P.: Semantic evaluation and deformation of curves based on aesthetic criteria. Comput.-Aided Des. Appl. 8(3), 449–464 (2011)
Publisher’s Note Springer Nature remains neutral with regard to jurisdictional claims in published maps and institutional affiliations.