HAL Id: tel-03118446
https://pastel.archives-ouvertes.fr/tel-03118446
Submitted on 22 Jan 2021HAL is a multi-disciplinary open access
archive for the deposit and dissemination of sci-entific research documents, whether they are pub-lished or not. The documents may come from teaching and research institutions in France or abroad, or from public or private research centers.
L’archive ouverte pluridisciplinaire HAL, est destinée au dépôt et à la diffusion de documents scientifiques de niveau recherche, publiés ou non, émanant des établissements d’enseignement et de recherche français ou étrangers, des laboratoires publics ou privés.
Controlled Solid-Vapour CO2 phase transitions in
methane rich streams applied to biogas upgrading
Sylvain Haddad
To cite this version:
Sylvain Haddad. Controlled Solid-Vapour CO2 phase transitions in methane rich streams applied to biogas upgrading. Chemical and Process Engineering. Université Paris sciences et lettres, 2019. English. �NNT : 2019PSLEM069�. �tel-03118446�
1
Etude des transitions contrôlées entre phases
Solide-Vapeur de CO
2à partir d’un écoulement contenant du
méthane en vue de l’épuration du biogaz.
Controlled Solid-Vapour CO
2phase transitions in
methane rich streams applied to biogas upgrading
Soutenue par
Sylvain HADDAD
Le 17 décembre 2019
Ecole doctorale n° 621
Ingénierie des systèmes,
matériaux, mécanique
énergétique
SpécialitéÉnergétiques et procédés
Composition du jury : Daniel BROSETAProfesseur, Université de Pau Président
Carolina FONT PALMA
Senior Lecturer, University of Chester Rapporteur
Isabelle MABILLE
Maître de conférences, HDR, Sorbonne Université Rapporteur
Jean-Philippe PASSARELLO
Professeur, Université Paris 13 Examinateur
Rodrigo RIVERA-TINOCO
Chargé de Recherche, MINES ParisTech Examinateur
Chakib BOUALLOU
Professeur, MINES ParisTech Directeur de thèse
Confidentielle
3
Acknowledgements
First, I would like to express my sincere gratitude to my PhD supervisor Dr. Rodrigo Rivera-Tinoco who guided me and mentored me during my 3 years of PhD work. I thank him for his constant encouragement and the time he invested in order to finish this work even when it seemed like an impossible task.
I would like to thank my PhD Director Pr. Chakib Bouallou, his involvement was a major contributor to the completion of this work. I am really grateful for his advices and help especially in the third (and most difficult) year.
I also would like to thank Dr. Maroun Nemer, the director of the CES. He gave me the opportunity to start this PhD and helped me, however indirectly, to finish it too.
I would like to thank the members of the jury Pr. Jean-Philippe PASSARELLO, Dr. Isabelle MABILLE, Dr. Carolina FONT PALMA, Pr. Daniel BROSETA who accepted to invest time for reading this work and providing interesting and constructive feedback which was much appreciated
Also, I extend my thanks to the members of Mines ParisTech CES “Centre Efficacité Energétique des Systèmes”: the PhD students, researchers, trainees and the administrative staff for creating a good working atmosphere. I would like to thank Florent for the advices and guidance in the start of this thesis. I especially thank Rony, Rachelle, Luca, Afif, Samer, Hussein, Joe, Franck, Assaad, Christina, Hala, Boutros… for the discussions we had and the good times we spent together. And a more particular thank you to Haytham and Rami for their support, encouragement, help and time when things were really complicated.
I would like to thank all my friends outside work whom I consider my family in France. A special thanks to Eliane without whom this work would not have been completed. Her constant support and her “being there” got me through the hard times.
Of course, last but not least, I would like to thank all my family in Lebanon especially my parents Milad and Hoda, my sister Sarah and my brother Etienne. They were always there for me for encouragement and support. I am really grateful for their presence in my life.
This thesis is dedicated to my mother Hoda who is currently fighting one of life’s hardest fights. I thought my PhD was difficult to finish but she was my encouragement and my role model on how to surpass any obstacle in life. My problems were diminished by her suffering which she is facing with the highest moral, the strongest heart and the largest smile. Thank you mom and I hope that you are proud and as I always say :” This Too Shall Pass”.
4
Table of Contents
Introduction ... 14
Chapter 1: State of the art on CO2 removal and evaporative cooling methods ... 18
Introduction ... 18
1.1 Biogas as a renewable energy... 19
1.1.1 From raw biogas to injection of biomethane into the natural gas grid ... 20
1.1.2 Biogas composition ... 20
1.1.3 Methanisation (Anaerobic digestion) ... 21
1.1.4 Biomethane valorisation ... 22
1.2. Carbon dioxide removal techniques ... 23
1.2.1. Water Scrubbing ... 24
1.2.2. Chemical absorption using alkaline aqueous solutions ... 25
1.2.3. Membrane separation ... 26
1.2.4. Pressure Swing Adsorption ... 27
1.2.5. Cryogenic techniques for removal of CO2... 28
1.2.6. Comparison between different biogas upgrading technologies ... 34
1.3. Evaporative cooling ... 36
1.3.1. Evaporative Cooling: General concept ... 36
1.3.2. Evaporative Cooling in cooling towers ... 38
1.3.3. Cooling by sublimation ... 40
1.4. Discussion and framework for this thesis ... 41
1.4.1. A new concept of cryogenic CO2 separation with cold recovery using controlled evaporation ... 41
1.4.2. CO2 frosting ... 42
1.4.3. CO2 controlled evaporation ... 42
1.4.4. Scientific objectives of this thesis ... 43
Chapter 2: Modelling of CO2 deposition from a gas phase ... 54
Introduction ... 54
2.1. Psychrometry of frost formation ... 55
2.2. Frost formation mechanism ... 55
2.3. CO2 deposition modelling ... 56
2.3.1. Main assumptions ... 57
5
2.4. Density of new frost layer formed ... 61
2.5. Thermophysical properties ... 62
2.5.1. Solid carbon dioxide density ... 62
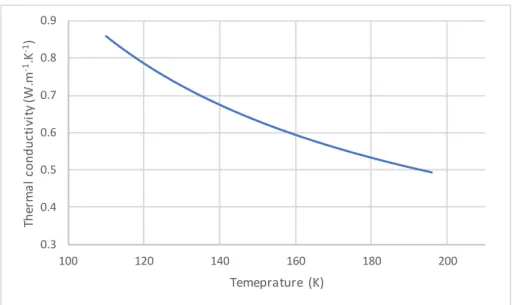
2.5.2. Thermal conductivity of solid CO2 and CO2 frost ... 62
2.5.3. Diffusion resistance in porous medium ... 64
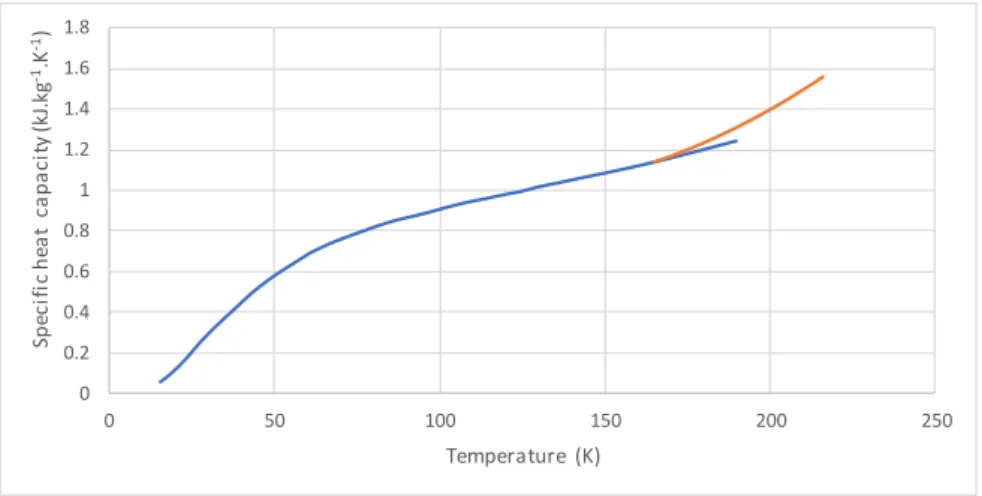
2.5.4. Heat capacity of solid CO2 ... 65
2.5.5. Enthalpy of CO2 at cryogenic temperature ... 65
2.5.6. Entropy of solid CO2 ... 66
2.5.7. CO2 sublimation pressure ... 67
2.5.8. Sublimation Heat ... 68
2.6. Properties of binary gas mixtures ... 69
2.6.1. Viscosity and conductivity ... 69
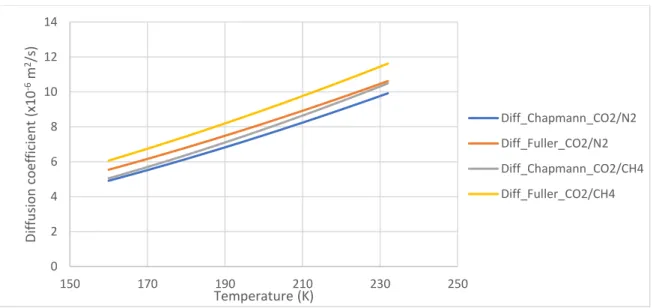
2.6.2. Coefficient of diffusion calculation ... 71
2.6.3. Properties of pure components ... 73
2.7. Heat transfer coefficient ... 73
2.8. Mass transfer coefficient ... 74
2.9. Model validation ... 75
Conclusion ... 77
Chapter 3: CO2 deposition - cryogenic removal from biogas ... 86
Introduction ... 87
3.1. Phase equilibria ... 87
3.2. CO2 separation from biogas ... 88
3.2.1. Sensitivity study of CO2 deposition from biogas and frost growth ... 88
3.2.2. Composition driven frost formation ... 94
3.3. Frost formation and growth along the tube length ... 102
3.3.1. Frosted CO2 mass flux ... 103
3.3.2. Frost thickness ... 104
3.3.3. Frost mass ... 104
3.3.4. Total heat flux ... 105
3.3.5. Temperature of the tube ... 105
3.4. Comparison with results from the literature ... 106
3.5. CO2 deposition inside the frost layer ... 109
6
3.6.1. Case study of biogas treatment and biomethane liquefaction unit ... 110
3.6.2. Using an intermediate vapour-compression cycle ... 118
Conclusion ... 119
Chapter 4: Controlled evaporation CO2 frost and cold recovery ... 135
Introduction ... 135 4.1. Defrosting methods ... 135 4.1.1. On-Off defrost ... 136 4.1.2. Electric defrost ... 137 4.1.3. Gas defrost ... 137 4.2. Sublimation models ... 140 4.3. CO2 defrosting model ... 142
4.3.1. Defrosting inside the frost layer ... 143
4.3.2. Main assumptions ... 144
4.3.3. Defrosting at the surface ... 147
4.4. Controlled evaporation results ... 147
4.4.1. Frost thickness and mass decrease ... 148
4.4.2. HX temperature decrease ... 149
4.4.3. Sensitivity study ... 150
4.5. Defrosting step in biomethane process ... 151
4.5.1. Modifications and optimization of the process ... 152
4.5.2. Lower CO2 concentration ... 153
Conclusion ... 157
Chapter 5: Experimental procedure ... 171
5.1. Global description of the experimental setup ... 171
5.1.1. Objectives... 171
5.1.2. Overview of the experimental bench ... 171
5.2. Test bench operation ... 173
5.2.1. Data acquisition ... 173
5.2.2. Experimental procedure ... 175
5.3. Validation of the defrosting model ... 188
Conclusions ... 197
References ... 201
7
ANNEX B: Other models of frost formation in the literature ... 212
First hypothesis: average density ... 212
Second hypothesis: absorption rate proportional to the density ... 212
Third hypothesis: Constant absorption rate... 213
ANNEX C: Frost growth for different frost initial conditions……….………..214
ANNEX D: Psychrometric chart construction ... 215
ANNEX E: The model in Dymola ... 217
List of Figures
Figure 1: Global energy-related carbon dioxide emissions by source from 1990 to 2018[2] ... 14Figure 2: World energy consumption by energy source[3] ... 18
Figure 3: Comparison of the evolution of biogas production in different continents[8] ... 19
Figure 4: Different steps from collection of biomass to injection of clean energy source ... 20
Figure 5: The different stages from biomass to biogas (based on [19], [21]) ... 22
Figure 6: From biowaste to valorisation of biogas and biomethane ... 22
Figure 7: Phase diagram of carbon dioxide (REFPROP) ... 23
Figure 8: Schematic of water scrubbing process (based on [13] [23]) ... 25
Figure 9: Schematic for chemical absorption process using amines (based on [13], [23]) ... 26
Figure 10: Schematic for membrane separation process (based on [13], [23]) ... 27
Figure 11: Schematic for pressure swing adsorption process(based on [13] [23]) ... 28
Figure 12: Schematic of cryogenic process by compression-refrigeration(based on [23] [51]) 29 Figure 13: Schematic for CO2 cryogenic separating from combustion gases using two alternating heat exchangers [55] ... 30
Figure 14: Cryogenic packed beds concept by Tuinier[51] ... 31
Figure 15: Comparison between the costs of different CO2 removal technologies[58] ... 32
Figure 16: System of cryogenic capture of CO2 contained in the combustion gases by the Stirling machine[61] ... 33
Figure 17: Direct evaporative cooling ... 37
Figure 18: Indirect evaporative cooling ... 37
Figure 19: M-cycle principle of heat and mass exchange[69] ... 37
Figure 20: Schematic of a cooling tower operating(based on [74] ... 38
Figure 21: Model of Cryogenic-Solid Cooler[76] ... 40
Figure 22: CO2 phase diagram Pressure vs Enthalpy ... 41
Figure 23: Simplified scheme of biogas cryogenic upgrading by CO2 deposition ... 42
Figure 24: Simplified scheme of solid CO2 defrosting using a third gas as part of sublimative cooling ... 43
8
Figure 25: Psychrometric chart for N2/CO2 with temperature and concentration evolution in
frosting conditions ... 55
Figure 26: Description of heat and mass transfers during CO2 deposition... 56
Figure 27: Energy and mass transfer on the surface and inside the frost during deposition ... 59
Figure 28: Density of solid CO2 as a function of temperature ... 62
Figure 29: Thermal conductivity of solid carbon dioxide with respect to the temperature (modified from [95]) ... 63
Figure 30: Thermal conductivity of solid carbon dioxide for temperature range between 110K-195K ... 64
Figure 31: Solid CO2 specific heat capcity as function of temperature ... 65
Figure 32: Solid CO2 enthalpy as function of the temperature ... 66
Figure 33: Solid CO2 entropy as function of the temperature ... 67
Figure 34: vapour pressure of carbon dioxide as function of the temperature ... 68
Figure 35: CO2 sublimation heat as function of the temperature ... 69
Figure 36: Comparision between viscosities found by the Wilke correlation and the data found in REFPROP ... 70
Figure 37: Comparision between thermal conductivities found by the Mason and Saxena correlation and the data found in REFPROP ... 70
Figure 38: Comparision between diffusion coefficient found by Wilke and Lee (Chapman-Enskog) and that found by Fuller et al. ... 72
Figure 39: Comparison of frost thickness and density growth experimental data from Schlenjunov and calculations for different heat transfer coefficient equations ... 76
Figure 40: Psychrometric chart for CH4/CO2 with temperature and concentration evolution in frosting conditions ... 88
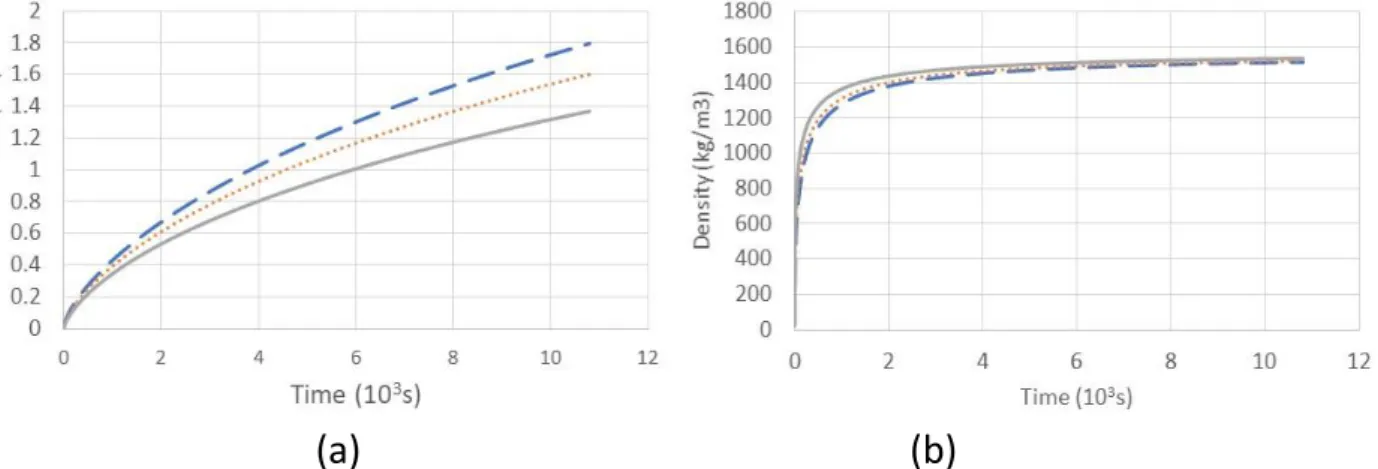
Figure 41: CO2 frost growth for different mass conc.: (a) frost thickness, (b) frost density ... 89
Figure 42: Heat flow for different CO2 concentrations: (c) total latent heat flow and sensible heat flow, (d) latent heat flow on the surface and inside frost ... 91
Figure 43: CO2 frost growth for different plate temperatures: (a) frost thickness, (b) frost density ... 91
Figure 44: Heat flow for different plate temperatures: (c) total latent heat flow and sensible heat flow, (d) latent heat flow on the surface and inside frost ... 92
Figure 45: CO2 frost growth for different biogas inlet temperatures: (a) frost thickness, (b) frost density ... 92
Figure 46: Heat flow for different biogas inlet temperatures: (c) total latent heat flow and sensible heat flow, (d) latent heat flow on the surface and inside frost ... 93
Figure 47: Heat flow for diff. plate config.: (a) total latent heat flow and sensible heat flow, (b) latent heat flow on the surface and inside frost ... 93
Figure 48: Biogas flow and frost formation visualisation for different heat exchanger geometries ... 95
Figure 49: Outlet CH4 concentration for different inlet CO2 concentration and different geometries ... 97
Figure 50: Effective heat exchange surface for plate and tube with frost deposition ... 98
Figure 51: Outlet CH4 concentration for different inlet biogas flow and different geometries99 Figure 52: Outlet CH4 concentration for different tube diameters ... 100
9
Figure 53: Evolution of frost thickness along the tube of diameter d_tube=0.02 considering one
unit length ... 100
Figure 54: Evolution of frost thickness along the tube of diamter d_tube=0.01m ... 101
Figure 55: Outlet CH4 concentration for different intial tube temperature ... 102
Figure 56: CO2 deposition rate for different positions along the tube during CO2 deposition103 Figure 57: Frost thickness for different positions along the tube during CO2 deposition ... 104
Figure 58: Frost mass for different positions along the tube during CO2 deposition... 104
Figure 59: Total heat flux for different positions along the tube during CO2 deposition ... 105
Figure 60: Tube temperature for different positions along the tube during CO2 deposition . 105 Figure 61: Tube temperature at the end of CO2 deposition phase at time t=2674s for different positions along the tube ... 106
Figure 62: Thermocouple placement in HX [64] ... 107
Figure 63: HX temperature distribution [64] ... 107
Figure 64: HX heat flow along the plate[64] ... 108
Figure 65: The growth process of the CO2 frost layer on the cold head of the heat exchanger [105] ... 108
Figure 66: Temperature of the frost layer at different positions along the frost thickness at x = L/2 ... 109
Figure 67: Density of the frost layer at different positions along the frost thickness at x = L/2 ... 109
Figure 68: Proposed biogas upgrading and biomethane liquefaction process ... 110
Figure 69: Alternating of CO2 deposition and defrosting in the 2 HX of the process ... 111
Figure 70: Phase diagram of methane ... 113
Figure 71: Biomethane outlet temperature calculated in Dymola ... 114
Figure 72: Outlet biomethane mass flowrate and methane mass concentration calculated in Dymola ... 114
Figure 73: Alternating CO2 frosting/defrosting system using an intermediate fluid in a vapour-compression cycle ... 119
Figure 74: Timed on-off defrost cycle (based on [111]) ... 136
Figure 75: Electric defrost cycle (based on [111]) ... 137
Figure 76: An evaporator in a hot-gas three pipe defrost process [109] ... 138
Figure 77: Reverse cycle gas defrost in refrigeration and defrosting cycle[111] ... 139
Figure 78: Comparison between on-off cycle and hot gas defrost cycle, a) comparison of frosting/defrosting time[108], b) comparison of cycle temeprature vs time[108] ... 139
Figure 79: Frost sublimaton evolution for different radiant heat intensities[117] ... 141
Figure 80: Description of heat and mass transfers during CO2 deposition... 143
Figure 81: Energy and mass balance on the surface and inside the frost during controlled sublimation ... 144
Figure 82: Frost thickness for different positions along the tube during CO2 defrosting ... 148
Figure 83: Frost thickness and mass decrease for different positions along the tube during CO2 defosting ... 148
Figure 84: Tube temperature for different positions along the tube during CO2 defrosting . 149 Figure 85: Latent and sensible heat flows at different positions along the tube during CO2 defrosting ... 149
10
Figure 86: heat exchanger for biomethane liquefaction... 153
Figure 87: Liquid N2 flow required for biomethane liquefaction at different pressures ... 153
Figure 88: Outlet CH4 concentration for different CO2 concentrations in inlet biogas flow ... 154
Figure 89: Accumulated CO2 frost mass along the tube for different CO2 concentrations in inlet biogas ... 154
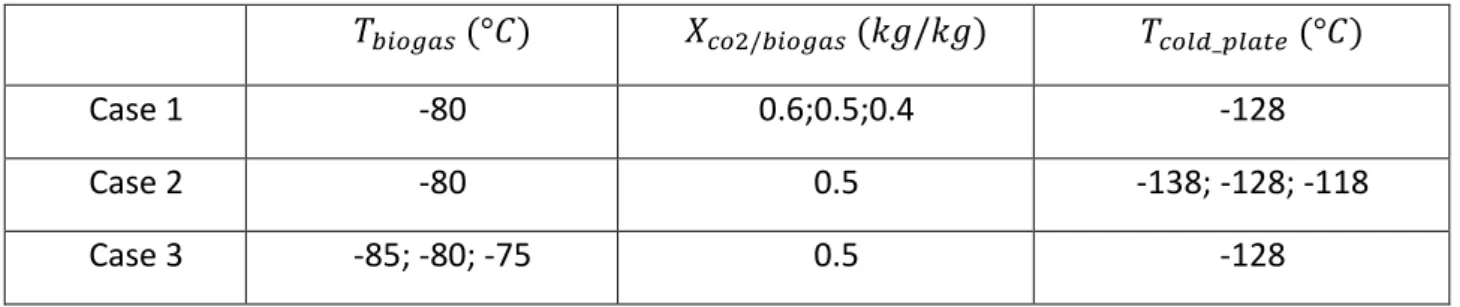
Figure 90: Evolution of frost mass and thickness during the defrosting phase for Case 1 ... 155
Figure 91: Tube temperature evolution at its extremities during CO2 defrosting in Case 1 ... 155
Figure 92: Tube temperature evolution at its extremities during CO2 defrosting in Case 2 ... 156
Figure 93: Evolution of frost mass and thickness during the defrosting phase in Case 3 ... 157
Figure 94: Tube temperature evolution at its extremities during CO2 defrosting in Case 3 ... 157
Figure 95: Flow diagram of the GPA test bench ... 172
Figure 96: Labview data aquisition diagram for the test-bench ... 174
Figure 97: Refrigerant pump Brand AB (PP01) for flow rates up to 250 g / s NOVEC 7100 refrigerant ... 175
Figure 98: Cooling system (ECO1), minimum temperature of -164 ° C (LABOLOGIC Model LA - ZW128) ... 175
Figure 99: Safety valve for NOVEC 7100 non-flammable refrigerant (SP02). ... 176
Figure 100: Emerson Coriolis refrigerant flowmeter -200 ° C ... 176
Figure 101: Brooks flow meters for each gas with inerting zone(FC01,C02)………..176
Figure 102: Observation windows of the CO2…………..………..176
Figure 103: Portholes, seals and inerting / dehumidifying system ... 177
Figure 104: Safety valve calibrated at 50 bar for the gas circuit (SP01). ... 177
Figure 105: Heat recovery exchanger (ECO2)………..178
Figure 106: Heat exchanger (ECO3)………178
Figure 107: Pressure of the CO2gas at the inlet (PG-01) and outlet (PG-02) of the test section ... 179
Figure 108: CO2 gas temperature at the container outlet and at the inlet of the test section180 Figure 109: Temperature of the coolant fluid gas at the inlet (TF-03) and outlet (TF-04) of the test section ... 180
Figure 110: CO2 gas temperature at different positions in the coaxial heat exchanger ... 181
Figure 111: Pressure of the CO2 gas at the inlet (PG-01) and outlet (PG-02) of the test section ... 181
Figure 112: Local visualisation of CO2 liquefaction in the coaxial tube ... 182
Figure 113: Temperature of the coolant fluid gas at the inlet (TF-03) and outlet (TF-04) of the test section ... 182
Figure 114: Pressure of the CO2 gas at the inlet (PG-01) and outlet (PG-02) of the test section ... 183
Figure 115: Local visualisation of CO2 solidification from its liquid phase ... 184
Figure 116: Temperature of the coolant fluid gas at the inlet (TF-03) and outlet (TF-04) of the test section ... 184
Figure 117: Defrosting of CO2 frost by a N2 flow at several stages (Δt (s) from start of defrost = 420, 700, 905, 1165) ... 185
Figure 118: (a) Evolution of coolant temeprature, (b) CO2 gas pressure and (c) mass flow of CO2 and N2 during CO2 liquefaction and solidifaction phases ... 186
11
Figure 119: Evolution of coolant temperature and mass flow of CO2 and N2 during CO2
defrosting phase ... 187
Figure 120: Frost thickness growth for different initial thickness of pre-existing frost layer. 214 Figure 121: Frost density growth for different initial density of pre-existing frost layer ... 214
List of tables
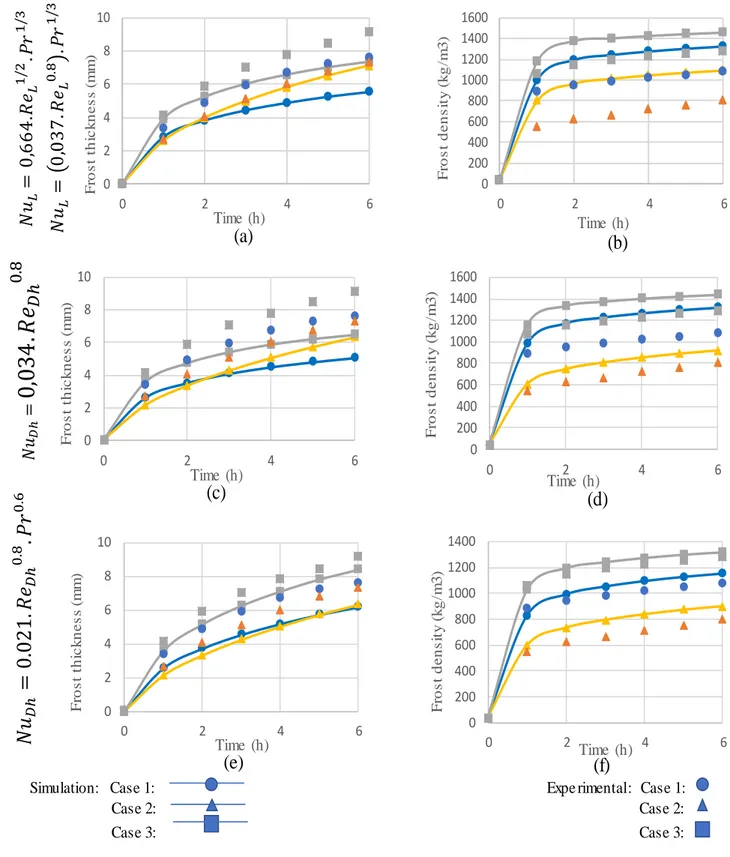
Table 1: Biogas composition from various sources[15] ... 21Table 2: Comparison between different biogas upgrading technologies[35], [36], [43], [65] . 35 Table 3: Nusselt number correlations for different geometries and flows ... 74
Table 4: Operating conditions for Shchelkunov's different experiments ... 75
Table 5: Operating conditions for sensitivity study cases ... 89
Table 6: Variation of the convective heat transfer coefficient for differnet biogas composition ... 90
Table 7: Different inlet biogas conditions for comparison between different heat exchanger geometries ... 96
Table 8: Reference case for comparison between the plate and the tube geometry ... 97
Table 9: Defrost time and tube temperature for different N2 mass flowrates and inlet temperatures ... 151
Table 10: Frost layer thickness correlations ... 209
Table 11: Frost layer density correlations ... 210
Table 12: CO2 frost thermal conductivity correlations... 211 Table 13: Mass transfer coefficient correlations as function of the heat transfer coefficient 211
Nomenclature
Symbol
Description (unit)
A Area (m2)
AHR Air Humidity Ratio (kg/kg)
cp Specific heat capacity at constant pressure (J.K-1.kg-1) cv Specific heat capacity at constant volume (J.K-1.kg-1)
d Diameter (m)
D Mass diffusivity coefficient (m2.s-1)
DAB Mass diffusivity coefficient of component A in B (m2.s-1) DCA Dynamic contact angle (°)
Dh Hydraulic diameter (m)
12
hm Mass transfer coefficient (kg.s-1.m-2) k Thermal conductivity (W.m-1.K-1)
L Length (m)
l Width (m)
Le Lewis number
Lsv Latent heat of sublimation (J.kg-1) Lvl Latent heat of vaporisation (J.kg-1)
Mass flux (kg.s-1.m-2) Nu Nusselt number P Pressure (Pa) Pr Prandtl number Heat flux (W.m-2) Heat flow (W) Re Reynolds number RH Relative humidity (%) Sc Schmidt number T Temperature (K) ΔT Temperature difference (K) t Time (s) v Velocity (m.s-1) 𝑽̇ Flowrate (m3.s-1)
x,y,z Cartesian coordinates
Xi Mass concentration (kg/kg)
xi/j Relative mass concentration of component i relative to component j
yi Molar concentration (mol/mol)
Greek symbols
ϴfrost Frost thickness (m)
α Densification rate (kg. s-1.m-3) β Porosification rate (kg.s-1.m-3) γ Specific heat capacities ratio
ε Efficiency
μ Dynamic viscosity (Pa.s)
13
Subscripts
A,B Related to component A and B respectively
avg Average
carac Characteristic
cond Conductive (related to conduction)
Cu Cupper
eff Effective
flue gases N2+CO2
fr Frost lat Latent liq Liquid sat Saturation s-c Solid coolant sens Sensible
STP Standard temperature and pressure conditions
surf Surface
tot Total
w Related to water
ϴfrost Affecting the frost thickness (at the frost surface)
14
Introduction
As energy demands increase worldwide, fossil originated energy resources are being exploited and the results on Earth’s wildlife and climate are devastating. The problem is not only with the amount of energy needed to fulfil global consumption but rather its source. Conventional sources are of fossil origin and produce a large amount of pollutants especially carbon dioxide, a greenhouse gas (GHG). The principal function of GHG is trapping heat in the atmosphere to prevent Earth’s icing. However, high emissions of GHGs are the main cause of global warming and climate change.
Globally, carbon dioxide makes up to 75% of the total GHG emissions [1]. According to a study by the International Energy Agency, global CO2 emissions rose to “a historic high of 33.1 Gt
(Giga-tonnes)”[2]. Between 2014 and 2016, CO2 emissions did not increase even though
energy demands did. This was the result of low-carbon processes development and increasing energy efficiency. But from 2016 to 2018, the increase in energy demand could not be met while conserving low carbon dioxide emissions fostering. Between 2010 and 2018, the average increase in CO2 emissions was by 0.3% for every 1% increase in global economic output.
Figure 1: Global energy-related carbon dioxide emissions by source from 1990 to 2018[2]
Limiting CO2 emissions has become a necessity. The replacement of fossil fuels and coal by
renewable clean energies can be a solution to this problem. Solar energy, hydropower, wind energy, biomass and many others are suggested to lower CO2 emissions and limit the
consumption of resources that take millions of years to be formed. Although all these renewable energy sources have their advantages, in this thesis the focus will be on an energy source that limits CO2 emissions while presenting a high calorific value that can compete with
fossil fuels: the biogas.
All organic material that comes from animals or plants is called biomass. Food leftovers, unwanted wood, animal manures… undergo anaerobic digestion to produce biogas. Many constituents are present in the final product and their concentrations depend on the biomass
15 source. The two main components are methane CH4 and carbon dioxide CO2. Methane will be
used to produce energy. But in order to use it efficiently and cleanly, it must be separated from the other impurities like N2, O2, H2, H2S and NH3, but most importantly CO2. Many
techniques can be used to remove carbon dioxide from biogas and obtain biomethane. One of these techniques is cryogenic separation, which separates components based on their saturation temperatures. This process has a high methane yield and purity. Carbon dioxide separated in this process can be stocked and valorised. However, the main problem with cryogenic separation is high energy intensity for cooling to very low temperatures.
In this thesis, a phenomenon that can be a potential solution to this problem is studied: a new concept for CO2 removal and cold recovery in multiphase systems. The first part of the concept
is cryogenic separation of carbon dioxide from biogas which is an already existing technology. The second part presents the disruptive valorisation of the cold contained in the CO2 frost by
controlled evaporative cooling. The concept will lower, if not eliminate the need for the external cold source that cools down the system allowing the separation of CO2 from biogas.
This thesis will be divided into five chapters. In the first chapter, a global view of CO2 removal
techniques from biogas is reviewed with the aim to set the relevance of the cryogenic separation. Controlled sublimation is presented as a potential solution for the reduction of energy demands and in the end of the first chapter the new concept for CO2 cryogenic
separation with cold recovery is explained as each of its parts will be developed and well detailed in the rest of the thesis.
In the second chapter, CO2 frosting is studied. The deposition phenomenon is explained and
the model used for predicting frost formation and growth is presented. Very few studies have been carried out on solid CO2 and CO2 frost properties which are very important for modelling
CO2 frost deposition. Several assumptions of the model are discussed and the results are
compared to experimental data gathered for frosting of CO2 contained in flue gases on a cold
surface.
In the third chapter, the model is applied for the case of CO2 deposition from biogas. A
parametric study is conducted to analyse the effect of several parameters on frost growth and heat transfer. Several heat exchanger geometries are discussed in order to choose the optimal solution for CO2 removal by solid deposition.
In the fourth chapter, several defrosting methods are reviewed. CO2 defrosting by controlled
sublimation is studied. The model of CO2 sublimation by cold nitrogen gas is presented. Results
are analysed in order to calculate the efficiency of the cold recovery and the possibility of applying it in a whole system of biogas upgrading and biomethane liquefaction.
The fifth chapter mainly discusses the experimental setup constructed for CO2 deposition and
controlled sublimation. The experimental procedure is described in all its details and results obtained from the experiment are analysed and thoroughly discussed. Frost growth and defrosting are observed. The cold recovery by “controlled sublimation” is discussed.
16
Introduction
Les besoins énergétiques augmentent dans le monde entier, les ressources énergétiques d'origine fossile sont exploitées et les conséquences sur la planète et sur le climat sont dévastatrices. Le problème ne concerne pas seulement la demande d'énergie nécessaire pour satisfaire la consommation mondiale, mais plutôt la source de cette énergie. Les sources conventionnelles sont d'origine fossile et produisent une grande quantité de polluants, en particulier le dioxyde de carbone, un gaz à effet de serre (GES) qui est la cause principale du réchauffement planétaire et du changement climatique.
À l'échelle mondiale, le CO2 représente jusqu'à 75% des émissions totales de GES [1]. Selon
une étude de l’Agence Internationale d’Energie, les émissions mondiales de CO2 ont atteint
«un record historique de 33,1 Gt (Gigatonnes)»[2]. Entre 2014 et 2016, les émissions de CO2
n'ont pas augmenté grâce au développement de procédés à faible teneur en carbone et d'une efficacité énergétique élevée. Mais de 2016 à 2018, l'augmentation de la demande d'énergie ne pourrait plus être satisfaite tout en limitant les émissions de dioxyde de carbone. Entre 2010 et 2018, l'augmentation moyenne des émissions de CO2 était de 0,3% pour chaque
croissance de 1% de l’économie mondiale.
Limiter les émissions de CO2 est devenu une nécessité. Le remplacement des combustibles
fossiles et du charbon par des énergies propres renouvelables peut être une solution à ce problème. L’énergie solaire, l’hydraulique, l’éolien, la biomasse et bien d’autres solutions sont suggérées pour réduire les émissions de CO2. Cette thèse se focalise sur une source d’énergie
limitant les émissions de CO2 tout en présentant un pouvoir calorifique élevé pouvant rivaliser
avec les combustibles fossiles : le biogaz.
Toute matière organique provenant d'animaux ou de plantes s'appelle biomasse. Les restes de nourriture, les déchets animaux et végétaux… subissent une digestion anaérobique pour produire du biogaz. La composition du produit final dépend de la source de la biomasse. Les deux principaux composants sont le méthane CH4 et le dioxyde de carbone CO2. Le méthane
sera utilisé pour produire de l'énergie. Mais pour l'utiliser efficacement et proprement, il faut le séparer des autres impuretés telles que N2, O2, H2, H2S et NH3, mais surtout le CO2. De
nombreuses techniques peuvent être utilisées pour éliminer le dioxyde de carbone du biogaz et obtenir du biométhane. L'une de ces techniques est la séparation cryogénique, qui sépare les composants selon leurs températures de saturation. Ce processus produit un rendement élevé de méthane de haute pureté. Le dioxyde de carbone séparé au cours de ce processus peut être stocké et valorisé. Cependant, le problème principal de la séparation cryogénique est le besoin énergétique élevé pour le refroidissement à très basse température.
Dans cette thèse, on étudie un phénomène qui peut représenter une solution potentielle à ce problème : un nouveau concept pour l'élimination du CO2 et la récupération simultanée du
froid. La séparation cryogénique du dioxyde de carbone du biogaz est une technologie énergivore. L’originalité concerne la valorisation du froid contenu dans le givre de CO2 : le
refroidissement par sublimation contrôlée. Le concept réduira, voire éliminera la nécessité d'une source de froid externe qui refroidit le système, permettant ainsi de séparer plus de CO2
17 Cette thèse est divisée en cinq chapitres. Dans le premier chapitre, les techniques d'élimination du CO2 provenant du biogaz sont détaillées dans le but de définir la pertinence
de la séparation cryogénique. L'évaporation contrôlée est présentée comme une solution potentielle pour la réduction de l’énergie de refroidissement. À la fin du premier chapitre, le nouveau concept de séparation cryogénique du CO2 avec récupération du froid est expliqué.
Chaque partie est détaillée dans la suite du document.
Dans le deuxième chapitre, le givrage du CO2 est étudié. Le modèle utilisé pour prédire la
formation et la croissance du givre est présenté. Très peu d'études ont été réalisées sur les propriétés du CO2 solide et du givre de CO2, qui sont très importantes pour la modélisation
des dépôts de givre CO2. Plusieurs hypothèses du modèle sont discutées et les résultats sont
comparés à des données expérimentales de givrage du CO2 contenu dans les gaz de
combustion sur une surface froide.
Dans le troisième chapitre, le modèle s’applique au cas de la séparation du CO2 contenu dans
le biogaz. Une étude de sensibilité est menée afin d’analyser l’effet de plusieurs paramètres sur la croissance du givre et le transfert de chaleur. Plusieurs géométries d'échangeurs de chaleur sont discutées afin de choisir la solution optimale pour l'élimination cryogénique du CO2.
Dans le quatrième chapitre, les méthodes classiques de dégivrage sont présentées. Le dégivrage du CO2 par évaporation contrôlée est étudié. Le modèle de sublimation de CO2 par
l'azote froid est présenté. Les résultats sont analysés afin de calculer l'efficacité de la récupération du froid et la possibilité de l'appliquer sur un système d’épuration et de liquéfaction du biogaz.
Le cinquième chapitre traite principalement du banc d’essai permettant d’étudier le givrage du CO2 et l'évaporation contrôlée. La procédure expérimentale est décrite dans tous ses
détails et les résultats de l'expérience sont analysés et discutés. La croissance du givre et le dégivrage sont observés. La récupération du froid par « sublimation contrôlée » est analysée et discutée.
18
Chapter 1: State of the art on CO
2
removal
and
evaporative
cooling
methods
Introduction
The world is facing a problem of supplying and securing the sustainable energy resources needed to cover industrial and domestic energy needs. Energy independence from non-renewable (and polluting) sources and the deployment of recovery technologies for renewable and clean energy is becoming a requirement. In a study carried out by the U.S. Energy Information Administration in 2017[3], it is forecasted that the energy consumption will have increased by 28% worldwide between 2015 and 2040 with fossil fuels as the main energy source. According to Figure 2, fossil fuels contributed to 84% of the total energy in 1990 to about 10% for renewable energy. In 2015, the latter increased to cover 12% of the total energy but the fossil fuels remained at 84% with an increase of 20% in the world energy consumption. In 2040, it is expected that fossil fuels will cover 77% and the contribution of renewable energy will increase to 17%. Although it is clear that renewable and nuclear energy sources are improving in terms of contribution to the world energy consumption, there is still a long way for such sources to cover worldwide energy
Figure 2: World energy consumption by energy source[3]
Besides limited availability, the problem with fossil originated energy is the impact that it imposes on the environment. They are the main cause of CO2 emissions which are responsible
for the greenhouse effect. This process causes the atmosphere to retain more of the sun’s heat than it should thus cause global warming.
Many actions were taken in several countries and by many companies in order to limit CO2
emissions especially in the power generation sector[3]. First, CO2 emissions can be limited by
increasing the efficiency of the systems for example using heat regeneration in thermodynamic systems, heat integration in power plants and overall research and development in all industrial sectors like automobile, home appliance and others. Although, this can reduce CO2 emissions it will not be enough especially that energy demand is
19 constantly increasing worldwide. Nuclear energy can be a solution in some countries since it is a low carbon dioxide emissive energy source; however nuclear waste management remains a problem still besides inherent risks of malfunction of a power plant that can lead to devastating results.
Here lies the importance of substituting fossil fuels by renewable energy sources. Photovoltaic solar power, wind power using wind turbines, hydroelectricity, biomass and other solutions were proposed as alternative energy sources to reduce CO2 emissions. Within this context,
this research work will focus on the renewable version of natural gas, the biomethane, as case study for the advanced upgrading technique by controlled sublimation of solid phase to reduce energy consumption.
1.1 Biogas as a renewable energy
Biogas is one of the solutions to this problem[4]. Biomass for collective or industrial use represents a very important part of energy production as identified by the “Syndicat des énergies renouvelables”[5]. It is estimated that the global bulk of renewable energy by 2020 will be provided by biomass energy, in particular biogas, with a contribution of at least 25%[6]. Thus, biogas energy production from commercial facilities is estimated to double in the next decade from 14.5 GW in 2012 to 29.5 GW in 2022[4]. In 2018, the top ten European countries in terms of biogas production account for 38.9% of world production, followed by China and the United States, which produce 31.25% and 24.73% respectively[7]. In Figure 3[8], the evolution of the biogas market by country from 2012 to 2015 with a projection to 2022 is presented. The demand for biogas should increase continuously in the years to come mainly for environmental reasons. Biogas is produced from organic matter containing CO2 that was
present in the atmosphere unlike fossil fuels which will release and accumulate CO2 that was
underground into the atmosphere causing global warming... Also, in many countries, governments are issuing laws regarding the use of renewable energy for fuel production to promote this industry. In fact, several countries (Sweden, France, Germany, the Netherlands ...) are already producing methane (usable as fuel) from biogas[9] at industrial scale.
Figure 3: Comparison of the evolution of biogas production in different continents[8]
According to a study carried out by the “Syndicat des énergies renouvelables” (SER) and gas network operators (GRDF, GRTgaz, TIGF)[5], in France the production of biomethane which was authorized in 2011, progressed in one year (2015-2016) by 162% to reach 215 GWh, the
20 equivalent of a consumption of 18,000 homes. In 2016, biogas production was spread over 550 units, 26 of which produced biomethane (purified biogas) ready for injection into the natural gas network. Even though it seems unlikely to be achieved, the government's objective is to reach 8 TWh of biomethane injected in 2023[10] and a volume between 14 and 22TWh in 2028, thus biogas will contribute between 6 and 8% of the total gas consumption in France[11].
1.1.1 From raw biogas to injection of biomethane into the
natural gas grid
The production of biomethane goes through several stages: 1. Collection: Biomethane is produced from organic matter such as food waste, agricultural products, wastewater treatment residues collected and put in a digester or stored in landfills.
2. Methanisation: in a digester the degradable organic matter is transformed into biogas, the solid residues are put apart to become fertilizers (digestate).
3. Biogas upgrading: this is a treatment of biogas before being injected into the network, all the impurities (CO2,
H2O, N2 ...) must be removed to obtain almost pure
methane at the minimum concentration set by the gas network operator specifications[12].
4. Injection: the biomethane is odorised and controlled. Then it is injected into the network or stored for later use in transportation.
Biogas composition can differ depending on the source of organic matter. However, the main components are methane CH4 and carbon dioxide CO2. In the biogas upgrading phase CO2 will
be removed in order to obtain clean and usable biomethane. The importance of biogas production is not limited to the disposal of organic waste but extends to a significant valorisation -domestic or industrial - in the thermal and electrical fields[13].
1.1.2 Biogas composition
As it was mentioned before the two main components in biogas are methane CH4 and carbon
dioxide CO2 but it also contains traces of impurities that should also be treated before using
biogas. The gas mixture also contains water vapour and possibly some solid particles [14]. As Table 1 shows, impurities other than CO2 are much less abundant in the biogas
composition. In this thesis, the focus is on removing carbon dioxide from biogas, all the other impurities are considered removed prior to this step. Carbon dioxide is the second largest content compound in biogas after methane, and its removal proves to be the most energy
Figure 4: Different steps from collection of biomass to injection of clean energy source
Biomass collection Methanisation Biogas upgrading Valorization/ Injection
1
3
2
4
21 demanding. Thus, it impacts the energy efficiency of biomethane units and their competitiveness as it will be shown in the following section.
Table 1: Biogas composition from various sources[15]
Component Agriculture
waste Landfills Industrial waste
Methane CH4 50-80 50-80 50-70 Carbon dioxide CO2 20-50 20-50 30-50 Hydrogen Sulfide H2S 0.7 0.1 0.8 Hydrogen H2 0-2 0-5 0-2 Nitrogen N2 0-1 0-3 0-1 Oxygen O2 0-1 0-1 0-1
Water vapor H2O Saturation Saturation Saturation
1.1.3 Methanisation (Anaerobic digestion)
In order to obtain biogas, the biomass must pass through a fermentation process in anaerobic conditions (absence of O2). In terms of economic and environmental efficiency, anaerobic
digestion is better than composting or incineration. It has a more eased energy balance and limits the emission of volatile compounds to the atmosphere, including methane[16]. It also provides the fuel which is the biogas and a digestate that can be used as a fertilizer for crops cultivation. This process can solve the organic waste management problem and decrease GHG concentration the atmosphere[14]. A specific type of bacteria is added to the biomass in a liquid volume to transform the organic waste into methane and carbon dioxide[17][18] and four steps are followed in order to obtain biogas: hydrolysis, acidogenesis, acetogenesis and methanogenesis [19], [20]. Every step requires specific environmental conditions and different types of bacteria:
• In the hydrolysis step, macromolecules are degraded into soluble organic material compounds.
• In the acidogenesis step, the hydrolysed soluble molecules obtained from the first phase are transformed into light acids such as lactic and fatty acids containing 2 to 5 carbon atoms. The composition of the final product depends of the process conditions. • The acetogenesis step can be performed in parallel to the acidogenesis. Acetogenic reducing bacteria convert alcohols and light acids into carbon dioxide, hydrogen and acetate. H2S is also obtained in this phase and is an undesirable product that must be
removed before the use of biogas. The hydrogen partial pressure must remain low [21] because its increase can inhibit the metabolism of acetogens.
• The final step is the methanisation in which methane is obtained. During this phase, two types of methanogenic bacteria intervene. The acetotropic bacteria is used to reduce acetate to methane and carbon dioxide. Finally, a biogas stream is obtained which needs a certain degree of purification depending on the targeted applications, as well as a digestible that can be used in agriculture.
22
Figure 5: The different stages from biomass to biogas (based on [19], [21])
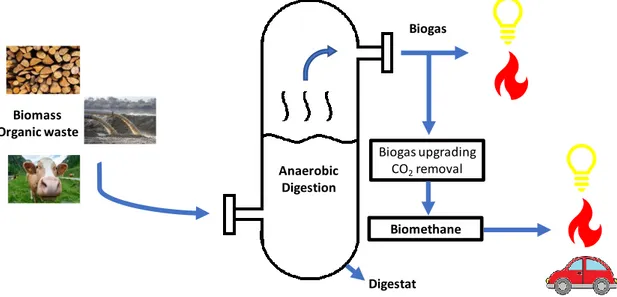
1.1.4 Biomethane valorisation
The removal of H2S from biogas enables its use in Combined Heat and Power units (CHP),
either engines or turbines, and boilers [22]. If biogas is treated to remove CO2 in
pre-combustion, biomethane is obtained and can be valorised in several ways.
Biomethane can be used in the transport sector in cars and trucks. Vehicles using compressed natural gas (CNG) or liquefied natural gas (LNG) as their fuel contribute to the development of an environmentally friendly transport sector with low GHG emission. Locally produced biomethane can be a solution in countries aiming to reduce their CO2 emissions resulting from
the transport sector. Moreover, biomethane can be injected into the natural gas grid, hence, it can be transported to its use in industry and domestic appliances.
Figure 6: From biowaste to valorisation of biogas and biomethane Biogas upgrading CO2removal Biomethane Digestat Biomass Organic waste Anaerobic Digestion Biogas
23 In order for biogas to take its place as a lead renewable environmentally friendly energy source and replace the traditional fossil fuel, it must be treated. All its impurities must be removed and most importantly carbon dioxide which is the second major component of biogas after methane. Although CO2 is not as harmful and corrosive as other impurities, it decreases the
calorific value of biogas [23]. Raw biogas has an average calorific value of about 30MJ/kg, its upgrading to biomethane containing 90% CH4 increases its calorific value to 45MJ/kg [24]. This
value is slightly lower to the calorific values of diesel and fuel, 45.6MJ/kg and 46.4MJ/kg respectively[25]. Therefore, in this thesis, the focus will be on CO2 removal from biogas.
Different techniques were designed for biogas upgrading. They will be presented and compared in this chapter.
1.2. Carbon dioxide removal techniques
Carbon dioxide in its pure state is used today in the agriculture in greenhouses, pharmaceutical and food industry. CO2 is a basic component in chemical industry, it is used to
form several compounds of interest. Global CO2 utilization in industrial processes is estimated
at 200 Mt per year, the equivalent of only 0.5% of total CO2 emissions[26].
Solid CO2 also known as dry ice, is a refrigerant that sublimates at atmospheric pressure. Its
triple point is at P=5.1 bar and T=-56°C. Everything below these conditions will result in a direct passage of CO2 from its solid phase to its gas phase and vice-versa (see Figure 7).
Figure 7: Phase diagram of carbon dioxide (REFPROP)
CO2 removal technologies are usually classified into three major parts:
- pre-combustion: removal of CO2 is completed before the combustion of the purified
fuel. Biogas is converted via gasification or partial oxidation into a synthetic gas[27]. Syngas is mainly composed of CO and H2[28]. CO reacts with steam in a water gas shift
24 reformer to obtain more H2 and CO2 [28] which will be removed via several removal
techniques that will be discussed later. Generally, CO2 concentration in pre-combusted
fuel is high since it is not yet mixed with an oxidizing agent. This results in a higher driving force for CO2 separation[30] eliminating compression necessity thus reducing
separation cost.
- post-combustion: the fuel containing CO2 is burned and its energy used. The CO2
contained in the flue gases resulting from the combustion is then removed. Its advantage is that a post-combustion technology can be added to a pre-existing process.
- oxy-fuel combustion: the product of burning fuel in an oxygen enriched medium is mainly CO2 and H2O (water vapor). Nitrogen absence during the combustion eliminates
NOx traces and results in a high CO2 concentration. Similarly to pre-combustion, this
makes CO2 removal easier. The major disadvantage is the high cost of pure oxygen
production.
In the following, several techniques for CO2 removal are presented. They can be used for
upgrading biogas in pre-combustion or for CO2 removal from flue gases in post-combustion. It
is important to state that even though the work done in this thesis focuses on CO2 removal
from biogas in pre-combustion, the concept that will be mater proposed can be used in post-combustion and this will be highlighted in chapter 2. The CO2 removal techniques presented
below are mostly considered in a pre-combustion state.
1.2.1. Water Scrubbing
Water scrubbing is a physical absorption based on the different solubilities of the components of a gas mixture in a liquid scrubbing (water). This technique has a 41% share of the total biogas upgrading market and is the most used[31]. It can be used in pre-combusiton since CO2
is 26 times more soluble in water than CH4 in water at 25°C [32]. H2S can also be removed with
this technique because its solubility is even higher to that of CO2, but it is advisable to remove
it in a prior step because its dissolving in water renders it corrosive.
The raw biogas is pressurized at around 6-12 bar depending on the process. It is then introduced to the bottom of a column containing a structurally packed bed to increase the gas-liquid mass transfer. As the biogas moves up the column, CO2 (upon other impurities) is
captured by the liquid in the column. Upgraded biogas can be collected and water filled with captured impurities carries on towards a regenerative desorption column. Gases absorbed by water are removed at low pressure so it can be used again.
Recent studies on water scrubbing focus on reducing the quantity of water used and increasing the pressure of the system. In a study by Lantela et al.[33] on a pilot scale project, they studied the effect of pressure, water flow and temperature on the system which operated at high pressure (20-25 bar) and low pH water[13]. They found that the system can reduce halogenated compounds by 99.9% and siloxanes by 99.1%. These impurities are mainly found in biogas produced from landfills and industrial waste [34].
25 Power consumption in water scrubbers is mainly divided between the gas compression (0.1-0.15 kWh.Nm-3 considering a compression to 6-8 bar), water compression (0.05-0.1 kWh.m-3)
and water cooling (0.01-0.05 kWh.m-3) therefore a total power need ranging between
0.16-0.3 kWh.Nm-3 [35]. Water scrubbers are usually used for treatment of high biogas flowrates
because the investment cost decreases from 5500 to 2500€/Nm3.h-1 when going from 100 to
500 Nm3.h-1 CH
4. Also energy consumption decreases from 0.3 kWh.Nm-3 at 500 Nm3.h-1 to 0.2
kWhNm-3 at 2000 Nm3.h-1 [35].
The amount of water required can be calculated as follows[35] :
𝑄𝑤𝑎𝑡𝑒𝑟(𝑚3. ℎ−1) = 𝑄
𝑏𝑖𝑜𝑔𝑎𝑠(𝑘𝑚𝑜𝑙. ℎ−1)/(𝐻𝑒(𝑚𝑜𝑙. 𝐿−1. 𝑎𝑡𝑚−1) × 𝑃(𝑎𝑡𝑚))
With 𝐻𝑒 the Henry’s Law constant which quantifies the physical absorption of a gas in a liquid, it corresponds to the amount of gas that dissolves in the liquid at its partial pressure. Water flow rates used for biogas upgrading depend on the operational pressure and they typically range between 0.18 − 0.23 mwater3 Nmbiogas−3 with water recycling [36].
The main advantage in this process is the simultaneous removal of many impurities like CO2,
H2S, NH3…[37] using only water without the need for any additional chemicals. The main
disadvantage of the water scrubbing system is the important amount of water needed even with regeneration; in order to avoid accumulation of damaging by-products especially H2S,
20-200L.h-1 of water are constantly purged. A base might be added to increase the pH which
decreases due to oxidation of H2S in raw biogas[38].
Figure 8: Schematic of water scrubbing process (based on [13] [23])
1.2.2. Chemical absorption using alkaline aqueous
solutions
Scrubbing takes place by using a solvent in which acidic gases in the biogas mixture will be separated by chemical reactions. Several types of alkaline chemical compoudns can be used in treating biogas. The most commonly alkali aqueous solutions are (KOH, NaOH…) [39] and alkanolamines (Monoethanolamine (MEA), Methyldiethanolamine (MDEA)[23]. Although chemical absorption by amines was mainly studied for removal of CO2 from flue gases and
26 et al.[40], they reported that biogas bubbling with 10% of MEA solution reduced CO2 volume
content from 40% to less than 1%. In the chemical absorption process (Figure 9), raw biogas enters an absorption column containing a packed bed (similarly to water scrubbing) where CO2 is removed by the amine solution. Then amine traces are removed by a water wash
scrubber. Upgraded biogas carries on to the outlet while amine is regenerated in a desorption column.
Similarly to the case of water scrubbing, treatment of high biogas flowrates reduce the investment cost per Nm3.h-1 from 3200€/Nm3.h-1 for 600 Nm3.h-1 to 1500€/Nm3.h-1 for 1800
Nm3.h-1 [36]. Chemical absorption can operate at low pressures (1-2 bar in the absorption
column [35]), which requires moderate power consumption for biogas compression and solvent pumping (0.12-0.15kWh.Nm-3)[41]. However, the solvent used for CO
2 removal needs
to be regenerated which occurs at 120-150°C, this requires high energy consumption (0.55 kWh.Nm-3) [35] which might be the major limitation in this upgrading technique[31].
Amine solutions are widely used for CO2 removal since it has a methane recovery higher than
99%. This is due to the fact that the chemicals will only react to specific gases allowing methane to pass through, unaltered. Advantages of this technique is the ability to operate at low pressure, high CO2 removal efficiency and high reaction rate compared to water
scrubbing[42]. However, since additional chemicals are introduced into the system, they can cause salt precipitation or foaming. Treatment of chemical waste is required. Also, in case of temperature drop, water vapor can cause corrosion of material. But the most important disadvantage is the high energy consumption.
Figure 9: Schematic for chemical absorption process using amines (based on [13], [23])
1.2.3. Membrane separation
When a gas or liquid passes through a solid it is called permeate, hence the term membrane permeation. The separation by a membrane depends on the concentration gradient (pressure difference from every side of the membrane) of the gases contained in a mixture, their mass diffusivity, different molecule size and the membrane’s permeability[43]. In newly developed processes of gas liquid adsorption, micro-porous hydrophobic membranes are used. CO2 is
retained in the “liquid membrane” along with other impurities and methane carries on. In a study by Atchariyawut et al.[44], an aqueous NaOH solution was used as the liquid membrane and was compared to water. It was found that captured CO2 flux was six times higher in the
27 NaOH solution. Increasing the temperature was more beneficial for NaOH because it increased the mass transfer coefficient while it lowered the solubility of CO2 in water. Methane recovery
was reported to be approximately 100%. If amines are used as liquid membrane, they can be regenerated with heating to release CO2. The advantage of using a liquid membrane is that it
can function at low pressure.
Another type of membrane separation is the high-pressure gas-gas permeation. These systems operate at pressures around 8-10 bar and can even get up to 20 bar; 92-97% methane can be produced[45]. The membranes retain the CH4 at the inlet side while CO2 and other
impurities pass through it. In order to achieve more purity, several membranes can be added in series to form a multistage process producing CH4 content more than 96% [13]. This can
cause methane losses that can be avoided by recirculating off-gases. Effective CO2 selective
polyvinylamine/polyvinylalcohol blend membranes were studied by Deng et Hagg [46]. They compared four different processes and found a 2-stage cascade with gas recycling to be optimal with a 98% CH4 purity. In a study by Scholz et al. [47], they stated that high CH4 purity
and yield cannot be achieved with single stage membrane processes. Figure 10 shows a multistage membrane separation process: biogas enters each stage with less CO2 content in
order to obtain the highest CH4 % possible in the last stage.
The investment cost of membrane technology is estimated around 2500€/Nm3.h-1 for biogas
flow rates of 400Nm3.h-1 to 6000€/Nm3.h-1 when reducing the biogas flow to 100Nm3.h-1[36].
For membrane separation, operating cost depends on the cost of biogas compression (0.2-0.38 kWh.Nm-3) [35], the membrane functioning time before need of replacement and the
biogas pre-treatment [41]
Membrane permeation requires low maintenance of equipment. Low energy is needed in these processes. However, the membrane cost is high unless low cost membranes are used but this can lead to a low CH4 yield and purity.
Figure 10: Schematic for membrane separation process (based on [13], [23])
1.2.4. Pressure Swing Adsorption
Pressure Swing Adsorption commonly known as PSA is a process that operates at high pressure and separates gases by their binding forces to an adsorbent. Pressure increase results in more adsorption. Activated carbon and charcoal, or a molecular sieve of zeolite
(micro-28 porous aluminosilicate) can be used as adsorbent. Their high specific area and porous texture result in a selective separation of gases.
In Figure 11, Biogas is introduced into the adsorption column packed with adsorptive material. Upgraded biogas with high methane content passes through while CO2 is retained in the
column. When adsorbent saturation with CO2 is attained in a batch operating mode, the
packed column is depressurized to almost atmospheric pressure to release CO2 (by
desorption) which is led into off-gas stream. Some impurities should be removed in prior steps because the adsorption by molecular sieves is irreversible[48]. Several columns are required in order for the system to operate efficiently by reducing gas compression energy needs and creating a continuous operation[36].
The PSA investment cost is estimated around 2700€/Nm3.h-1 for a biogas flow of 600Nm3.h-1.
It decreases to 1500€/Nm3.h-1 for a higher biogas flowrate of 2000 Nm3.h-1[45]. H
2O removal
and biogas compression require around 0.24 to 0.6 kWh.Nm-3 [41], [49].
This method leads to upgraded biogas with methane content up to 97% can be obtained [43]. It is an efficient and flexible process that can absorb many impurities from feed gas [50]. The main drawback of PSA is high gas loss because of the desorption phase where pressure is released. Mass transfer zone inside the packed column affects the system’s performance directly. This method is the second most used after water scrubbing.
Figure 11: Schematic for pressure swing adsorption process(based on [13] [23])
1.2.5. Cryogenic techniques for removal of CO
2When a gas mixture is cooled, every component has a different condensation temperature for which it is separated from the mixture. For example, at atmospheric pressure CO2 frosts
directly from its vapor phase at -78°C, meanwhile methane liquifies at -162°C. Several studies have been conducted to improve CO2 capture technologies. Cryogenics has several
advantages: no chemical absorbents used and the process can operate at atmospheric pressure. Pure CH4 (99%) as well as pure CO2 (98%) can be obtained with low methane losses
(<1%). The methane produced is already cold reducing the cooling load needed for liquefaction. The major disadvantage of this process is the expected cooling cost of a cryogenic process which has limited the research done on this subject. Still, several cryogenic separation techniques were developed in an attempt to overcome this problem and reduce energy demands of the cryogenic process.
29
i. Compression-refrigeration CO
2separation
When the CO2 pressure increases, its phase change occurs at a higher temperature (Figure 7).
It should be noted that the pressure of carbon dioxide in the mixture is equal to its partial pressure and not the pressure of the stream. Therefore, increasing the pressure of the mixture containing CO2 increases the temperature at which cooling load is needed to remove it. This
method is more suitable for streams with high CO2 concentration otherwise increasing the
partial pressure (compression) of CO2 will be more costly than cooling it.
Suarsana [52] developed a multistage cryogenic process for CO2 removal from biogas. The
process included several separators at different P-T conditions. A high CO2 molar
concentration (71%) feed was introduced to the system. In every stage the remaining CO2
would be compressed and cooled to be removed. The best technico-economic case study was with four separators at -15.56°C, -62°C, -90°C, -101°C and 90, 3.45, 3.45, 3.45 bar respectively. The final product contained 8.63% molar concentration of CO2.
In 2012, Xu et al. [53] proposed a two-stage compression-refrigeration process for CO2
separation from H2 and liquefaction. The two-stage compression increased the pressure of the
system thus the liquefaction temperature of CO2. This reduced the cryogenic cooling load
needed and the additional compression needed for liquefaction. Xu et al. studied the effect of the CO2 concentration in the mixture and the pressure of the system on the temperature
needed to remove 90% of CO2. Like it was previously discussed it was found that less cooling
is needed at high concentrations and high pressures.
Not many data can be found concerning biogas upgrading using cryogenic processes and it represents about 0.4% of all the biogas upgrading market [54]. Biomethane can provide biomethane with a high purity (99%) and low methane losses (1%) [13]. Its major drawbacks are the necessary removal of impurities like water, H2S… prior to CO2 removal to avoid clogging
and other operational problems[36]. There’s a large uncertainty in the energy needs estimation [35] but it can be approximated between 0.42 and 1 kWh.Nm-3 which is high
compared to other processes due to the high cooling load needed in these processes[36] . It should be mentioned that biomethane obtained in cryogenic separation is at low temperatures which can facilitate its liquefaction in a later step.
Figure 12: Schematic of cryogenic process by compression-refrigeration(based on [23][51])
ii.
Variable temperature post-combustion cryogenic
separation
According to Clodic et al. [55], the only possibility of capturing CO2 from a mixture at
![Figure 1: Global energy-related carbon dioxide emissions by source from 1990 to 2018 [2]](https://thumb-eu.123doks.com/thumbv2/123doknet/2602647.57405/15.892.157.744.519.818/figure-global-energy-related-carbon-dioxide-emissions-source.webp)
![Figure 15: Comparison between the costs of different CO 2 removal technologies[58]](https://thumb-eu.123doks.com/thumbv2/123doknet/2602647.57405/33.892.235.649.316.618/figure-comparison-costs-different-removal-technologies.webp)
![Figure 16: System of cryogenic capture of CO 2 contained in the combustion gases by the Stirling machine[61]](https://thumb-eu.123doks.com/thumbv2/123doknet/2602647.57405/34.892.133.763.101.452/figure-cryogenic-capture-contained-combustion-gases-stirling-machine.webp)