HAL Id: hal-03034506
https://hal.archives-ouvertes.fr/hal-03034506
Submitted on 1 Dec 2020
HAL is a multi-disciplinary open access
archive for the deposit and dissemination of
sci-entific research documents, whether they are
pub-lished or not. The documents may come from
teaching and research institutions in France or
abroad, or from public or private research centers.
L’archive ouverte pluridisciplinaire HAL, est
destinée au dépôt et à la diffusion de documents
scientifiques de niveau recherche, publiés ou non,
émanant des établissements d’enseignement et de
recherche français ou étrangers, des laboratoires
publics ou privés.
DNA genes and nucleolus during yeast Saccharomyces
cerevisiae cell cycle
Lise Dauban, Alain Kamgoué, Renjie Wang, Isabelle Léger-Silvestre, Frédéric
Beckouët, Sylvain Cantaloube, Olivier Gadal
To cite this version:
Lise Dauban, Alain Kamgoué, Renjie Wang, Isabelle Léger-Silvestre, Frédéric Beckouët, et al..
Quan-tification of the dynamic behaviour of ribosomal DNA genes and nucleolus during yeast
Saccha-romyces cerevisiae cell cycle.
Journal of Structural Biology, Elsevier, 2019, 208, pp.152 - 164.
Contents lists available atScienceDirect
Journal of Structural Biology
journal homepage:www.elsevier.com/locate/yjsbiQuantification of the dynamic behaviour of ribosomal DNA genes and
nucleolus during yeast Saccharomyces cerevisiae cell cycle
Lise Dauban
a, Alain Kamgoué
b, Renjie Wang
a,1, Isabelle Léger-Silvestre
a, Frédéric Beckouët
a,
Sylvain Cantaloube
a, Olivier Gadal
a,⁎aLaboratoire de Biologie Moléculaire Eucaryote, Centre de Biologie Intégrative (CBI), Université de Toulouse, CNRS, UPS, 31000 Toulouse, France bCentre de Biologie Intégrative (CBI), Université de Toulouse, CNRS, UPS, 31000 Toulouse, France
A R T I C L E I N F O
Keywords:
Saccharomyces cerevisiae
Ribosomal DNA
Interphasic chromosome organisation Cohesin
A B S T R A C T
Spatial organisation of chromosomes is a determinant of genome stability and is required for proper mitotic segregation. However, visualization of individual chromatids in living cells and quantification of their geometry, remains technically challenging. Here, we used live cell imaging to quantitate the three-dimensional con-formation of yeast Saccharomyces cerevisiae ribosomal DNA (rDNA). rDNA is confined within the nucleolus and is composed of about 200 copies representing about 10% of the yeast genome. To fluorescently label rDNA in living cells, we generated a set of nucleolar proteins fused to GFP or made use of a tagged rDNA, in which lacO repetitions were inserted in each repeat unit. We could show that nucleolus is not modified in appearance, shape or size during interphase while rDNA is highly reorganized. Computationally tracing 3D rDNA paths allowed us to quantitatively assess rDNA size, shape and geometry. During interphase, rDNA was progressively reorganized from a zig-zag segmented line of small size (5,5 µm) to a long, homogeneous, line-like structure of 8,7 µm in metaphase. Most importantly, whatever the cell-cycle stage considered, rDNA fibre could be decomposed in subdomains, as previously suggested for 3D chromatin organisation. Finally, we could determine that spatial reorganisation of these subdomains and establishment of rDNA mitotic organisation is under the control of the cohesin complex.
1. Introduction
In interphase, the global organization of the 16 yeast chromosomes depends on three structural elements: centromeres (CEN), telomeres (TEL) and the nucleolus (Taddei and Gasser, 2012). All 16 CENs are tethered near the spindle-pole body by intra-nuclear microtubules (Bystricky et al., 2004; Guacci et al., 1994, 1997a, Jin et al., 1998, 2000) and TELs appear clustered in foci at the nuclear envelope (NE) (Gotta et al., 1996; Klein et al., 1992). Consequently, chromosome arms extend outwards from CEN to the periphery, defining a Rabl-like con-formation (Jin et al., 2000). During the entire cell cycle, excluding telophase, diametrically opposed to the spindle-pole body, the nu-cleolus physically separates the repetitive ribosomal DNA (rDNA) genes from the rest of the genome (Yang et al., 1989; Bystricky et al., 2005). rDNA is the genomic region with the highest transcriptional activity
in a cell nucleus. Massive rRNAs production initiates ribosome bio-genesis, the major anabolic event of the growing cell (Potapova and Gerton, 2019). In metazoan cells (Pederson, 2011), the nucleolus is divided into three ultrastructural subdomains described by transmission electron microscopy (TEM). Fibrillar centres (FCs) enriched in RNA polymerase I (Pol I) are surrounded by the dense fibrillar component (DFC) bearing Fibrillarin (Nop1 in yeast), itself embedded in the granular component (GC) (Smirnov et al., 2016). Pol I transcription is thought to take place at the interface between FC and DFC (Pederson, 2011). In yeast, the nucleolus is a crescent shaped domain flanking the NE, which was also described as having a tripartite organisation ( Léger-Silvestre et al., 1999; Trumtel et al., 2000), DFC is loaded with early pre-rRNAs, Nop1 and Gar1 proteins, while GC is filled with assembly factors such as Rlp7 or Nug2 (Gadal et al., 2002b; Léger-Silvestre et al., 1999). By in situ hybridization at the ultrastructural level, rDNA appears
https://doi.org/10.1016/j.jsb.2019.08.010
Received 5 July 2019; Received in revised form 20 August 2019; Accepted 21 August 2019
Abbreviations: rDNA, ribosomal DNA; CEN, centromere; TEL, telomere; FC, fibrillar centre; DFC, dense fibrillar component; GC, granular component; NE, nuclear
envelope; FISH, fluorescent in situ hybridization; Pol I, RNA polymerase I; FROS, fluorescent reporter operator system; NPC, nuclear pore complexes; 3D, three dimensions; SNR, signal to noise ratio
⁎Corresponding author.
E-mail address:olivier.gadal@ibcg.biotoul.fr(O. Gadal).
1Present address: Material Science & Engineering School, Henan University of Technology, 450001 Zhengzhou, PR China.
Available online 23 August 2019
1047-8477/ © 2019 The Authors. Published by Elsevier Inc. This is an open access article under the CC BY-NC-ND license (http://creativecommons.org/licenses/BY-NC-ND/4.0/).
concentrated in the DFC, at the periphery of FC (Trumtel et al., 2000). However, FCs are difficult to detect in nuclear sections (strong genetic background dependency), leading to the definition of a bipartite structure encompassing FC and DFC (Thiry and Lafontaine, 2005). Nucleolar morphology is mostly analysed on asynchronous cell culture, ignoring possible cell-cycle specific reorganization of the nucleolus. Therefore, in yeast, rDNA position within nucleolar subdomains is still not elucidated (Albert et al., 2013; Taddei et al., 2010).
Due to its repetitive nature, rDNA is easily amenable to fluorescent in situ hybridization (FISH) and live cell imaging. Using these techni-ques, rDNA organisation could be easily probed and it is now clear that rDNA adopts very distinct appearances following cell cycle progression. Visually, puff, line and loop morphologies were successively detected during cell cycle using fluorescent microscopy (Guacci et al., 1994; Lavoie et al., 2004). Since then, rDNA has become the gold standard locus to screen for genome organisation defects and particularly assess how stress or SMC complexes such as cohesin and condensin could affect chromatin compaction (Castano et al., 1996; D’Ambrosio et al., 2008b, 2008a; Freeman et al., 2000; Guacci et al., 1994, 1997a; Lavoie et al., 2004; Lopez-Serra et al., 2013; Thattikota et al., 2018; Wang et al., 2016a). Thus, quantitative description of rDNA organisation would have broad implications for our understanding on how chro-mosome conformation is achieved.
Analysis of rDNA morphology relies on visual inspection, defining structures that can be easily distinguished. Such visual classification does not allow a quantitative analysis of rDNA array organisation in three dimensions and ignores possible modification of the nucleolus. Most studies use FISH to label rDNA, which can lead to some artefacts because of cell fixation and/or denaturation steps. Other studies have used live imaging but rDNA organisation remained mostly restricted to two dimensions analysis (Lavoie et al., 2004; Miyazaki and Kobayashi, 2011). At this stage, we lack a precise quantification of rDNA geometry and of nucleolar compartment modification during cell cycle in yeast S. cerevisiae.
In this study, we made use of localization microscopy in living cells to quantitatively assess modifications of both nucleolar compartment and rDNA array three-dimensional organizations, during cell cycle. Using fluorescent microscopy, we could show that rDNA and bona fide nucleolar proteins such as Nop1 (yeast ortholog of fibrilarin) labelling are distinct and we confirmed that they could be segregated in vivo. Next, we defined the optimal rDNA labelling to achieve accurate seg-mentation in three dimensions. By quantitating rDNA reorganization during cell cycle, we could reveal the existence of spatially segregated subdomains within rDNA at all cell cycle stages. Finally, we showed that cohesin expressed in G1, and artificially stabilized on DNA, is sufficient to partially reorganize rDNA in a mitotic like conformation.
2. Materials and methods
Media and culture conditions: Yeast strains and plasmids used in this study are listed in Tables S1 and S2 respectively. Strains NOY1064 (rDNA copy number ~ 190) and NOY1071 (rDNA copy number ~ 25) were transformed with plasmid pASZ11-NUPNOP: GFP-NUP49, mCherry-NOP1 to label NPCs (Nup49) and nucleolus (Nop1). All ex-periments were done on exponentially growing cells. For G1 synchro-nisation, strain TMY3 was grown overnight in rich medium (YPD: 1% bacto peptone (Difco), 1% bacto yeast extract (Difco) and 2% glucose), the day after the culture was diluted and exponentially growing cells were arrested in G1 by addition of α-factor (Antibody-online, ABIN399114, 1 µg/ml final) every 30 min for 2h30. After washing in cold media, cells were released synchronously and samples were taken for imaging every 10 min, for 120 min. To overexpress non-cleavable Scc1 variant (Scc1(R180D,268D)-HA, Scc1-RR-DD), strains FB09-4A, FB09-9C, FB08-5C, FB08-6A were grown overnight in YP medium supplemented with 2% raffinose (Sigma-Aldrich, R0250). The day after, cells were synchronised in G1 (see above) but 1 h after starting α-factor
treatment, expression of Scc1-RR-DD was induced by addition of newly-made galactose (Sigma-Aldrich, G0750, 2% final) to the cultures. For metaphase arrest using Nocodazole, TMY3 strain was arrested in G1 (see above) in YPD and released in Nocodazole-containing YPD (Sigma-Aldrich, M1404, 10 µg/ml final) for 2 h. To assess effect of Scc1 de-pletion (Scc1-PK3-aid, scc1-AID), strains FB39 and yLD127-20c were grown overnight in synthetic complete medium deprived of methionine (SC-Met) (SC: 0.67% yeast nitrogen base without amino acids (Difco), supplemented with a mix of amino-acids, uracil and adenine, 2% glu-cose). The day after cultures were synchronised in G1 and auxin (Sigma-Aldrich, I3750) was added (1 mM final) after 1 h to induce Scc1 degradation. To arrest cells in metaphase (pMet::CDC20), they were released from G1 block in rich medium supplemented with methionine (2 mM final) and imaged after 2 h.
Microscopy: Confocal microscopy was performed as previously de-scribed (Albert et al., 2013).
Image Analysis: To determine the best rDNA labelling, signal over noise ratio was measured as median rDNA signal minus median back-ground signal, divided by backback-ground standard deviation. Backback-ground corresponds to signal acquired outside of cells. Signal specificity was measured as ratio between median rDNA and nucleoplasmic/cyto-plasmic GFP signals.
To assess nucleolar volume fluctuation during cell cycle progression using microfluidic device, timelapse of six representative cells were analysed in three dimensions using Nucquant image processing pipeline (Wang et al., 2016b).
3D rDNA reconstruction: rDNA reconstruction was performed by an initial segmentation, followed by key points extraction. Key points were next connected to minimize rDNA path outside of segmented area. Segger segmentation was used, an extension to UCSF Chimera (Pettersen et al., 2004). A our density map and Bithe segmented
re-gions:
= =
A i 1..n iB . (1)
Key points extraction was next defined such as for each Bi the
barycenter is designated by Pig= (xig,yig,zig). For two regions Biand Bj
we denote by Pic= (xic,yic,zic) and Pjc= (xjc,yjc,zjc) the nearest points in
the two regions. Path connecting key points was computed using a graph matrix. We fixed the parameter δmax= 150 nm, the value beyond
which no connection is possible between two key points. The graph matrix is such that:
= <
S i j( , ) Si j, ( max) 1 ifdistance(Pig c Pjg c, , , ) max (2a)
=
S i j( , ) Si j, ( max) 0 elsewhere (2b)
We used depth-first search (DFS) algorithm to find all possible paths (ζi)i=1..Kthat cross all the vertices in the graph. 3D rDNA geometry, in
which len is the length of the rDNA, is define such as ζopt:
= =
opt Argi 1. . min{K len i( )} (3)
Fluorescent in situ hybridization: Yeast cells were cultivated in YPD and treated for G1 and G2/M synchronization as described in “Media and culture conditions” section. The spheroplasts were prepared ac-cording to Guacci et al. with minor modifications (Guacci et al., 1994). Cells were fixed in 4% formaldehyde for 2 h at RT, washed 3 times with milliQ water and suspended in 1 ml of 1,2 M sorbitol, 0,1 M Phosphate buffer, pH 7,5 (sorbitol buffer). To digest the cell wall, the cells were then resuspended in a mix containing [50 µg/ml] Zymolyase 100 T and 1/500 vol ß-mercapto-ethanol in sorbitol buffer during 45–60 min at RT. The cell wall degradation was controlled under a microscope and stopped by adding 1 vol of 1% Triton X100. Spheroplasts were trans-ferred on poly-L-lysine (0,1% in water) coated coverslips and let for 15 min at RT. The suspension was then removed from coverslips and replaced with 0.5% SDS for 3 min at RT. The 0,5% SDS was removed and replaced by fresh 0,5% SDS for an additional 10 min incubation at RT. Coverslips were then submerged in 3:1 methanol/acetic acid for
5 min at RT, dried at RT and stored until FISH procedure. The FISH was performed according to Guacci et al. (Guacci et al., 1994) and Waminal et al. (Waminal et al., 2018). The coverslips were treated with RNase (100 µg/ml in 2 × SSC) 1 h at 37 °C and washed 4 times with 2xSSC at RT. The spheroplasts were then dehydrated in an ethanol series of 2 min (70%, 80% and 95% at −20 °C) and air-dried. The coverslips were next incubated with Proteinase K (200 µg/ml in 20 mM Tris, pH7,4, 2 mM CaCl2) for 15 min at 37 °C and then dehydrated by an ethanol series of 1 min (70%, 80%, 90%, 100%, −20 °C). Subsequently, the DNA in spheroplasts was denaturated by incubating the coverslip for 5 min in 70% formamide/2 × SSC. The spheroplasts were then immediately dehydrated by an ethanol series of 1 min (70%, 80%, 90%, 100%, −20 °C); at this step, they were ready for hybridization. To visualize the rDNA, we used, as probe, a mix of eleven Cy3-labelled oligonucleotides complementary to sequences spanned over the S. cerevisiae rDNA locus (Table S3). Probes at ~[19 ng/µl] were denatured in 50% formamide, 10% dextran sulfate, 400 µg/ml salmon sperm DNA for 5 min at 70 °C. Hybridization of 20 µl probe/coverslip proceeded for 2 h at RT, in a humid chamber.
Coverslips were then washed at RT, 5 min in 2xSSC, 10 min in 0,1 × SSC, 5 min in 2 × SSC and 1 min in PBS/Igepal 0,1%. The DNA was counterstained with premixed 4′-6′-diamino-2-phenylindole (DAPI) solution (25 µg/ml in Mowiol). Metamorph was used to acquire images with an inverted fluorescent Olympus IX81 microscope equipped with a sCMOS Hamamatsu ORCA-Flash 4.0 camera. Acquisitions were made with a UPlan SApo X100 1.4 oil objective and using a Cy3 Lumencore SpectraX (λ excitation = 542/33) illumination was combined with an emission Chroma dual band filter set Cy3/Cy5 (51007). The panel of photos was prepared with Photoshop.
Transmission Electron Microscopy: Electron microscopy was per-formed as previously described (Albert et al., 2011).
Flow cytometry: About 2.8 x 10⁶ were fixed in ethanol 70% and
stored at −20 °C. Cells were the pelleted, washed and incubated overnight in Tris-HCl 50 mM pH 7,5 complemented with RNase A (10 mg/ml; Sigma-Aldrich) at 37 °C. Cells were pelleted, resuspended 400 μl of 1,0 mg/ml propidium iodide (Fisher, P3566) in 50 mM Tris pH 7,4, NaCl, MgCl2and incubated for 1 h at room temperature. Flow
cy-tometry was performed on a CyFlow® ML Analyzer (Partec) and data were analysed using FloMax software.
3. Results
3.1. Fluorescent microscopy allows to physically distinguish rDNA from Nop1-labelled dense fibrillar component (DFC)
rDNA being confined inside the nucleolus, we first decided to better define the relationship between nucleolar architecture and rDNA or-ganisation in yeast. Due to the small size of the yeast nucleolus (1 µm−3
(Wang et al., 2016b)), sub-nucleolar domains (FC, DFC and GC) are mostly defined by electron microscopy and are more challenging to discriminate when using light microscopy (with resolution limited to 200 nm). To tackle this issue, we decided to track proteins bound to rDNA (Rpa190, Uaf30, Net1; Fig. 1a) relative to Nop1 labelling (Fig. 1b). Nop1 is the yeast ortholog of fibrillarin, an essential methyl-transferase modifying rRNAs and histones (Tessarz et al., 2014; Tollervey et al., 1991). It is a bona fide marker of DFC compartment and is not physically associated with rDNA (Gadal et al., 2002b). rDNA bound proteins were tagged with GFP and live cell imaging was per-formed. Signals were qualitatively different: Nop1 was crescent-shaped, appearing homogeneous from cell to cell while rDNA bound proteins formed dot-like structures, confirming previous report (Ha et al., 2012). These dot like structures were reminiscent of puffs, lines or loops of various sizes previously reported by FISH (Guacci et al., 1994). In agreement with these results, we also reproduced these patterns by FISH (Suppl. Fig. S1). To confirm this apparent difference in mor-phology between Nop1 labelling and the one from rDNA bound
proteins, we compared both fluorescent signals in the same nucleus. We took advantage of the previously described TMY3 strain, in which rDNA was labelled with Fluorescent Repressor/Operator System (FROS), al-lowing LacI-GFP to specifically bind to lacO-modified rDNA repeats (Miyazaki and Kobayashi, 2011). We introduced in TMY3 strain mCherry-Nop1 fusion protein to test relative localization of Nop1 and rDNA (Fig. 1c). LacI-GFP signal appeared as dot-like structures, re-miniscent of what was observed for Net1, Uaf30 or Rpa190 labelling. Nop1 appeared broader and embedded rDNA. Besides their close proximity, yeast rDNA and Nop1 appeared as morphologically different nucleolar subdomains, visible at the fluorescent microscopy resolution. To gain insight into the interplay between rDNA and nucleolus or-ganizations, we then explored consequence of rDNA copy number var-iation or decreased rRNA synthesis on nucleolar morphology. We took advantage of yeast strains in which rDNA copy number has been de-creased by 8-fold (from 190 to about 25 copies; (Kobayashi et al., 1998)) without detectable growth defect (Albert et al., 2011; French et al., 2003). We labelled Uaf30 to track rDNA and analysed both rDNA mor-phology and nucleolar volume. Nucleoporin Nup57 was also labelled in these strains to allow nuclear periphery detection and nuclear volume quantification. Reducing rDNA copy number resulted in a strong de-crease in length and intensity of the rDNA signal (Fig. 2a). Surprisingly, Nop1 signal appeared unchanged and still accounted for about one third of the total nuclear volume in strain harbouring reduced rDNA copy number (Fig. 2b). Using a dedicated image analysis pipeline, we mea-sured nucleolar/nuclear volume ratio. Nop1 signal was segmented de-fining nucleolus, and nuclear volume was computed by fitting volume of an ellipsoidal shape to 3D nuclear pore complexes (NPC) positions (Fig. 2c; red: nucleolus, ellipsoidal mesh: nucleus, blue spheres: detected NPCs) (Berger et al., 2008). We could show that nucleolus/nucleus ratio significantly increased, with median shifting from 26,7% ( ± 0.07) to 33.3% ( ± 0.08) in strains harbouring 190 and 25 rDNA copies respec-tively (note that nuclear volume is marginally increased in 25 rDNA copies strain). Therefore, upon decreased rDNA copy number, nucleolar volume is not reduced but even enlarged by 6%.
Other evidence for differential behaviour between nucleolar rDNA-bound and unrDNA-bound proteins came from the fact that they harbour distinct segregation properties during mitosis (Girke and Seufert, 2019). Additionally rapamycin treatment, or other environmental conditions quickly repressing Pol I transcription, physically segregate fluorescently tagged rDNA-bound proteins apart from unbound ones (Ha et al., 2012; Mostofa et al., 2018). Along the same line, we previously reported that about 5-fold reduction in rRNA production, due to Pol I lacking subunit Rpa49 (rpa49Δ mutant) resulted in a fragmented nucleolus (Albert et al., 2011). By introducing rpa49Δ allele in strain bearing mCherry-Nop1 construct and FROS-modified rDNA, we confirmed that mCherry-Nop1 signal spread in the entire nucleus and formed droplets, appearing as foci of higher intensities (Fig. 2d). In this condition, rDNA remained confined and did not localise with intense Nop1 clusters. Therefore, upon acute reduction of rRNA synthesis, rDNA-bound and unbound proteins can be physically segregated as distinct subdomains.
In conclusion, upon active rRNA synthesis, rDNA array is confined inside the nucleolus but occupies a defined region that can be dis-tinguished from bulk Nop1 staining using fluorescent microscopy. Still, rDNA array and Nop1 behave differently, with decreased rDNA repeats increasing nucleolar volume and reduced rRNA production segregating rDNA away from nucleolar proteins.
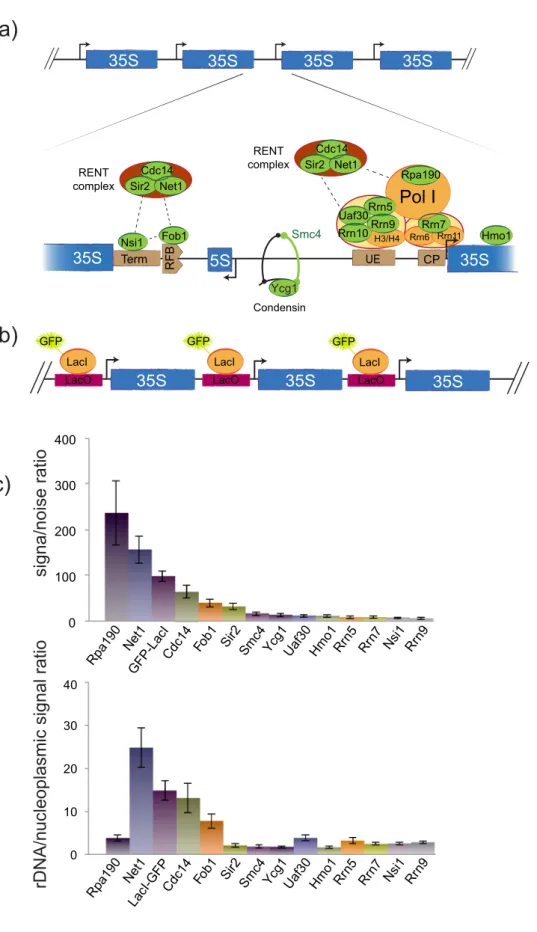
3.2. Ranking rDNA fluorescent markers to optimize rDNA labelling More than 200 proteins are present in the yeast nucleolus but at variable concentrations and a small number of which is directly bound to rDNA (Fig. 3a) (Huh et al., 2003; Kulak et al., 2014; Peng et al., 2012). To study rDNA reorganisation in three dimensions during cell cycle, our first goal was to determine the best rDNA-labelling marker in living cells. As protein concentration is crucial for high-quality
fluorescent staining, we performed confocal imaging of several fluor-escently tagged endogenous rDNA bound proteins to determine re-porters allowing the best rDNA segmentation (Fig. 3). Strain bearing all rDNA units modified to contain FROS system was also included (Fig. 3b, (Miyazaki and Kobayashi, 2011)). We then quantitated signal-to-noise ratio (SNR, see materials and methods) and signal specificity for each candidate using maximal intensity projection of 3D stacks (Fig. 3c). Signal specificity was defined as ratio between rDNA and nucleoplasmic signals. Among rDNA bound proteins, we tested the largest Pol I subunit Rpa190, its associated transcription factors Core Factor and UAF or termination protein Nsi1, all known as components of rRNA tran-scription machinery (Hamperl et al., 2013). We also tested regulatory factors enriched at rDNA such as the replication-fork barrier protein Fob1, RENT (Regulator of nucleolar silencing and telophase exit) complex subunits (Cdc14, Sir2, Net1), condensin subunits (Smc4 and Ycg1) or HMGB-box protein Hmo1 (Gadal et al., 2002a; Ha et al., 2012; Lu et al., 1996). SNR ratio (Fig. 3c, upper panel) generally correlated with protein abundance per cell, with Rpa190 being the most abundant protein with 104proteins per cell and a SNR of 250. However, Hmo1
signal was a striking exception with a low SNR with up to 2.104proteins
per cell (Ghaemmaghami et al., 2003; Kulak et al., 2014; Peng et al.,
2012). We next used signal specificity to evaluate quality of rDNA la-belling (Fig. 3c, lower panel). With a significant signal in the nucleo-plasm, Rpa190 or Hmo1 were not specific for rDNA and thus could not be good predictors of rDNA organisation. When considering both SNR and specificity of rDNA labelling, Net1 appeared as the best candidate to label rDNA, followed by LacI-GFP expressed in the FROS-tagged rDNA strain and Cdc14.
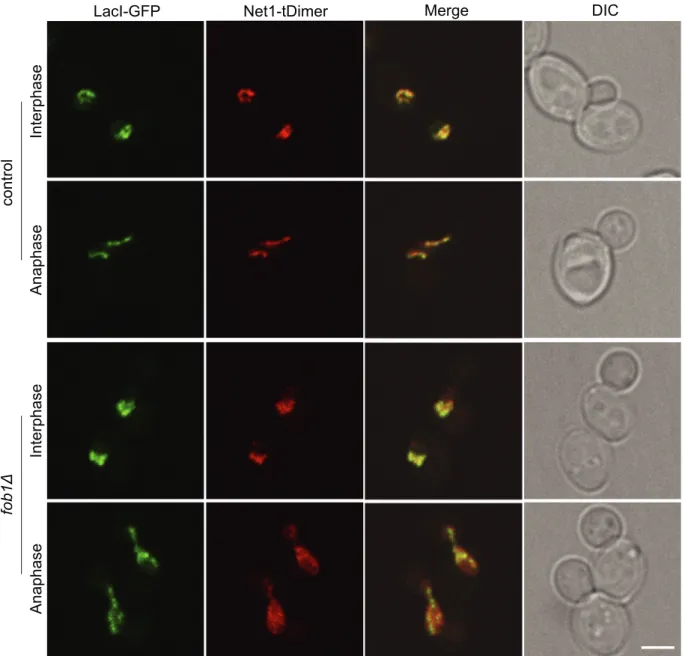
3.3. Cell cycle dependent association of Net1 with rDNA
Our first ranking amongst rDNA bound proteins based on signal intensity and specificity suggested that Net1-GFP allowed an optimal rDNA labelling. However, another prerequisite for our study was that rDNA association of Net1 tagged proteins remained unchanged throughout the cell cycle. Net1 is part of the RENT complex together with Sir2 and Cdc14 and has been described as a Pol I activator (Hannig et al., 2019; Shou et al., 2001; Straight et al., 1999). It is bound to rDNA in two genomic regions: within the IGS2 via its association to the re-plication fork barrier protein Fob1 and at Pol I promoter (Hannig et al., 2019; Huang and Moazed, 2003). Cdc14 has been proposed to con-tribute to Pol I repression during anaphase, possibly by acting on Pol I Fig. 1. Fluorescent microscopy allows to physically distinguish rDNA from bulk nucleolar compartment. a) Right: exponentially growing cells were imaged for
GFP-tagged Rpa190, Net1 or Uaf30 (strains yLD11-1a, yLD3-1a and yLD12-1a respectively) under confocal microscope. Left: Scheme representing rDNA labelling. Scale bar, 2 µm. b) Scheme representing Nop1 staining (left) and images from GFP-Nop1 expressing strain (right, strain yLD166-1a) treated as in a). Scale bar, 2 µm. c) Exponentially growing culture of strain TMY3 expressing mCherry-Nop1 (yLD31-1a) was imaged under confocal microscope to assess colocalisation between nu-cleolar protein Nop1 and rDNA bound LacI-GFP. Scale bar, 2 µm.
Fig. 2. rDNA copy number modification and rRNA transcription modulate nucleolar size and morphology. a) rDNA from cells harbouring approximately 190 or 25
rDNA copies (yLD26-1a and yLD27-1a respectively) was imaged by tagging Uaf30 with GFP. tDimer-Nup57 stains nuclear pore complexes (NPCs). Scale bar, 2 µm. b) Nucleolus was labelled with Nop1 in strains harbouring 190 or 25 rDNA copies (NOY1064 and NOY1071 respectively bearing plasmid pASZ11-NUPNOP: GFP-NUP49, mCherry-NOP1). Scale bar, 2 µm. c) Quantification of ratio between nucleolar and nuclear volumes in the two same strains as in b) (middle, see materials and methods). Right and left: examples of nucleus (green) and nucleolus (red) 3D segmentations. Ellipsoidal mesh represents nuclear volume fitted to NPCs (blue spheres) positions. d) rDNA (LacI-GFP) and nucleoli (mCherry-Nop1) were labelled in exponentially growing, control and rpa49Δ strains (yLD31-1a and yLD42-1a respec-tively). Scale bar, 2 µm. (For interpretation of the references to colour in this figure legend, the reader is referred to the web version of this article.)
Fig. 3. Defining the optimal in vivo labelling to
track rDNA. a) Top: rDNA array is assembled by tandemly repeated rDNA genes, each com-prising the coding region for the long rRNA precursor 35S and an intergenic sequence. Bottom: magnification of an intergenic se-quence and its bound proteins. Proteins de-picted in green ware tagged with GFP to track rDNA array. b) Schematic representation of rDNA in TMY3 strain (Miyazaki and Kobayashi, 2011): LacO repetitions were inserted in every intergenic sequences of rDNA copies and ex-pression of LacI-GFP fusion protein enabled its labelling. c) Signal was quantified for each GFP-tagged construct by measuring signal/noise ratio (top) and signal specificity (bottom). The latter reflects signal enrichment at rDNA com-pared to nucleoplasm (see materials and methods). (For interpretation of the references to colour in this figure legend, the reader is referred to the web version of this article.)
promoter (Clemente-Blanco et al., 2009). Moreover, Cdc14 plays a crucial role in mitosis exit and is released from rDNA during anaphase (Suppl. Fig. S2;Shou et al., 1999; Visintin et al., 1999). To evaluate if Net1 association with rDNA was also cell cycle regulated, we compared in vivo rDNA labelling by Net1 and LacI-GFP. We introduced a Net1 allele bearing a red fluorescent protein (tDimer) in the FROS tagged rDNA strain (Fig. 4, upper panel). Labelling patterns of Net1 and LacI were similar in both interphase and anaphase. Next, we evaluated rDNA labelling in a fob1Δ strain in which Net1 is dissociated from IGS2 but remains anchored at Pol I promoter (Huang and Moazed, 2003). In this condition, we observed dissociation of Net1 from rDNA during ana-phase, suggesting that Net1-rDNA association is at least partly regulated by the cell cycle (Fig. 4, lower panel).
As a consequence, we decided to use TMY3 strain, harbouring FROS insertions, to track rDNA along the entire cell cycle.
3.4. 3D analysis of nucleolar volume and rDNA organisation along cell cycle
We performed confocal live imaging of asynchronous cells har-bouring FROS-labelled rDNA. Analysis of projected images revealed bright but heterogeneous rDNA signals appearing as puffs, necklaces and lines, as previously described in populations synchronised at var-ious cell cycle stages (Fig. 5a) (Guacci et al., 1994; Miyazaki and Kobayashi, 2011). Consistent with the differential behaviour between nucleolus and rDNA array described above, while rDNA is reorganised during cell cycle progression, we could not detect such modifications in nucleolar volume or morphology. Indeed, we first used microfluidic device to measure nuclear and nucleolar volumes during an entire cell cycle of about 90 min (with stack acquisition every 15 min). After de-termining nuclear volume by approximating nuclear envelope position in 3D and evaluating nucleolar volume by 3D-segmentation of Nop1
Fig. 4. Net1 association with rDNA is cell-cycle regulated. Asynchronous control (yLD30-1a) and fob1Δ (yLD41-1a) cells harbouring rDNA (LacI-GFP) and Net1
staining, we noticed no significant modulation of nuclear/nucleolar ratio during the entire cell cycle (Suppl. Fig. S3) (Wang et al., 2016b). However, as cell cycle proceeds, nucleoli might be subjected to mor-phological restructuration undetectable by fluorescent imaging. To test this hypothesis, we synchronised cells either in G1, S or metaphase and analysed nucleolar morphology. To best preserve ultrastructure, we performed cryo-fixation, cryo-substitution, resin embedding, and ultra-thin sectioning to visualize nuclear and nucleolar morphology by transmission electron microscopy (TEM). Analysis of nuclear sections suggested that nucleoli were not subjected to major reorganisations in the cell cycle stages considered (Suppl. Fig. S4). Altogether, these re-sults suggested that modifications of nucleolar volume or of its internal organisation was not involved in cell-cycle dependent rDNA mor-phology reorganisation. This is consistent with previous study in-vestigating nucleolar size using soft-X-ray tomography (Uchida et al., 2011). To study rDNA reorganisations in a large number of cells, yeast culture (from rDNA-FROS-modified strain) was synchronised in G1 with α-factor treatment, washed, released synchronously in fresh media and imaged every 10 min, for 100 min (Fig. 5b, c). In G1, rDNA adopted puff structures, visualised as blurred signals. Dot-like structures (necklaces) became apparent at 20 min and clear lines were established from S phase (30 min) to anaphase onset (60 min). At the end of anaphase (70 min), rDNA arranged in short stretched lines and reorganised as puffs as cells re-entered G1 phase (80 min). Even if α-factor synchro-nisation has been shown to enlarge nucleolar size (Wang et al., 2016b), rDNA organisation did not seem markedly impacted by α-factor treat-ment, as rDNA morphologies documented here are similar to the one observed in asynchronous populations.
Two-dimensions (2D) projections of rDNA fluorescent signal could result in overlaying of subdomains and consequently in loss of in-formation (resulting in a puff structure). To circumvent this problem, we quantified rDNA organisation in 3D, using a dedicated image ana-lysis pipeline (Fig. 6a, see materials and methods). Briefly, acquired images were deconvolved and fluorescent signal for each nucleus was segmented in three dimensions. We could observe that in all cells and for every cell cycle stage considered, rDNA was organized as several volumes of high intensities, separated by “constrictions” of lower signal. Therefore, segmented rDNA was further divided into sub-domains, using a watershed algorithm. Subdomains number was slightly increased during the entire cell cycle, being the lowest in tel-ophase with 5 rDNA subdomains per nucleus and the highest in meta-phase with 8 subdomains (Suppl. Fig. S5). In order to explore rDNA geometry, we next decided to compute a segmented line, with each segment connecting neighbouring subdomains by their mass centres (see materials and methods). Among all possible paths, we chose the segmented line minimizing inter-domains distance (distance separating green points;Fig. 6a). Using our computational analysis of rDNA, we could extract parameters from this domains-connecting segmented line and used them to explore and quantify rDNA morphological re-organisation along the yeast cell cycle.
We identified three parameters allowing to discern rDNA re-organisation during cell cycle: heterogeneity in subdomains volumes, rDNA length and rDNA geometry (see materials and methods). First, we computed volumes of all subdomains present in one nucleus. Their standard deviation gave information on heterogeneity of domain vo-lumes. Then, rDNA length was measured along the segmented line as Fig. 5. Cell cycle dependent rDNA
re-organisation. a) Confocal imaging of asynchronous FROS-modified strain (TMY3). rDNA adopts different pat-terns appearing as puffs (red square), loops (blue square) and lines (orange square). Scale bar, 2 µm. b), c) Same strain as in a) was arrested in G1 with α-factor and released synchronously in the cell cycle. Samples were taken every 10 min and processed for flow cytometry (b) and imaging (c). Representative schemes are depicted on the right of each imaging panel. Scale bar, 2 µm. (For interpretation of the references to colour in this figure legend, the reader is referred to the web version of this article.)
the sum of mass centres-mass centres distances. Finally, 3D angles within the segmented line connecting neighbouring subdomains were measured and divided in bins of 30° to estimate rDNA geometry. As cell cycle progressed, domain volumes became homogeneous (Fig. 6b) and rDNA length increased from 5,5 µm in G1 to 8,7 µm in metaphase (Fig. 6c). Mitotic rDNA compaction resulted in rDNA shortening up to 3,5 µm in telophase (Fig. 6c). Regarding rDNA geometry, G1 favoured acute angles resulting in a zig-zag rDNA conformation. Conversely, mitotic rDNA lines specifically showed increased proportion of obtuse angles compared to acute ones (Fig. 6d). Note that to achieve a better synchronisation and to increase sampling in metaphase, cells were synchronised using the microtubules depolymerizing drug, nocodazole. Confocal imaging followed by 3D image analysis provided a quan-titative description of rDNA reorganisation during cell cycle. Rather than rDNA being simply compacted (from puffs to necklaces, then lines), we could document that rDNA is re-arranged spatially from heterogeneous subdomains, interconnected as an irregular zig-zag segmented line of small size to homogeneous domains, shaping a straighter line of longer length. With such quantitative definition of the rDNA geometry, we could then investigate how different factors con-tribute to its organisation.
3.5. Cohesin loading is sufficient to promote mitotic-like rDNA organisation in G1
Cohesin complex, belonging to the Structural Maintenance of Chromosomes family, is a ring shaped complex originally described for its role in sister chromatids cohesion (Guacci et al., 1997a; Losada et al., 1998; Michaelis et al., 1997). It is now established that cohesin is also involved in 3D genome organisation by triggering DNA looping (Kagey et al., 2010; Parelho et al., 2008). In budding yeast, cohesin is loaded on DNA in late G1. At this stage, its association with DNA is dynamic be-cause of a releasing activity, mediated by Wpl1, which dissociates the ring from DNA. Cohesin acetylation during replication abrogates Wpl1 activity and stabilises cohesin on DNA, allowing cohesion establishment.
Using Hi-C and FISH techniques, it has been shown that cohesin re-organises all genomic regions, including rDNA locus, from late G1 until mitosis (Dauban et al., 2019; Guacci et al., 1997b, 1994; Lazar-Stefanita et al., 2017; Schalbetter et al., 2017). To study cohesin-mediated mitotic organisation of rDNA in living cells, we degraded cohesin kleisin subunit Scc1 using an auxin-degron strategy, in TMY3 strain (see materials and methods). Upon cohesin depletion, mitotic rDNA did not organize into a stretched line anymore but rather appeared as a zig-zag line of small size, reminiscent of the one observed in G1-arrested cells (Fig. 7a). To un-couple the effect of cohesin from the contribution of S phase and mitosis specific processes on rDNA organisation, we checked whether cohesin loading on DNA in early G1 would be sufficient to promote mitotic-like rDNA organisation. To test this possibility, we expressed cohesin in early G1-arrested cells and evaluated rDNA geometry. Fully functional cohesin complex is absent from early G1 chromosomes in budding yeast because of separase activity cleaving Scc1 from mitosis to G1 (Uhlmann et al., 1999). To overcome separase activity, we expressed a non-cleavable variant of Scc1 (Scc1-RR-DD), in G1-arrested cells (Suppl. Fig. 6a) (Uhlmann et al., 1999). Expression of Scc1-RR-DD in G1 cells induced slight changes in rDNA organisation (Fig. 7b, left panel,Suppl. Fig. 6b). Image analysis revealed homogenisation of rDNA subdomain volumes, a characteristic of rDNA reorganisation prior to mitosis (Fig. 7c). While a tendency to an increased proportion of obtuse angles was detected, no increase in line length could be measured (Fig. 7c). We concluded that cohesin loading in G1 only partially reorganised rDNA from a G1 to a mitotic-specific configuration. This partial effect could be due to Wpl1 activity removing cohesin from DNA at this stage (Haarhuis et al., 2017; Kueng et al., 2006; Wutz et al., 2017). Indeed, cohesin needs to be sta-bilised on DNA in S phase to allow cohesion establishment and genome reorganisation. Therefore, cohesion stabilisation could also be necessary in G1 to promote mitotic-like rDNA 3D folding. To test this hypothesis, we stabilised cohesin on DNA by removing Wpl1 (wpl1Δ) and analysed consequence on rDNA organisation. Surprisingly, Wpl1 deletion by itself impacted rDNA organisation in G1. Subdomains folded into a more linear structure, as indicated by the modest increase in obtuse angles and their Fig. 6. 3D analysis of cell cycle dependent rDNA reorganisation. a) Raw images were deconvolved and fluorescent signal was segmented in 3D. Second round of 3D
segmentation enabled division of each cell signal into subdomains. Mass centres were computed and connected by the line with the shortest inter-subdomains distance (see materials and methods). Three parameters were finely extracted from the chosen line: heterogeneity in domain volumes (b), length (c) and geometry (d). Each of these parameters were quantified for cells arrested in G1 (0 min), S (30 min), metaphase (Nocodazole-arrested) and telophase (90 min) and plotted as cumulative distribution functions. G1, n = 39; S, n = 40; Meta, n = 34; Telo, n = 48.
volumes heterogeneity drastically increased (Suppl. Fig. S6c). rDNA length and subdomains number per nucleus were not impacted by Wpl1 deletion (Suppl. Fig. S6b, c). Nevertheless, overexpressing Scc1 in wpl1Δ cells further impacted rDNA organisation. A distinct line could be ob-served in 2D projections, reminiscent of mitotic organisation (Fig. 7b, right panel). 3D image analysis confirmed a significant increase in obtuse angles, previously documented to be a feature of rDNA geometry in mitosis (Fig. 7c and seeFig. 6d). The volume of the subdomains remained unchanged while rDNA line length shortened when compared to control or Scc1 over-expression in presence of Wpl1. As a conclusion, cohesin stabilisation in G1-arrested cells was sufficient to reshape rDNA from a zig-zag organisation to a linear one but did not fully recapitulate a mi-totic structure. Indeed, subdomains volume did not homogenize and rDNA line length was not increased (Fig. 7c andFig. 6b,c). This suggests that at least another mechanism should be acting in mitosis to generate a stretched mitotic rDNA.
In conclusion, cohesin alone can establish linear rDNA organisation in G1, but other cell cycle regulated events are required to establish a fully organized rDNA in mitosis, visible as an elongated line, made of homogenous domains.
4. Discussion
In this work, we quantified rDNA 3D organisation changes following cell cycle progression and measured involvement of cohesin in this process. Despite the small size of the yeast nucleolus, we could clearly establish that rDNA occupies only a fraction of this volume. rDNA seems organised as a succession of subdomains, reminiscent of the spatially segregated globules organising bulk chromatin, as previously detected by super-resolution imaging in metazoan nuclei (Bintu et al., 2018). Finally, we could show that cohesin ring dictates geometry be-tween these subdomains, as artificially expressing Scc1 in G1-arrested cells led to rDNA reorganisation into a “mitotic-like” geometry. 4.1. Hierarchical relationship between nucleolar morphology, rRNA production by Pol I and rDNA genomic organisation
Some in silico models suggest that specific chromatin properties of rDNA could be sufficient to organize the nucleolus. When chromatin was modelled as a hetero-polymer, an increased diameter for rDNA
fibre relative to the rest of the DNA was sufficient to recapitulate a crescent-shaped nucleolar distribution abutting the NE (Wong et al., 2013, 2012). Alternatively, modelling enrichment of dynamic cross-links within rDNA was sufficient to segregate nucleolar chromatin from bulk chromosomes (Hult et al., 2017).
However, several experimental works in budding yeast reported a ra-ther loose relationship between nucleolar morphology and rDNA genes genomic organisation. When rDNA repeats were deleted from endogenous loci and ectopically inserted at various positions within chromosome arms, nucleolar morphology was not massively impaired (Oakes et al., 2006; Zhang et al., 2017). Moreover, formation of a fragmented, NE-associated, nucleolus was observed when rDNA genes were removed from chromo-somal DNA and expressed from multicopy plasmids (Trumtel et al., 2000; Zhang et al., 2017). We show here that nucleolus has a normal mor-phology and is even increased in size while rDNA length is 8-fold shor-tened. Therefore, modification of rDNA genomic organisation has sur-prisingly mild consequences on nucleolar architecture.
Besides, large bodies of works have shown a direct relationship be-tween pre-rRNA production and nucleolar assembly (Rudra and Warner, 2004). Pre-rRNA abundance is directly correlated to nucleolar size when Pol I is transcribing rDNA genes (Neumüller et al., 2013), while reduced production of rRNAs by RNA polymerase II, either from artificial con-structs or from rDNA genes, leads to a massively altered and detached nucleolus from NE (Oakes et al., 1993; Trumtel et al., 2000). However, even if Pol I activity is modulated during cell cycle (Clemente-Blanco et al., 2009; Iacovella et al., 2015), nucleolar/nuclear volume ratio measured here was not significantly modified following cell cycle pro-gression (Suppl. Fig. S3). Therefore, nucleolar volume seems largely in-sensitive to transient variations of Pol I activity during cell cycle. Com-pensatory regulation of rRNA processing or decay may buffer variation of Pol I induced rRNA production. Thus, pre-rRNA accumulation remains the driving force for nucleolar assembly and slight changes in Pol I transcription do not lead to nucleolar volume variation.
The nucleolus, the prominent compartment in the nucleus, is now considered to be the paradigm of liquid-liquid phase separation (LLPS) (Feric et al., 2016). Once rRNAs are produced by Pol I, they are bound by early rRNA processing factors, which have the capacity to phase separate into droplets and trigger the formation of a nucleolar com-partment. This property is observed on the fragmented nucleolus of rpa49Δ Pol I mutant, in which nucleolar material was detected as large Fig. 7. Cohesin loading is sufficient to promote mitotic-like rDNA organisation in G1. a) Control strain (FB39) and strain expressing scc1-AID (yLD127-20c) were
synchronised in G1 in the presence of auxin, released in the cell cycle and arrested in metaphase after 2 h by Cdc20 depletion (see materials and methods). Scale bar, 2 µm b) Expression of a non-cleavable variant of Scc1 (Scc1-RR-DD) was induced in G1-arrested cells, in the presence or absence of Wpl1 (strains FB09-4A, FB09-9C, FB08-5C, FB08-6A). Scale bar, 2 µm. c) Image analysis was performed on images from b), heterogeneity in domain volumes (left), line length (middle) and line geometry (right) are displayed as cumulative distribution functions. Control, n = 50; Scc1-RR-DD, n = 45; wpl1Δ, Scc1-RR-DD n = 50.
“droplets” separated from rDNA genes (this study).
Our results support the model suggesting that high rDNA tran-scription rate by Pol I results in massive rRNA production driving nu-cleolar assembly (Hernandez-Verdun et al., 2002) by liquid-liquid phase separation (Feric et al., 2016).
4.2. rDNA is organized by “chromatin blobs” at all cell cycle stages Using three-dimensional imaging, we could document that the 2 Mb-long rDNA is subdivided into subdomains at all cell cycle stages. Such spatially segregated conformations were not previously docu-mented in G1 or mitosis, but only in S-phase (Guacci et al., 1994; Lavoie et al., 2004). In G1, subdomains were continuously overlaid thus they could not be distinguished and appeared as a blurred puff using 2D visualisation. Subdomains have been detected previously in S-phase, in a necklace appearance (Lavoie et al., 2004). As they are homogenous and have a straight geometry in mitosis, they were described as a “line”. What are those subdomains? It is well established that about half of the rDNA genes are actively transcribed and randomly distributed along the repeats (Conconi et al., 1989; Dammann et al., 1995, 1993). With an average of 6 subdomains per rDNA, about 30 rDNA genes would be expected to be present in each subdomain; implying that this spatial organisation does not reflect cluster of active or inactive rDNA genes. We propose that such subdomains organisation could reflect intrinsic properties of the chromatin polymer. Indeed, we previously suggested that chromosomes could be subdivided in a series of polymer beads, called blobs, which most likely arise from intrinsic properties of an extended polymer chain (Socol et al., 2019; Wang et al., 2015). Im-portantly, such subdomains are also reminiscent of spatially segregated globular conformations observed when 1.2 Mb of chromatin were vi-sualized using super-resolution imaging (Bintu et al., 2018). Super-re-solution is not required to detect rDNA subdomains because of spatial segregation of rDNA away from bulk nucleoplasmic chromatin. 4.3. Geometrical reorganization of rDNA during the cell cycle.
In this work, we also documented a global reorganization of rDNA subdomains, from a zig-zag segmented line of small size (5,5 µm) in G1, to a long, homogeneous line of 8,7 µm in metaphase. Central roles of cohesin and condensin complexes in rDNA organisation were pre-viously established (Freeman et al., 2000; Guacci et al., 1994). In budding yeast, intact cohesin subunit Scc1 is absent in G1, giving us the opportunity to uncouple cohesin loading from cell cycle progression. By artificially expressing a stable Scc1 variant in G1 and removing Wpl1 to stabilize cohesin binding on DNA, we could observe that cohesin loading reshaped rDNA global geometry into a line-like one. In me-tazoan cells, cohesin also deeply influences size and geometry of chromatin subdomains/globules. Its absence provokes a high variability in size and position of chromosomal interacting subdomains from cell to cell, abolishing topologically associating domains detected at the po-pulation average level (Bintu et al., 2018). Thus, cohesin harbours a conserved function of folding chromatin subdomains into higher orga-nised structures along the entire genome, including rDNA array.
5. Conclusion
In this study, we could quantitate nucleolar size and rDNA 3D re-organization during the entire cell cycle. Using live cell imaging, we could precisely decipher how cohesin activity impacts rDNA organisa-tion, independently of cell cycle. While rDNA is used as a “gold-stan-dard” to study chromosome organisation, development of super-re-solution imaging of budding yeast chromosome arms would be required to investigate if nucleoplasmic chromatin follows a rDNA-like cell-cycle dependent reorganisation.
Funding
Funding was obtained from CBI (Centre de Biologie Integrative – Toulouse), Agence Nationale de la Recherche (ANR) [SinFONIE]; L. D. was supported by a Ph.D. Fellowship from the Ministere de l’Education Nationale Ph.D. Fellowship and l’Association pour la Recherche contre le Cancer Fellowship.
Declaration of Competing Interest
The authors declare that they have no known competing financial interests or personal relationships that could have appeared to influ-ence the work reported in this paper.
Acknowledgements
We would like to thank the LITC imaging platform of Toulouse TRI for their assistance, the METI platform for the TEM acquisitions and Image processing plateform for imaging pipeline. We also thank Pr. Gleizes’ group in CBI who kindly provided the probes used for FISH experiments. We also thank Alexandre Heurteau and Ludmilla Recoules for statistical test.
Appendix A. Supplementary data
Supplementary data to this article can be found online athttps:// doi.org/10.1016/j.jsb.2019.08.010.
References
Albert, B., Léger-Silvestre, I., Normand, C., Ostermaier, M.K., Pérez-Fernández, J., Panov, K.I., Zomerdijk, J.C.B.M., Schultz, P., Gadal, O., 2011. RNA polymerase I-specific subunits promote polymerase clustering to enhance the rRNA gene transcription cycle. J. Cell Biol. 192, 277–293.https://doi.org/10.1083/jcb.201006040. Albert, B., Mathon, J., Shukla, A., Saad, H., Normand, C., Léger-Silvestre, I., Villa, D.,
Kamgoue, A., Mozziconacci, J., Wong, H., Zimmer, C., Bhargava, P., Bancaud, A., Gadal, O., 2013. Systematic characterization of the conformation and dynamics of budding yeast chromosome XII. J. Cell Biol. 202, 201–210.https://doi.org/10.1083/ jcb.201208186.
Berger, A.B., Cabal, G.G., Fabre, E., Duong, T., Buc, H., Nehrbass, U., Olivo-Marin, J.-C., Gadal, O., Zimmer, C., 2008. High-resolution statistical mapping reveals gene terri-tories in live yeast. Nat. Meth. 5, 1031–1037.https://doi.org/10.1038/nmeth.1266. Bintu, B., Mateo, L.J., Su, J.-H., Sinnott-Armstrong, N.A., Parker, M., Kinrot, S., Yamaya,
K., Boettiger, A.N., Zhuang, X., 2018. Super-resolution chromatin tracing reveals domains and cooperative interactions in single cells. Science 362.https://doi.org/10. 1126/science.aau1783.
Bystricky, K., Heun, P., Gehlen, L., Langowski, J., Gasser, S.M., 2004. Long-range com-paction and flexibility of interphase chromatin in budding yeast analyzed by high-resolution imaging techniques. Proc. Natl. Acad. Sci. U.S.A. 101, 16495–16500. https://doi.org/10.1073/pnas.0402766101.
Bystricky, K., Laroche, T., van Houwe, G., Blaszczyk, M., Gasser, S.M., 2005. Chromosome looping in yeast: telomere pairing and coordinated movement reflect anchoring ef-ficiency and territorial organization. J. Cell Biol. 168, 375–387.https://doi.org/10. 1083/jcb.200409091.
Castano, I.B., Brzoska, P.M., Sadoff, B.U., Chen, H., Christman, M.F., 1996. Mitotic chromosome condensation in the rDNA requires TRF4 and DNA topoisomerase I in. Genes Dev. 10, 2564–2576.
Clemente-Blanco, A., Mayán-Santos, M., Schneider, D.A., Machín, F., Jarmuz, A., Tschochner, H., Aragón, L., 2009. Cdc14 inhibits transcription by RNA polymerase I during anaphase. Nature 458, 219–222.https://doi.org/10.1038/nature07652. Conconi, A., Widmer, R.M., Koller, T., Sogo, J.M., 1989. Two different chromatin
struc-tures coexist in ribosomal RNA genes throughout the cell cycle. Cell 57, 753–761. https://doi.org/10.1016/0092-8674(89)90790-3.
D’Ambrosio, C., Kelly, G., Shirahige, K., Uhlmann, F., 2008a. Condensin-dependent rDNA decatenation introduces a temporal pattern to chromosome segregation. Curr. Biol. 18, 1084–1089.https://doi.org/10.1016/j.cub.2008.06.058.
D’Ambrosio, C., Schmidt, C.K., Katou, Y., Kelly, G., Itoh, T., Shirahige, K., Uhlmann, F., 2008b. Identification of cis-acting sites for condensin loading onto budding yeast chromosomes. Genes Dev. 22, 2215–2227.https://doi.org/10.1101/gad.1675708. Dammann, R., Lucchini, R., Koller, T., Sogo, J.M., 1993. Chromatin structures and
tran-scription of rDNA in yeast Saccharomyces cerevisiae. Nucl. Acids Res. 21, 2331–2338.
Dammann, R., Lucchini, R., Koller, T., Sogo, J.M., 1995. Transcription in the yeast rRNA gene locus: distribution of the active gene copies and chromatin structure of their flanking regulatory sequences. Mol. Cell. Biol. 15, 5294–5303.
R., Beckouet, F., 2019. A major role for Eco1 in regulating cohesin-mediated mitotic chromosome folding. BioRxiv.https://doi.org/10.1101/589101.
Feric, M., Vaidya, N., Harmon, T.S., Mitrea, D.M., Zhu, L., Richardson, T.M., Kriwacki, R.W., Pappu, R.V., Brangwynne, C.P., 2016. Coexisting liquid phases underlie nu-cleolar subcompartments. Cell 165, 1686–1697.https://doi.org/10.1016/j.cell.2016. 04.047.
Freeman, L., Aragon-Alcaide, L., Strunnikov, A., 2000. The condensin complex governs chromosome condensation and mitotic transmission of rDNA. J. Cell Biol. 149, 811–824.
French, S.L., Osheim, Y.N., Cioci, F., Nomura, M., Beyer, A.L., 2003. In exponentially growing Saccharomyces cerevisiae cells, rRNA synthesis is determined by the summed RNA polymerase I loading rate rather than by the number of active genes. Mol. Cell. Biol. 23, 1558–1568.https://doi.org/10.1128/MCB.23.5.1558-1568.2003. Gadal, O., Labarre, S., Boschiero, C., Thuriaux, P., 2002a. Hmo1, an HMG-box protein,
belongs to the yeast ribosomal DNA transcription system. EMBO J. 21, 5498–5507. Gadal, O., Strauss, D., Petfalski, E., Gleizes, P.-E., Gas, N., Tollervey, D., Hurt, E., 2002b. Rlp7p is associated with 60S preribosomes, restricted to the granular component of the nucleolus, and required for pre-rRNA processing. J. Cell Biol. 157, 941–951. https://doi.org/10.1083/jcb.200111039.
Ghaemmaghami, S., Huh, W.-K., Bower, K., Howson, R.W., Belle, A., Dephoure, N., O’Shea, E.K., Weissman, J.S., 2003. Global analysis of protein expression in yeast. Nature 425, 737–741.https://doi.org/10.1038/nature02046.
Girke, P., Seufert, W., 2019. Compositional reorganization of the nucleolus in budding yeast mitosis. Mol. Biol. Cell 30, 591–606. https://doi.org/10.1091/mbc.E18-08-0524.
Gotta, M., Laroche, T., Formenton, A., Maillet, L., Scherthan, H., Gasser, S.M., 1996. The clustering of telomeres and colocalization with Rap1, Sir3, and Sir4 proteins in wild-type Saccharomyces cerevisiae. J. Cell Biol. 134, 1349–1363.
Guacci, V., Hogan, E., Koshland, D., 1994. Chromosome condensation and sister chro-matid pairing in budding yeast. J. Cell Biol. 125, 517–530.
Guacci, V., Hogan, E., Koshland, D., 1997a. Centromere position in budding yeast: evi-dence for anaphase A. Mol. Biol. Cell 8, 957–972.
Guacci, V., Koshland, D., Strunnikov, A., 1997b. A direct link between sister chromatid cohesion and chromosome condensation revealed through the analysis of MCD1 in S. cerevisiae. Cell 91, 47–57.https://doi.org/10.1016/S0092-8674(01)80008-8. Ha, C.W., Sung, M.-K., Huh, W.-K., 2012. Nsi1 plays a significant role in the silencing of
ribosomal DNA in Saccharomyces cerevisiae. Nucl. Acids Res. 40, 4892–4903. https://doi.org/10.1093/nar/gks188.
Haarhuis, J.H.I., van der Weide, R.H., Blomen, V.A., Yáñez-Cuna, J.O., Amendola, M., van Ruiten, M.S., Krijger, P.H.L., Teunissen, H., Medema, R.H., van Steensel, B., Brummelkamp, T.R., de Wit, E., Rowland, B.D., 2017. The cohesin release factor WAPL restricts chromatin loop extension. Cell 169, 693–707.e14.https://doi.org/10. 1016/j.cell.2017.04.013.
Hamperl, S., Wittner, M., Babl, V., Perez-Fernandez, J., Tschochner, H., Griesenbeck, J., 2013. Chromatin states at ribosomal DNA loci. Biochim. Biophys. Acta 1829, 405–417.https://doi.org/10.1016/j.bbagrm.2012.12.007.
Hannig, K., Babl, V., Hergert, K., Maier, A., Pilsl, M., Schächner, C., Stöckl, U., Milkereit, P., Tschochner, H., Seufert, W., Griesenbeck, J., 2019. The C-terminal region of Net1 is an activator of RNA polymerase I transcription with conserved features from yeast to human. PLoS Genet. 15, e1008006.https://doi.org/10.1371/journal.pgen. 1008006.
Hernandez-Verdun, D., Roussel, P., Gébrane-Younès, J., 2002. Emerging concepts of nucleolar assembly. J. Cell Sci. 115, 2265–2270.
Huang, J., Moazed, D., 2003. Association of the RENT complex with nontranscribed and coding regions of rDNA and a regional requirement for the replication fork block protein Fob1 in rDNA silencing. Genes Dev. 17, 2162–2176.https://doi.org/10. 1101/gad.1108403.
Huh, W.-K., Falvo, J.V., Gerke, L.C., Carroll, A.S., Howson, R.W., Weissman, J.S., O’Shea, E.K., 2003. Global analysis of protein localization in budding yeast. Nature 425, 686–691.https://doi.org/10.1038/nature02026.
Hult, C., Adalsteinsson, D., Vasquez, P.A., Lawrimore, J., Bennett, M., York, A., Cook, D., Yeh, E., Forest, M.G., Bloom, K., 2017. Enrichment of dynamic chromosomal cross-links drive phase separation of the nucleolus. Nucl. Acids Res. 45, 11159–11173. https://doi.org/10.1093/nar/gkx741.
Iacovella, M.G., Golfieri, C., Massari, L.F., Busnelli, S., Pagliuca, C., Dal Maschio, M., Infantino, V., Visintin, R., Mechtler, K., Ferreira-Cerca, S., De Wulf, P., 2015. Rio1 promotes rDNA stability and downregulates RNA polymerase I to ensure rDNA seg-regation. Nat. Commun. 6, 6643.https://doi.org/10.1038/ncomms7643. Jin, Q., Trelles-Sticken, E., Scherthan, H., Loidl, J., 1998. Yeast nuclei display prominent
centromere clustering that is reduced in nondividing cells and in meiotic prophase. J. Cell Biol. 141, 21–29.
Jin, Q.W., Fuchs, J., Loidl, J., 2000. Centromere clustering is a major determinant of yeast interphase nuclear organization. J. Cell Sci. 113 (Pt 11), 1903–1912.
Kagey, M.H., Newman, J.J., Bilodeau, S., Zhan, Y., Orlando, D.A., van Berkum, N.L., Ebmeier, C.C., Goossens, J., Rahl, P.B., Levine, S.S., Taatjes, D.J., Dekker, J., Young, R.A., 2010. Mediator and cohesin connect gene expression and chromatin archi-tecture. Nature 467, 430–435.https://doi.org/10.1038/nature09380.
Klein, F., Laroche, T., Cardenas, M.E., Hofmann, J.F., Schweizer, D., Gasser, S.M., 1992. Localization of RAP1 and topoisomerase II in nuclei and meiotic chromosomes of yeast. J. Cell Biol. 117, 935–948.https://doi.org/10.1083/jcb.117.5.935. Kobayashi, T., Heck, D.J., Nomura, M., Horiuchi, T., 1998. Expansion and contraction of
ribosomal DNA repeats in Saccharomyces cerevisiae: requirement of replication fork blocking (Fob1) protein and the role of RNA polymerase I. Genes Dev. 12, 3821–3830.
Kueng, S., Hegemann, B., Peters, B.H., Lipp, J.J., Schleiffer, A., Mechtler, K., Peters, J.-M., 2006. Wapl controls the dynamic association of cohesin with chromatin. Cell 127,
955–967.https://doi.org/10.1016/j.cell.2006.09.040.
Kulak, N.A., Pichler, G., Paron, I., Nagaraj, N., Mann, M., 2014. Minimal, encapsulated proteomic-sample processing applied to copy-number estimation in eukaryotic cells. Nat. Meth. 11, 319–324.https://doi.org/10.1038/nmeth.2834.
Lavoie, B.D., Hogan, E., Koshland, D., 2004. In vivo requirements for rDNA chromosome condensation reveal two cell-cycle-regulated pathways for mitotic chromosome folding. Genes Dev. 18, 76–87.https://doi.org/10.1101/gad.1150404. Lazar-Stefanita, L., Scolari, V.F., Mercy, G., Muller, H., Guérin, T.M., Thierry, A.,
Mozziconacci, J., Koszul, R., 2017. Cohesins and condensins orchestrate the 4D dy-namics of yeast chromosomes during the cell cycle. EMBO J. 36, 2684–2697.https:// doi.org/10.15252/embj.201797342.
Léger-Silvestre, I., Trumtel, S., Noaillac-Depeyre, J., Gas, N., 1999. Functional compart-mentalization of the nucleus in the budding yeast Saccharomyces cerevisiae. Chromosoma 108, 103–113.
Lopez-Serra, L., Lengronne, A., Borges, V., Kelly, G., Uhlmann, F., 2013. Budding yeast Wapl controls sister chromatid cohesion maintenance and chromosome condensa-tion. Curr. Biol. 23, 64–69.https://doi.org/10.1016/j.cub.2012.11.030. Losada, A., Hirano, M., Hirano, T., 1998. Identification of Xenopus SMC protein
com-plexes required for sister chromatid cohesion. Genes Dev. 12, 1986–1997.https:// doi.org/10.1101/gad.12.13.1986.
Lu, J., Kobayashi, R., Brill, S.J., 1996. Characterization of a high mobility group 1/2 homolog in yeast. J. Biol. Chem. 271, 33678–33685.https://doi.org/10.1074/jbc. 271.52.33678.
Michaelis, C., Ciosk, R., Nasmyth, K., 1997. Cohesins: chromosomal proteins that prevent premature separation of sister chromatids. Cell 91, 35–45.https://doi.org/10.1016/ S0092-8674(01)80007-6.
Miyazaki, T., Kobayashi, T., 2011. Visualization of the dynamic behavior of ribosomal RNA gene repeats in living yeast cells. Genes Cells 16, 491–502.https://doi.org/10. 1111/j.1365-2443.2011.01506.x.
Mostofa, M.G., Rahman, M.A., Koike, N., Yeasmin, A.M., Islam, N., Waliullah, T.M., Hosoyamada, S., Shimobayashi, M., Kobayashi, T., Hall, M.N., Ushimaru, T., 2018. CLIP and cohibin separate rDNA from nucleolar proteins destined for degradation by nucleophagy. J. Cell Biol. 217, 2675–2690.https://doi.org/10.1083/jcb.201706164. Neumüller, R.A., Gross, T., Samsonova, A.A., Vinayagam, A., Buckner, M., Founk, K., Hu, Y., Sharifpoor, S., Rosebrock, A.P., Andrews, B., Winston, F., Perrimon, N., 2013. Conserved regulators of nucleolar size revealed by global phenotypic analyses. Sci. Signal. 6, ra70.https://doi.org/10.1126/scisignal.2004145.
Oakes, M., Nogi, Y., Clark, M.W., Nomura, M., 1993. Structural alterations of the nu-cleolus in mutants of Saccharomyces cerevisiae defective in RNA polymerase I. Mol. Cell. Biol. 13, 2441–2455.
Oakes, M.L., Johzuka, K., Vu, L., Eliason, K., Nomura, M., 2006. Expression of rRNA genes and nucleolus formation at ectopic chromosomal sites in the yeast Saccharomyces cerevisiae. Mol. Cell. Biol. 26, 6223–6238.https://doi.org/10.1128/MCB.02324-05. Parelho, V., Hadjur, S., Spivakov, M., Leleu, M., Sauer, S., Gregson, H.C., Jarmuz, A.,
Canzonetta, C., Webster, Z., Nesterova, T., Cobb, B.S., Yokomori, K., Dillon, N., Aragon, L., Fisher, A.G., Merkenschlager, M., 2008. Cohesins functionally associate with CTCF on mammalian chromosome arms. Cell 132, 422–433.https://doi.org/10. 1016/j.cell.2008.01.011.
Pederson, T., 2011. The nucleolus. Cold Spring Harb. Perspect. Biol. 3.https://doi.org/ 10.1101/cshperspect.a000638.
Peng, M., Taouatas, N., Cappadona, S., van Breukelen, B., Mohammed, S., Scholten, A., Heck, A.J.R., 2012. Protease bias in absolute protein quantitation. Nat. Meth. 9, 524–525.https://doi.org/10.1038/nmeth.2031.
Pettersen, E.F., Goddard, T.D., Huang, C.C., Couch, G.S., Greenblatt, D.M., Meng, E.C., Ferrin, T.E., 2004. UCSF Chimera—a visualization system for exploratory research and analysis. J. Comput. Chem. 25, 1605–1612.https://doi.org/10.1002/jcc.20084. Potapova, T.A., Gerton, J.L., 2019. Ribosomal DNA and the nucleolus in the context of
genome organization. Chromosome Res. 27, 109–127.https://doi.org/10.1007/ s10577-018-9600-5.
Rudra, D., Warner, J.R., 2004. What better measure than ribosome synthesis? Genes Dev. 18, 2431–2436.https://doi.org/10.1101/gad.1256704.
Schalbetter, S.A., Goloborodko, A., Fudenberg, G., Belton, J.-M., Miles, C., Yu, M., Dekker, J., Mirny, L., Baxter, J., 2017. SMC complexes differentially compact mitotic chromosomes according to genomic context. Nat. Cell Biol. 19, 1071–1080.https:// doi.org/10.1038/ncb3594.
Shou, W., Sakamoto, K.M., Keener, J., Morimoto, K.W., Traverso, E.E., Azzam, R., Hoppe, G.J., Feldman, R.M., DeModena, J., Moazed, D., Charbonneau, H., Nomura, M., Deshaies, R.J., 2001. Net1 stimulates RNA polymerase I transcription and regulates nucleolar structure independently of controlling mitotic exit. Mol. Cell 8, 45–55. Shou, W., Seol, J.H., Shevchenko, A., Baskerville, C., Moazed, D., Chen, Z.W., Jang, J.,
Shevchenko, A., Charbonneau, H., Deshaies, R.J., 1999. Exit from mitosis is triggered by Tem1-dependent release of the protein phosphatase Cdc14 from nucleolar RENT complex. Cell 97, 233–244.https://doi.org/10.1016/S0092-8674(00)80733-3. Smirnov, E., Cmarko, D., Mazel, T., Hornáček, M., Raška, I., 2016. Nucleolar DNA: the
host and the guests. Histochem. Cell Biol. 145, 359–372.https://doi.org/10.1007/ s00418-016-1407-x.
Socol, M., Wang, R., Jost, D., Carrivain, P., Vaillant, C., Le Cam, E., Dahirel, V., Normand, C., Bystricky, K., Victor, J.-M., Gadal, O., Bancaud, A., 2019. Rouse model with transient intramolecular contacts on a timescale of seconds recapitulates folding and fluctuation of yeast chromosomes. Nucl. Acids Res.https://doi.org/10.1093/nar/ gkz374.
Straight, A.F., Shou, W., Dowd, G.J., Turck, C.W., Deshaies, R.J., Johnson, A.D., Moazed, D., 1999. Net1, a Sir2-associated nucleolar protein required for rDNA silencing and nucleolar integrity. Cell 97, 245–256.https://doi.org/10.1016/S0092-8674(00) 80734-5.
Genetics 192, 107–129.https://doi.org/10.1534/genetics.112.140608.
Taddei, A., Schober, H., Gasser, S.M., 2010. The budding yeast nucleus. Cold Spring Harb. Perspect. Biol. 2, a000612.https://doi.org/10.1101/cshperspect.a000612. Tessarz, P., Santos-Rosa, H., Robson, S.C., Sylvestersen, K.B., Nelson, C.J., Nielsen, M.L.,
Kouzarides, T., 2014. Glutamine methylation in histone H2A is an RNA-polymerase-I-dedicated modification. Nature 505, 564–568.https://doi.org/10.1038/ nature12819.
Thattikota, Y., Tollis, S., Palou, R., Vinet, J., Tyers, M., D’Amours, D., 2018. Cdc48/VCP promotes chromosome morphogenesis by releasing condensin from self-entrapment in chromatin. Mol. Cell 69, 664–676.e5.https://doi.org/10.1016/j.molcel.2018.01. 030.
Thiry, M., Lafontaine, D.L.J., 2005. Birth of a nucleolus: the evolution of nucleolar compartments. Trends Cell Biol. 15, 194–199.https://doi.org/10.1016/j.tcb.2005. 02.007.
Tollervey, D., Lehtonen, H., Carmo-Fonseca, M., Hurt, E.C., 1991. The small nucleolar RNP protein NOP1 (fibrillarin) is required for pre-rRNA processing in yeast. EMBO J. 10, 573–583.
Trumtel, S., Léger-Silvestre, I., Gleizes, P.E., Teulières, F., Gas, N., 2000. Assembly and functional organization of the nucleolus: ultrastructural analysis of Saccharomyces cerevisiae mutants. Mol. Biol. Cell 11, 2175–2189.https://doi.org/10.1091/mbc.11. 6.2175.
Uchida, M., Sun, Y., McDermott, G., Knoechel, C., Le Gros, M.A., Parkinson, D., Drubin, D.G., Larabell, C.A., 2011. Quantitative analysis of yeast internal architecture using soft X-ray tomography. Yeast 28, 227–236.https://doi.org/10.1002/yea.1834. Uhlmann, F., Lottspeich, F., Nasmyth, K., 1999. Sister-chromatid separation at anaphase
onset is promoted by cleavage of the cohesin subunit Scc1. Nature 400, 37–42. https://doi.org/10.1038/21831.
Visintin, R., Hwang, E.S., Amon, A., 1999. Cfl1p prevents premature exit from mitosis by anchoring Cdc14 phosphatase in the nucleolus. Nature 398, 818–823.
Waminal, N.E., Pellerin, R.J., Kim, N.-S., Jayakodi, M., Park, J.Y., Yang, T.-J., Kim, H.H., 2018. Rapid and efficient FISH using pre-labeled oligomer probes. Sci. Rep. 8, 8224. https://doi.org/10.1038/s41598-018-26667-z.
Wang, D., Mansisidor, A., Prabhakar, G., Hochwagen, A., 2016a. Condensin and Hmo1
mediate a starvation-induced transcriptional position effect within the ribosomal DNA array. Cell Rep. 14, 1010–1017.https://doi.org/10.1016/j.celrep.2016.01.005. Wang, R., Kamgoue, A., Normand, C., Léger-Silvestre, I., Mangeat, T., Gadal, O., 2016b. High resolution microscopy reveals the nuclear shape of budding yeast during cell cycle and in various biological states. J. Cell Sci. 129, 4480–4495.https://doi.org/10. 1242/jcs.188250.
Wang, R., Mozziconacci, J., Bancaud, A., Gadal, O., 2015. Principles of chromatin orga-nization in yeast: relevance of polymer models to describe nuclear orgaorga-nization and dynamics. Curr. Opin. Cell Biol. 34, 54–60.https://doi.org/10.1016/j.ceb.2015.04. 004.
Wong, H., Arbona, J.-M., Zimmer, C., 2013. How to build a yeast nucleus. Nucleus 4, 361–366.https://doi.org/10.4161/nucl.26226.
Wong, H., Marie-Nelly, H., Herbert, S., Carrivain, P., Blanc, H., Koszul, R., Fabre, E., Zimmer, C., 2012. A predictive computational model of the dynamic 3D interphase yeast nucleus. Curr. Biol. 22, 1881–1890.https://doi.org/10.1016/j.cub.2012.07. 069.
Wutz, G., Várnai, C., Nagasaka, K., Cisneros, D.A., Stocsits, R.R., Tang, W., Schoenfelder, S., Jessberger, G., Muhar, M., Hossain, M.J., Walther, N., Koch, B., Kueblbeck, M., Ellenberg, J., Zuber, J., Fraser, P., Peters, J.-M., 2017. Topologically associating domains and chromatin loops depend on cohesin and are regulated by CTCF, WAPL, and PDS5 proteins. EMBO J. 36, 3573–3599.https://doi.org/10.15252/embj. 201798004.
Yang, C.H., Lambie, E.J., Hardin, J., Craft, J., Snyder, M., 1989. Higher order structure is present in the yeast nucleus: autoantibody probes demonstrate that the nucleolus lies opposite the spindle pole body. Chromosoma 98, 123–128.
Zhang, W., Zhao, G., Luo, Z., Lin, Y., Wang, L., Guo, Y., Wang, A., Jiang, S., Jiang, Q., Gong, J., Wang, Y., Hou, S., Huang, J., Li, T., Qin, Y., Dong, J., Qin, Q., Zhang, J., Zou, X., He, X., Zhao, L., Xiao, Y., Xu, M., Cheng, E., Huang, N., Zhou, T., Shen, Y., Walker, R., Luo, Y., Kuang, Z., Mitchell, L.A., Yang, K., Richardson, S.M., Wu, Y., Li, B.-Z., Yuan, Y.-J., Yang, H., Lin, J., Chen, G.-Q., Wu, Q., Bader, J.S., Cai, Y., Boeke, J.D., Dai, J., 2017. Engineering the ribosomal DNA in a megabase synthetic chro-mosome. Science 355.https://doi.org/10.1126/science.aaf3981.
![[PDF] Introduction au Logiciel tableur OpenOffice Calc | Cours informatique](data:image/gif;base64,R0lGODlhAQABAIAAAP///wAAACH5BAEAAAAALAAAAAABAAEAAAICRAEAOw==)