Assessing the Probability of Training
Image-Based Geological Scenarios Using Geophysical
Data
Thomas Hermans1,2, Jef Caers3 and Frédéric Nguyen1
1 University of Liege, Applied Geophysics, Chemin des Chevreuils 1, 4000 Liege, Belgium 2F.R.S.-FNRS Research Fellow, 3Stanford University, Department of Energy Resources
Engineering, 367 Panama Street, Stanford, CA 94305-2220 [email protected], [email protected], [email protected]
Abstract. The construction of training images (TIs) depicting the
geological prior is one of the most critical step in multiple-point statistics. Geophysical techniques may be used to reduce the uncertainty in the understanding of prior geological scenarios. We developed a methodology to verify the consistency of geophysical data with independently-built TIs. Synthetic geophysical models built from TI scenarios are compared, using multidimensional scaling, with inverted models from field surveys to check if TIs are consistent with geophysical models. Then, the probability of each TI scenario is computed. A cluster analysis enables to determine which parameters used in building the TIs are most impacting the geophysical response. The methodology is tested using ERT to analyze TI scenarios in the Meuse River alluvial aquifer (Belgium).
Keywords: Training Image, Multiple-Point Statistics, Geological
Scenarios, Geophysical Data
Refer to this paper as :
Hermans, T, Caers, J, & Nguyen, F. 2013. Assessing the Probability of Training Image-Based Geological Scenarios Using Geophysical Data. In E., Pardo-Iguzquiza, C., Guardiola-Albert, J., Heredia, L., Moreno-Merino, J. J., Dura, & J. A., Vargas-Guzman (Eds.), Mathematics of Planet Earth - Proceedings of the 15th Annual Conference of the International Association for Mathematical Geosciences, 679-682.
1 Introduction
A training image (TI) depicts the conceptual geological patterns and should be representative of the spatial heterogeneity. The construction of TIs is one of the most critical and important step of multiple-point statistics. If the geological context is generally known (e.g. alluvial aquifer), there remains in most cases considerable uncertainty on the characteristics of facies elements and on their relationships.
Geophysical methods may provide spatially distributed information on subsurface petrophysical properties, but due to their larger resolution, provide only indirect information on smaller scale features present in these TIs. In this work, we develop a methodology to verify the consistency of potential TIs with geophysical data. We demonstrate our proposed method in a case of electrical resistivity tomography (ERT) data within the context of the alluvial aquifer of the Meuse River in the area of Liege, Belgium.
2 Training Images as Geological Scenarios
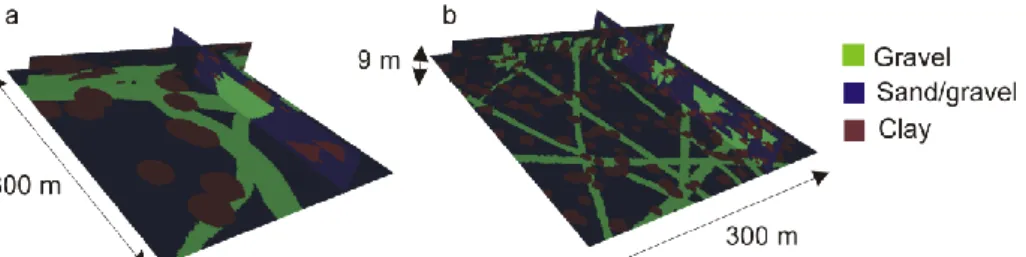
Based on prior knowledge of the alluvial system, we describe geological heterogeneity using three facies (gravel, gravel in a sandy matrix, and clay/silt). We assume that gravel is present in the form of channels whereas clay is present in the form of lobes or lenses. Borehole analyses provide a prior proportion for each facies. From prior geological understanding on alluvial systems [e.g. 1], we generate training images with three different sizes for channels and two different sizes for lobes (six different geological scenarios or training images) (Fig. 1).
Fig. 1. Two examples of the 6 training image-based geological scenarios. (a) Alluvial aquifer
with big gravel channels and big clay lobes. (b) Alluvial aquifer with small gravel channels and small clay lobes.
3 Evaluating Consistency with Geophysical Data
In each TI, we select randomly 12 sections (2D) and transform them into electrical resistivity models. Each facies is given a constant but uncertain electrical resistivity. Three different scenarios of resistivity distribution are offered to model this uncertainty. From these models, synthetic geophysical data sets (resistance data) are simulated. Next, these data sets are inverted with a least-square smoothness constraint algorithm to obtain TI-based inverted models. The inversion process causes loss of information inherent to geophysical methods. However, even if the models are smoothed, their specificity should still be apparent after inversion.
To verify the consistency of the TI-based inverted models, we compare them with two ERT inverted field datasets representative of the Meuse River alluvial aquifer. We calculate the Euclidean distance between any two inverted models (both TI-based and field-based) and visualize the results in a 2D space using multidimensional scaling (MDS) [2]. This represents about 60% of the total variance. The field data models fall among the distribution of the synthetic models on the MDS-map (Fig. 2A), hence the presented TIs provide geophysical models close to observed field models. TIs are thus consistent with the available geophysical data.
In a second step, we perform a cluster analysis on the MDS-map to highlight which parameters are most impacting the geophysical response. In cluster 1 and 3, where field models are located, small channels are more abundant, suggesting that this kind of training image is more consistent with field data (Fig. 2B). In contrast, the size of clay lobes (Fig. 2C) is not a sensitive parameter since the proportions of models with big lobes and small lobes are close to 0.5 in clusters 1 and 3.
Fig. 2. (a) Multidimensional scaling map of TI-based and field models zoned in six clusters.
(b) Proportion of models with big, medium and small gravel channels in each cluster. (c) Proportion of models with big and small clay lobes in each cluster.
4 Assessing Probability of Scenarios
Based on this analysis, the probability of each geological scenario in the case of field data response is computed through kernel smoothing of the densities of models in the 2D MDS-map [3]. The aim is to calculate, through Bayes’ rule, the probability P(Θ
= ϴi|D = d) of a TI-based scenario ϴi given specific geophysical data d, i.e. a model
of electrical resistivity in this example.
The likelihood of observing a specific geophysical data response d given a TI-based scenario ϴi, needed to apply Bayes’ formula, is computed through kernel
smoothing, where the kernel density estimation functions are approximated by a bivariate normal distribution using the coordinates of models of the 2D MDS-map.
The probability of each TI-based scenario is computed for the two selected ERT field models and shown in Table 1. The prior probability of each TI-based scenario is equal to 1/6, i.e. 0.1667. Scenarios with probabilities inferior to this value, e.g. scenarios with big channels, are less likely to occur. Geophysical data enable us to derive the most probable TI-based scenario for each particular field case: small channels and small lobes for the first; medium channels and big lobes for the second. Table 1. Conditional probabilities for the 6 TI-based scenarios according to two different true
field models based on the 2D-MDS map (BC=big channels, MC=medium channels, SC=small channels/ BL=big lobes, SL=small lobes).
Field data BC/BL BC/SL MC/BL MC/SL SC/BL SC/SL Field model 1 0.0472 0.1061 0.1618 0.0613 0.1951 0.4285
Field model 2 0.0157 0.1497 0.4259 0.0252 0.1624 0.2211
5 Conclusion and Perspectives
We developed a methodology to verify the consistency of TI-based geological scenarios with geophysical models. This requires the specification of realistic values for the considered geophysical parameters and the choice of an adapted distance calculation to compare models using multidimensional scaling. In this case, we chose the Euclidean distance between models, but any measure, or combination of measures, or other geophysical attributes could be used.
For a single geological scenario, if a field model falls in the distribution of synthetic models, we state that this scenario is consistent with geophysical information. If it is not the case, one should try different scenarios to obtain a consistent training image. For multiple scenarios, a sensitivity analysis can be carried
out through clustering to derive the most sensitive parameters. The probability of each geological scenario can be computed, giving some highlights for the selection of the best TI(s) to use for further simulations.
The methodology could be easily extended to 3D models, enabling to evaluate the consistency of more complex scenario. For example, it may be used to distinguish scenarios with channels from scenarios with elongated bars. However, it would require 3D field models which are more time consuming and more expensive to acquire.
If the consistency between TI and geophysics is confirmed, geophysical data may be further used as soft conditioning data in multiple-point statistics simulations or, the given training images and their posterior probabilities can be used on a Markov chain type inversion.
References
1. Gouw, M.J.P., Erkens, G.: Architecture of the Holocene Rhine-Meuse Delta (the Netherlands) – A Result of Changing External Controls. Geol. Mijnbouw-N. J. G., 86, 23--54 (2007)
2. Caers, J.: Modeling Uncertainty in the Earth Sciences, Wiley, Chichester (2011)
3. Park, H., Scheidt, C., Fenwick, D., Boucher, A., Caers, J.: History Matching and Uncertainty Quantification of Facies Models with Multiple Geological Interpretations. Comput. Geosci. In Press (2013). DOI: 10.1007/s10596-013-9343-5.