The threshold photoelectron spectroscopy of the cis- and trans- 1-chloro
2-fluoro-ethene isomers: an experimental and quantum chemical study
R Locht1, D Dehareng2 and B Leyh1
1
University of Liège, Department of Chemistry, Molecular Dynamics Laboratory, Institute of Chemistry, Bldg B6c, Sart-Tilman, B-4000 Liège 1, Belgium
2 University of Liège, Department of Life Sciences, Centre for Protein Engineering, Institute of Chemistry, Bldg B6a, Sart-Tilman, B-4000 Liège 1, Belgium
Abstract
The threshold photoelectron spectra (TPES) of the two vicinal isomers of the 1,2-C2H2FCl molecule have been
investigated in the 9-24 eV energy range using synchrotron radiation. Eight (for the cis-isomer) or nine (for the trans-isomer) bands have been observed and the corresponding ionization energies have been determined. The spectroscopic assignments are based on high level quantum chemical αb initio calculations for both isomers. Most of the observed spectral features could be interpreted. For both species the first three TPES bands exhibit a rich vibrational structure. Vibrational energies were determined and assignments were also supported by quantum chemical calculations of vibrational wavenumbers for these three ionic states of both isomers.
Keywords : synchrotron radiation ; threshold photoelectron spectroscopy ; quantum chemical calculations ; autoionization ; vibrational structure ; electronic excitation ; 1,2-C2H2FCl
1. Introduction
We reported recently on the threshold photoelectron spectrum (TPES) of the geminal 1,1-C2H2FCl
isomer measured using synchrotron radiation between 9.0 eV and 24.5 eV photon energy [1]. A detailed analysis of this spectrum was presented. The assignments were supported by quantum chemical calculations. In an earlier paper devoted to the three C2H2FCl isomers, Tornow et al [2] described the respective HeI (21.22 eV/ 58.4 nm)
and NeI (16.67-16.87 eV/74.37-73.58 nm) photoelectron spectra. The successive ionization energies were interpreted with the help of MNDO calculations. Assignments of the observed vibrational structures were proposed.
The aim of the present paper is to complete our previous work by reporting and analyzing the TPES of both cis- and trans- 1,2-C2H2FCl isomers in the 9.0-24.0 eV spectral region using synchrotron radiation. High
level ab initio quantum chemical calculations will support our analyses and assignments. 2. Experimental
2.1. Experimental setup
The experimental setup used in this work has already been described in detail previously [3]. Only the most salient features will be reported here.
Synchrotron radiation available from the BESSY facility (Berlin, Germany) was dispersed at the 3 m-NIM-2 beam line. This 3 m-NIM monochromator is positioned at a bending magnet front end. It is equipped with an Al/MgF2-grating with 600 lines per mm. The entrance and exit slits were adjusted between l00 µm and
200 µm.
For the TPES experiments the light beam is focused into an ion chamber, in the focussing plane of a tandem electron spectrometer consisting of two 180° electrostatic deflectors. This electron energy analyzer works at constant energy resolution, i.e., at constant pass energy PE = E0.
The samples of both cis- and trans-1,2-C2H2FCl were prepared in the laboratory as described earlier [2].
third passage to obtain the same purity. The boiling points are -4°C and 16°C respectively [2]. 2.2. Data handling and error estimation
As will be mentioned in the next sections, weak sharp peaks and diffuse structures are often superimposed on a strong continuum. To make the characterization of these features easier a continuum subtraction procedure has been applied. This method has already been used successfully in previous spectral analyses [4, 5]. For this purpose, the experimental curve is severely smoothed to simulate the underlying continuum which is then subtracted from the original spectrum. The smoothing procedure consists in filtering the experimental curve by fast Fourier transform (FFT). The weak features emerge from a remaining strongly attenuated background. The resulting diagram will be called ∆-plot in the forthcoming sections. This procedure is free from spurious structure generation. It is verified that the reverse operation consisting in the summation of the smoothed curve and the ∆-plot restores the original signal. Carbonneau [6] and Marmet [7] carefully established the validity of the method many years ago. Moreover, a detailed description of this data processing has been provided in a recent paper [1].
The wavelength calibration of the 3 m-NIM monochromator has been performed using the Ar absorption spectrum between the 2P3/2 and the 2P1/2 ionic states. The accuracy of this calibration is better than
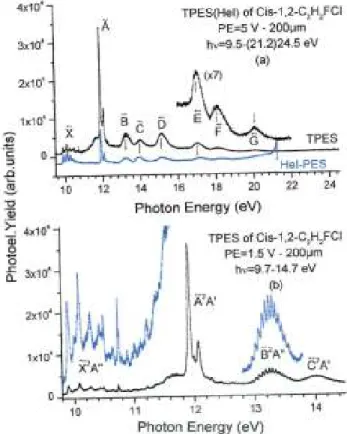
2meV. In the measurements between 9 eV and 24 eV photon energy, the TPES spectrum has been recorded with energy intervals of about 10 meV. The error on the energy position of a feature is estimated to be 6 meV. In the TPES spectra recorded between 9.5 eV and 14 eV an energy increment of 2 meV has been adopted. The error on the energy position of a feature is estimated to be of the order of 3 meV. This estimation is confirmed by the reproducibility of energy positions measured in different spectra recorded over several measurement sessions. Figure 1. (a) TPES of cis-l,2-C2H2FCl in the 9.8-24.5 eV photon energy range and HeI-PES normalized to the
vertical ionizing transition in the state. Vertical bars indicate vertical ionization energies, (b) TPES of cis- 1,2-C2H2FCl in the 9.8-14.5 eV photon energy range recorded with PE = 1.5 V and 2 meV increments.
3.1. The cis-1,2-C2H2FCl TPES
Figure 1(a) shows the TPE spectrum of cis-1,2-C2H2FCl recorded over a wide photon energy range, i.e.,
from 9.5 eV to 24.5 eV, and with 10 meV energy increments.
The upper limit was restricted by the grating transmission function as shown by the increase of the noise level from 23 eV upward.
Eight well-defined bands are observed and their vertical ionization energies are listed in table 1. A strong and broad band is detected at about 11.6 eV. This feature was not observed in the HeI-PES [2].
For comparison, the HeI-PES [2] is reproduced in the same figure, normalized to the intensity of the vertical transition in the first TPES band. The vertical ionization energies determined in the TPE spectrum are listed in table 1 together with the HeI- and NeI-PES results [2].
The TPES measured with increments of 2 meV between 9.7 eV and 14.7 eV is displayed in figure 1(b). The adiabatic (IEad) and vertical (IEvert) ionization energies related to the first three bands are listed in table 1.
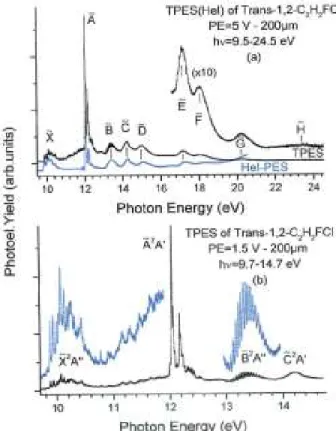
Figure 2. (a) TPES of trans-l,2-C2H2FCl in the 9.8-24.5 eV photon energy range and HeI-PES as normalized to
the vertical ionizing transition in the state. Vertical bars indicate vertical ionization energies, (b) TPES of trans- 1,2-C2H2FCl in the 9.7-14.5 eV photon energy range recorded with PE = 1.5 V and 2 meV increments.
Differences between the HeI-PES and the TPES have to be pointed out. Compared to the intensity of the -band of the ionic ground state at 10.086 eV, the relative intensities of the PES-bands related to the ionic excited states are modified by resonant autoionization in the TPES. A very long vibrational progression in the ground ionic state of cis-1,2-C2H2FCl shows up very clearly and exhibits a maximum intensity at about
11.6 eV. A considerable difference between the 1,1- [1] and the cis-1,2-isomers is the much less regular pattern of the vibrational intensity distribution observed between 10.6 eV and 11.8 eV in the latter spectrum.
3.2. The trans-1,2-C2H2FCl TPES
The TPES of the trans-1,2-C2H2FCl observed between 9.7 eV and 24.5 eV is displayed in figure 2(a)
together with the HeI-PES measured by Tornow et al [2].
Beside the narrow but very strong band at about 12 eV a series of seven weak bands are observed up to 21 eV photon energy. Above this energy a very weak band is observed at about 23.4 eV. Most of these bands seem to be structureless. The energy position of the maxima, corresponding to the IEvert values, are listed in table
1.
A better resolved TPES between 9.7 eV and 14.7 eV, with energy increments of 2 meV, is displayed in figure 2(b). The first three bands show sharp and fairly extended vibrational progressions. As already pointed out for the two other isomers, i.e. 1,1-C2H2FCl [1] and cis-1,2-C2H2FCl, an extended very irregularly structured
region is observed between 10.6 eV and 12.0 eV in the TPES whereas it is absent in the HeI-PES. The IEad and
IEvert ionization energy values are listed in table 1 for the first three bands.
Table 1. Adiabatic and vertical ionization energies (eV) measured by HeI-PES, NeI-PES [2] and by TPES using
synchrotron radiation for cis- and trans- 1,2-C2H2FCl.
a
Uncertainty ± 0.02 eV [2]. b
Uncertainty ± 0.006 eV, see section 2.2. c
Uncertainty ± 0.003 eV, see section 2.2. d
Misprinted in table 1 in [2] where 16.61 eV and 17.30 eV were listed. e
See figure S3 and section 5.1.1.
f
4. Ab initio calculations: methods and results 4.1. Computational tools
All the calculations were performed with the Gaussian 09 program [8]. The basis set used for all the calculations is aug-cc-pVDZ [9] containing polarization as well as diffuse functions.
The geometry optimization has been performed at the CCSD (FC) [10, 11] and M06-2X(DFT) [12] levels. The molecular orbital configuration of the cis- and trans-1,2-C2H2FCl in the Cs symmetry group is
described by
where the 1a' and 2a' are the first outer-valence shell orbitals. Vertical ionization energies of eight cationic states have been calculated at the CASSCF [13-15] level with the state average option, i.e. CAS(5,8) (2a", 9a', 3a'7/10a', 11a', 12a', 4a", 13a') and CAS(9,8) (7a', 8a', 2a", 9a', 3a'7/10a', 4a", 11a'). The geometry optimization of the
B
~
excited state was performed at the TDDFT level [16] using the M06-2X functional. As is usual forwavenumber values, a weight factor was applied and chosen to be the same as for B3LYP/ 6-31+G** (0.96) as given by Irikura et al [17]. These authors determined such scaling factors for a number of methods and basis sets but no scaling factor is available for the methods/basis set used in the present work. Thus the scaling factor for B3LYP/6-31+G** was chosen because the method provides rather similar geometrical and energy results as M06-2X and that, in the work by Irikura, the associated basis set was the closest to the one used in this work (with diffuse and polarization functions).
4.2. Results of the calculations
The results of the geometry optimization of the neutral ground state and of the cationic ground
X
~
2A”and first two excited states and
B
~
2A” are presented in table S1 (see supplementary data, available at stacks.iop.org/JPB/47/175101/mmedia) for both isomers according to the atomic numbering shown in the same table. Two different calculation levels are considered. In the literature, the calculation level which is considered as the most accurate is CCSD (FC), but the M06-2X is also recognized as a very good functional [10]. The two methods belong to different calculation frameworks: a wavefunction- or a density functional-approach, respectively. Since the electronic correlation is not parameterized in the first case, it provides results that are supposed to be less dependent on the nature of the molecular systems considered. The optimized geometries obtained by the present calculations on the ground state of cis- and trans-1,2-C2H2FCl can be
compared with those of the fairly recent theoretical work of Puzzarini et al [18].
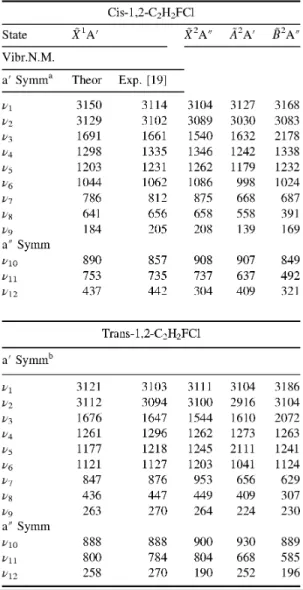
The vibrational wavenumbers calculated for the neutral ground state of cis- and trans-1,2-C2H2FCl are listed in table 2 and are compared with infrared and Raman spectroscopic data reported by Craig et
al [19]. These experimental values have been remeasured and confirmed more recently for v4, v6 and v6 +v9 with
high accuracy by infrared laser spectroscopy [20].
The vibrational modes characterizing the cis-1,2-C2H2FCF cationic ground state and the first
two excited states and of the molecular ion are represented in figure S1 (see supplementary data, available at stacks.iop.org/JPB/47/175101/mmedia). For the latter two states only those normal modes differing from the ionic ground state are shown. Essentially, the v1 and v2 normal modes become more localized in the
(figure S1b) and (figure S1c) excited states. In the state this is also the case for the v10 and v11
modes. It has to be observed that in the latter state the C16-C1 internuclear distance becomes very large (dashed line in figure S1c).
The vibrational motions in the trans-1,2-C2H2FCl+ cationic ground state are represented in figure
S2a. In the first excited state v5 and v6 are inverted as well as v10 and v11 as shown in figure S2b, whereas
v1,v2 and v11 become essentially local modes. In the excited state the v1 and v2 are nearly local modes
Table 2. Wavenumbers (cm-1) related to the vibrational normal modes of cis- and trans-1,2-C2H2FCl in their
ground state and of cis- and trans-1,2-C2H2FCl +
in their ground and two first excited and states calculated at the M06-2X level. The wavenumbers are corrected using the recommended scaling factor of 0.96 (see text).
a
The respective vibrational motions of the neutral and cation ground state are very similar and are represented in figure S 1a.
The modified v1 and v2 modes in the first excited ionic state and v1,v2,v10and v11 in the second excited ionic state are drawn in figure S1b and S1c successively.
b
The respective vibrational motions of the neutral and cation ground state are very similar and are represented in figure S2a. The modified v5,v6,v10 and v11 modes in the first excited ionic state and v1,v2,v5 and v6 in the second excited ionic state are drawn in
figure S2b and S2c.
Table 2 lists the scaled theoretical wavenumbers of the twelve vibrational modes for both the cis- and
trans-cation.
The vertical ionization energies (IEvert) of the cis- and trans-1,2-C2H2FCl calculated at two CASSCF
levels and at the TDDTF level are listed in table S2, together with their corresponding MO main configurations. Several ionization energies are described by doubly excited (ionization/excitation) configurations. Vertical and adiabatic (IEad) ionization energies were also determined at the CCSD (FC) and M06-2X level for the ground
and first excited states of the cation. They are mentioned in table S2 (see supplementary data, available at stacks.iop.org/JPB/47/175101/mmedia).
5. Discussion
5.1. The threshold photoelectron spectra (TPES) between 9.5 eV and 24.5 eV
5.1.1. The cis-1,2-C2H2FCl isomer (see figures 1(a) and S3). All the calculation levels agree to assign the first
three PES bands, displayed in figure 1(a) (see also table 1 for the experimental values of the adiabatic and vertical ionization energies), to the ionization from the 3a", 9a' and 2a" MO successively (see table S2). The corresponding ionic states are therefore , and respectively.
The different calculation levels provide a lowest IEvert value between 9.84-10.85 eV (see table S2)
which has to be compared with the experimental IEvert= 10.086±0.003 eV. The experimental adiabatic IEad =
9.896±0.003 eV agrees well with the calculated values of 9.69 eV (CCSD) and 9.75 eV (M06-2X).
The first excited state of the ion is assigned to the ionization of the 9a' MO. IEvert energy values of
11.49-12.36 eV are provided by the different calculations. These theoretical values have to be compared with the corresponding experimental IEvert= 11.920±0.003 eV, which corresponds also in this case to the adiabatic
ionization energy.
The second excited state of the cis-l,2-C2H2FCl +
molecular ion is observed at IEad= 12.904±0.003 eV
and IEvert= 13.245±0.003 eV. The vertical ionization energy value has to be compared with 12.85-13.83 eV
obtained at different calculation levels (see table S2).
The bands observed above 14 eV in the HeI-, NeI-PES and the TPES appear as broad smooth continua with no or almost no vibrational structure, as confirmed by the subtraction procedure applied to the 14-18 eV energy range (figure S3) (see supplementary data, available at stacks.iop.org/JPB/47/175101/mmedia). The vertical ionization energies are listed in table 1.
In the apparent gap between 15.8 eV and 16.8 eV the -plot in figure S3 suggests the likely presence of two overlapping bands embedded in the background of the TPES. Their IEvert would be measured at 16.14 eV
and 16.38 eV successively. We discuss their interpretation and assignment in the following, based on our αb
initio calculation results.
As far as simple ionization (one-electron) processes are concerned, the CAS(5,8) calculations lead to only the first three ionic states ( and ). The ionization energies associated with the removal of one electron from the 8a' and 7a' orbitals are provided by the CAS(9,8) calculations (see table S2). The TDDFT calculations lead additionally to the (6a')-1 ionization energy. Only TDDFT provides quantitative agreement with the experimental IEvert values of 14.02 eV ((8a')
-1
) and 15.15 eV ((7a')-1) (see table S2). The (6a')-1 ionization energy calculated at 16.42 eV at the TDDFT level might therefore correspond to one of the two experimental values of 16.14±0.02eV and 16.38±0.02 eV.
Concerning the doubly excited states, the analysis of the detailed theoretical data provided in table S2 leads us to the following conclusions. The TDDFT, CAS(5,8) and CAS(9,8) methods agree that the state with the main configuration ... (6a')2 (7a')2 (8a')2 (2a")2 (9a')2 (4a")1 appears first, around 16eV, while the ,..(6a')2 (7a')2 (8a')2 (2a")2 (9a')2 (10a')1 state lies around 17 eV. The first state might correspond to one of the two ionization energies detected in the 16.1-16.5 eV range. We assign the band around 17 eV to the second of these doubly excited states.
Tornow [20] and Kaufel [21] investigated the ionization and dissociation of cis-1,2-C2H2FCl by
photoionization mass spectrometry using synchrotron radiation between 9-20 eV and dissociative electroionization [22]. They showed that about 95% of the total ionization at 20 eV appears already as parent and fragment ions below 17.40 eV. The lowest appearance energy (AE) is measured at 12.76 eV for the C2H2F
+
. This fragment represents 45% of the total ionization at 20 eV photon energy whereas the intensity of the molecular ion is 14% at the same energy. This AE is significantly below the IEad ( ) = 12.958 eV (see table 1).
Dissociative autoionization is likely involved in the C2H2F +
dissociation channel. In the 13.34-14.63 eV region corresponding to the ionic states, most of the other halogenated fragment ions are generated. 5.1.2. The trans-1,2-C2H2FCl isomer (see figures 2(a) and S4). The TPES of the trans-1,2-C2H2FCl is
presented in figure 2(a) in the 9.5-24.5 eV photon energy range. The comparison is made with the HeI-PES reported earlier [1]. The adiabatic and vertical ionization energies measured in these two spectra are listed in
table 1. As observed in figure 2(b), only the first three TPES bands clearly exhibit vibrational structure.
In agreement with all calculation levels the first three PES bands are assigned to the ionization from the 3a". 9a' and 2a" MO successively leading respectively to the and ionic states.
The different calculations provide the first IEvert values between 10.00-10.97 eV (see table S2). The
vertical value calculated at the CCSD and M06-2X levels compare well with the experimental
The experimental adiabatic 9.876±0.003 eV is well
accounted for by the calculations, that is, 9.67 eV (CCSD) and 9.73 eV (M06-2X).
Figure 3. ∆-plot of the TPES of cis-1,2-C2H2FCl on expanded energy scales: (a) 9.8-10.8 eV, (b) 11.8-12.6 eV
and (c) 12.8-13.8 eV. Vertical bars indicate vibrational progressions.
The comparison of the calculation results for the cis- and trans-isomers (table S2, figures S3 and S4) (see supplementary data, available at stacks.iop.org/JPB/47/175101/mmedia) shows that the ionization energies of the different states (one-electron ionization and satellite states) are very similar, with the exception that the state corresponding to ionization from the 7a' orbital did not appear in the CAS(9,8) results. Accordingly, and relying on the fact that TDDFT is closer to the experimental values than the CAS values, we propose similar assignments for the trans-isomer.
The fourth and fifth photoelectron bands are assigned successively to the removal of one electron from the 8a' (IEvert= 14.22 eV), and from the 7a' (IEvert= 14.95 eV) orbitals. The sixth and seventh bands (experimental
IEvert= 15.95 and 16.35 eV) are respectively assigned to a satellite state (removal of one electron from 3 a"
together with 3 a" →4a" excitation) and to one-electron ionization from the 6a' orbital. The TDDFT predictions are, respectively, 16.16 and 16.43 eV. The eighth band (experimental IEvert= 17.12 eV) is also assigned to a
satellite state (ionization from 3a" and 3a" → 10a' excitation) (IEvert= 16.76 eV in TDDFT).
One point to address here is the observation of a shoulder in the fourth band around 14.5 eV, which clearly appears as a separate band in the -plot (figure S4) (see supplementary data, available at
stacks.iop.org/JPB/47/175101/mmedia). This does not correspond to any theoretically predicted electronic state of the cation. We propose as a possible explanation that the upper part of the potential energy hypersurface of the
state is populated by autoionization.
At higher photon energy three weak PES bands are observed with decreasing intensity. They are characterized by maxima at 18.05 eV, 20.18 eV and 23.39 eV successively.
Starting with the state, almost all TPES bands appear as continua. Tornow [20] and Kaufel [21] investigated the ionization and dissociation of trans-1,2-C2H2FCl by photoionization mass spectrometry using
synchrotron radiation between 9 eV and 20 eV and dissociative electro-ionization [22]. As for the two other isomers, these authors [20-22] show that more than 97% of the total ionization at 20 eV arises as parent and fragment ions below 17.40 eV. The lowest onset energy (AE) is measured at 12.74 eV for the C2H2F
+
fragment representing 47% of the total ionization at 20 eV whereas the intensity of the molecular ion is 12% at the same energy. This AE is significantly below the (see table 1) so that dissociative autoionization in the C2H2F
+
dissociation channel is probable. In the 13.37-14.7 eV region corresponding to the ionic states, most of the other halogenated fragment ions are generated.
For both isomers, only TPEPICO experiments could provide a more detailed view and a quantitative insight of the dissociation dynamics.
5.2. The TPES between 9.5-14.5 eV 5.2.1. The cis-1,2-C2H2FCl isomer
5.2.1.1. The TPES band (see figures 1(b) and 3(a)). The TPES of the band of cis-1,2-C2H2FCl is
shown in figure 1(b) between threshold and 10.8 eV photon energy as recorded with 2 meV increments. The pattern and shape of the band in the TPES of cis-1,2-C2H2FCl is quite different from that of the X2A"
observed in 1,1-C2H2FCl [1].
To enhance the weak structures in this first band, the subtraction method has been applied (see section 2.2) (figure 3(a)). Their energy positions are listed in table 3.
The main vibrational structure starts at IEad = 9.896±0.003 eV. This IE has to be compared to the values
determined by HeI- and NeI-PES, i.e. 9.870±0.010 eV [2], and by mass spectrometric photoionization using synchrotron radiation (9.89 eV) [20, 21]. The energy of 10.086±0.003 eV corresponds to the vertical ionization energy and can be compared with 10.02 eV and 10.03 eV measured by HeI-PES and NeI-PES respectively [2] (see table 1).
The major progression in the ground state of 1,2-C2H2FCl +
corresponds to a vibrational energy hcω0 = 189±3 meV (1524±24cm
-1
). The experimental wavenumber can be compared unambiguously with that predicted by αb initio calculations at ω3 =1540 cm
-1
(see table 2). The v3 normal mode corresponds to the C = C
stretching motion with H-C bending (see figure S la). This is compatible with the dominant π character of the 3a" MO.
About midway between the peaks of the major progression a weaker signal is observed at an average energy of 106±4 meV (856 ±32 cm-1) (see table 3). This value can be compared with ω7 = 875 cm
-1
predicted by the present calculations. This wavenumber is assigned to v7 and corresponds mainly to CH bending (see figure S
la).
Weak signals are measured in this band at very reproducible intervals of 82±2 meV (661 ± 16 cm-1) (see table 3). Only v = 1 and 2 are observed. Also in this case, the experimental value could be compared with the wavenumber calculated at 658 cm-1 and corresponding to v8 i.e. a complex vibrational motion affecting all angles
(see figure S1a).
Finally, very weak additional progressions of 4-7 vibrational quanta could be observed between the major peaks. The corresponding energy spacing is 21±3 meV (169 ± 24 cm-1). This vibrational energy compares well with the predicted wavenumber at 208 cm-1 for v9 (see table 2 and figure S1a).
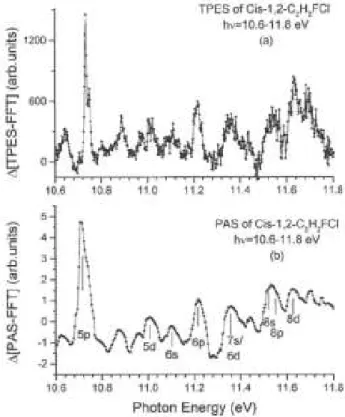
5.2.1.2. The photon energy region between the and bands (see figure 4). Whereas in the 10.6-11.8 eV photon energy range no photoelectron signal is detected by HeI-PES (see figure 1(a)), a strong TPES signal is observed. Its intensity is even higher between 11.4eV and 11.8 eV than that observed for the band. It displays a rather complex structured pattern. The -plot of the TPES has been reproduced in figure 4(a) between 10.6 eV and 11.8 eV, together with the ∆-plot of the low resolution vacuum UV PAS (figure 4(b)) [2]. The high degree of correlation between the two types of spectra is very convincing as also shown in table S3 (see supplementary data, available at stacks.iop.org/JPB/47/175101/mmedia). The interpretation and assignments of the structure in the vacuum UV photoabsorption spectrum (PAS) are included in figure 4(b) and table S3. This part of the PAS was assigned to the electronic and vibrational excitation of np, nd and ns Rydberg series. They all converge to the cationic state [2].
Figure 4. -plot of the (a) TPES and (b) the PAS of cis-1,2-C2H2FCl in the 10.6-11.8 eV photon energy region.
Vertical bars in the latter spectrum indicate the energy positions of identified Rydberg states [2].
The strong correlation suggests that the identified Rydberg states autoionize resonantly giving rise to 'zero kinetic energy' (ZEKE) photoelectrons. The analysis of the structures starting at 10.734 eV reveals a regular spacing of about 120±8 meV (968±64 cm-1). These structures could likely correspond to highly excited vibrational levels of the ionic ground state accessed through autoionization. It is possible that they correspond to the higher excitation of the v3 normal mode, with a slight propensity to decreased energy spacing due to
anharmonicity.
5.2.1.3. The and the TPES bands (see figures 1(b), 3(b) and (c)). The photon energy region of 11.8-12.6 eV is shown in figure 1(b) on an expanded energy scale. It shows a fairly strong band exhibiting also sharp but weak structures with
The resulting -plot (see section 2.2) for the region between 11.96 eV and 12.60 eV is displayed in figure 3(b). The positions in energy of these features are listed in table 4 together with earlier HeI- and NeI-PES data reported by Tornow et al [2].
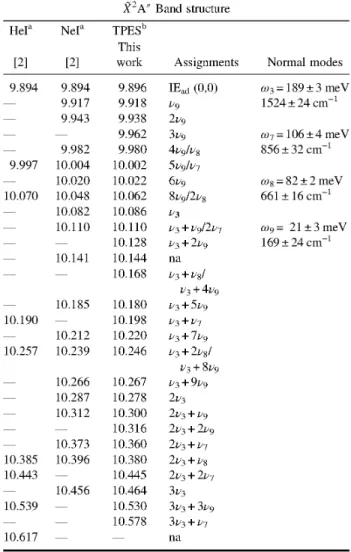
Table 3. Energy positions (eV) of the structures observed in the HeI-, NeI- PES and TPES of the state of cis-1,2-C2H2FCl
+
. Assignments and experimental vibrational energies/wavenumbers (eV cm-1) are listed. Conversion 1 eV = 8065.545 cm-1 [24].
a
Estimated uncertainty: ±0.010 eV b
Estimated uncertainty: ±0.003 meV (see section 2.2).
The TPES band shows a very short progression, compatible with the ionization from a non-bonding molecular orbital, with 155±4 meV (1250±32 cm-1) spacing. Compared to the results of the ab initio calculations presented in this work, this wavenumber corresponds to the ν4 vibrational mode predicted at 1242
cm-1 (see table 2). This vibration involves the in-plane CH bending (see figure S la). Combinations with ν7 and
ν8 characterized by 85± 4 meV (685±32 cm -1
) and 64±3 meV (516 ± 24 cm-1) respectively are also observed. These wavenumbers compare with those predicted at 668 cm-1 and 558 cm-1 respectively (see table 2).
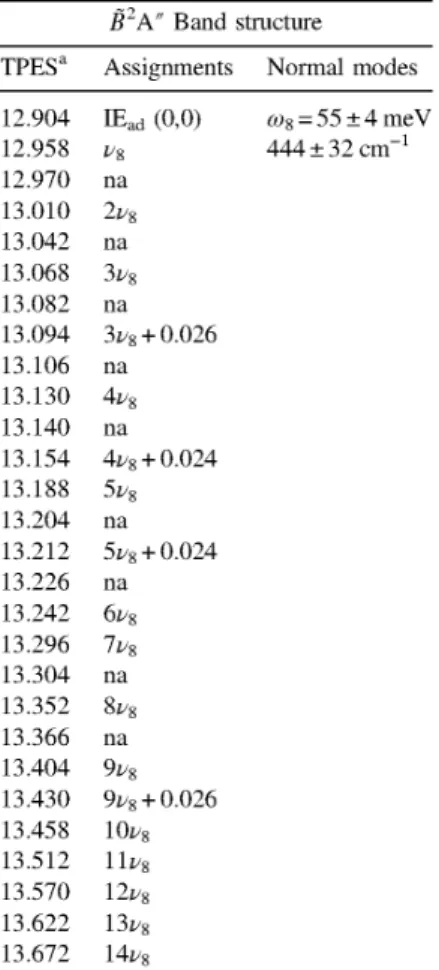
The ionic state extends from 12.9 eV to 13.7 eV. The is measured at
12.904±0.003 eV. The maximum intensity is observed at IEvert= 13.245 eV, in agreement with the HeI-(13.244
eV) results [2]. Contrarily to the TPES of 1,1-C2H2FCl, the band exhibits a well defined and extended
vibrational structure (see figure 3(c)). The energy positions of the features are listed in table 5.
The progression observed in figure 3(c) exhibits numerous asymmetric peaks broadened at the high energy side. The observed regular progression displays an average energy of hcω = 55±4 meV (444 ± 32 cm-1) compatible with the predicted value for v8 at 391 cm
-1
corresponding to a complex in-plane deformation (see figure S1a).
Table 4. Energy positions (eV) and assignments of the, structures observed in the HeI-, NeI-PES and TPES of
the band of the cis-1,2-C2H2FCl +
cation.
a
Estimated uncertainties ±0.010 eV [2]. b
Estimated uncertainties ±0.003 eV (see section 2.2).
Table 5. Energy positions (eV) and assignments of the structures observed in the TPES of the B2A" band of the cis-1,2-C2H2FCl
+
cation. Conversion 1 eV = 8065.545 cm-1 [24].
Figure 5. -plot of the TPES of trans-1,2-C2H2FCl on expanded energy scales: (a) 9.5-10.8 eV, (b) 11.9-12.8
eV and (c) 13.0-14.0 eV. Vertical bars indicate vibrational progressions.
5.2.2. The trans-1,2-C2H2FCl isomer.
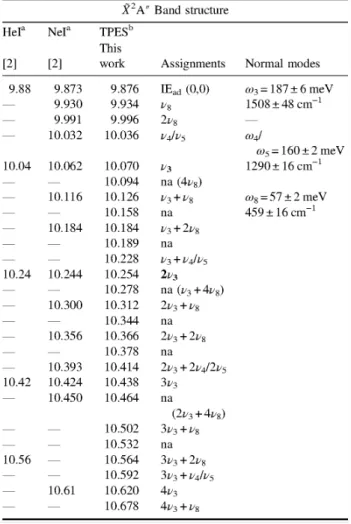
5.2.2.1. The TPES band (see figures 2(b) and 5(a)). The TPES of the band of trans-1,2-C2H2FCl is
shown in figure 2(b) between 9.7 eV and 10.8 eV photon energy. Its pattern is quite different and more complex than that of the corresponding band in the two other isomers (see [1] and section 5.2.1.1 in the present work).
The ∆-plot is shown in figure 5(a). The energy positions are listed in table 6 and compared with previous measurements [2].
The strongest vibrational structure starts at IEad = 9.876±0.003 eV. It has to be compared to the value
obtained by HeI- and NeI-PES, i.e. at 9.88±0.010 eV and 9.86±0.010 eV [2] respectively. A weak signal observed at 9.820 eV (at 9.814 eV in NeI-PES) is assigned to a hot band. The neutral vibration involved could be the ν8 mode with ω8 = 450cm
-1
estimated in this work and observed at 447 cm-1 by infrared spectroscopy [19]. An IEad = 9.86eV has been measured by mass spectrometric photoionization using synchrotron radiation [21,
22]. The energy of 10.086±0.003 eV corresponds to the vertical ionization energy and has to be compared with 10.05 eV measured by HeI-PES and NeI-PES respectively [2].
The major progression observed in the ground state of trans-1,2-C2H2FCl +
is characterized by a vibrational energy hcω0 = 187±6 meV (1508±50 cm
-1
). Ab initio calculations predict ω3 = 1544 cm -1
(see table 2) corresponding to the C=C stretching motion with H-C bending (see figure S2a).
The pattern of the decreasing signal intensity observed between 9.87 eV and 10.2 eV consists of a regular progression with an average spacing of 57±2 meV (459±16 cm-1) (see table 6). This value should correspond to ω8 = 449 cm
-1
predicted by the present calculations and corresponding to the CX (X = F and Cl) bending (see figure S2a). As shown in table 6, a number of structures could not be assigned. However, a few of these show regular intervals of 210-220 meV. These might be very tentatively assigned to 4ν8 (in parentheses in
Table 6. Energy positions (eV) of the structures observed in the HeI-, NeI-PES and TPES of the state of
trans-1,2-C2H2FCl +
. Assignments and experimental vibrational energy/wavenumbers (eV/cm-1) are listed. Conversion 1 eV = 8065.545 cm-1 [24].
a
Estimated uncertainty: ±0.010 eV b
Estimated uncertainty: ±0.003 meV (see section 2.2)
In this band weak signals are measured at reproducible intervals of 160±2meV (1290±16 cm-1) (see table 6). This experimental value is compatible with two wavenumbers calculated at 1245 cm-1 and 1203 cm-1 corresponding to ν4 and ν5 respectively, and associated with CH-bending motions (see figure S2a and S2b).
5.2.2.2. The photon energy region between the X and À bands (figure 6). As already observed for the 1,1- [1] and the cis-1,2-C2H2FCl (see section 5.2.1.2 in this work) isomers, a strong TPE signal has been detected
between 10.4 eV and11.8 eV. It displays an erratic pattern as enhanced by the ∆-plot of this energy range (see figure 6(a)).
The corresponding ∆-plot of the low resolution vacuum UV PAS of trans-1,2-C2H2FCl [2] has been
reproduced in figure 6(b) in the same energy range. The TPES intensity distribution reproduces very well the PAS. This strong correlation is confirmed by the energy positions listed in table S4 (see supplementary data, available at stacks.iop.org/JPB/47/175101/mmedia).
This observation suggests that resonant autoionization of excited Rydberg states produces threshold photoelectrons. This process populates the upper part of the potential hypersurface of the cationic state. However, the vibrationally resolved constant ion state (CIS) spectroscopy of the two most intense vibrational levels in the ionic states (at 10.070 eV and at 10.254 eV) clearly show that several Rydberg states involved in TPE production also autoionize by producing non-zero photoelectrons.
5.2.2.3. The and the TPES bands (see figures 2(b), 5(b) and (c)). The photon energy region of 12.0-12.8 eV, displayed in figure 2(b) on an expanded energy scale, shows a strong band exhibiting narrow and sharp structures. The adiabatic ionization energy of this band is observed at 12.038 ± 0.003 eV.
The corresponding ∆-plot is displayed in figure 5(b). The energies of these features are listed in table 7 together with earlier data [2].
The TPES band shows a short progression with 128±6meV (1032±48 cm-1) spacing. This energy corresponds to the ν6 vibrational mode whose wavenumber is predicted at 1041 cm-1 involving the in-plane CH bending (see figure S4). Combined excitations are observed with v7 and v9, with wavenumbers of 90±5 meV
(725±40 cm-1) and 23±3 meV (185±24 cm-1) respectively. These values are compatible with the predicted wavenumbers at 656 cm-1 and 224 cm-1 respectively. The shoulder at 12.004±0.003 eV has to be assigned to a hot band corresponding to the excitation of v9 in the neutral molecule. The measured wavenumber of 275 cm-1 is
in good agreement with the infrared value of 270 cm-1 [19].
The ionic state extends from 13 eV to 14 eV. The IEad is observed at 13.036±0.003 eV and its
maximum intensity occurs at IEvert= 13.302±0.003 eV in agreement with the HeI- (13.309 eV) results [2]. As in
the TPES of cis-1,2-C2H2FCl, the band exhibits a well-defined and extended vibrational structure (see
figure 5(c)). The energy position of the features is listed in table 8.
The observed long regular progression corresponds to the excitation of a single vibrational mode with an average energy of hcω = 45±2 meV (361±16 cm-1), which is compatible with the value of 307 cm-1 predicted for v8 corresponding to a C=C-H angle deformation and a C-Cl stretching vibrational motion (see table 2 and
figure S2a). This value is also in good agreement with the earlier value of 46±4 meV (367±32 cm-1) reported by Tornow et al [2]. Though this progression has been observed up to v = 18, no anharmonicity could be detected.
Table 7. Energy positions (eV) and assignments of the structures observed in the HeI-, NeI-PES and TPES of the band of the trans-1,1-C2H2FCl+ cation.
a
Estimated uncertainty: ±0.010 eV b
Estimated uncertainty: ±0.003 meV (see section 2.2).
Table 8. Energy positions (eV) and assignments of the structures observed in the TPES of the band of the
trans-1,2-C2H2FCl + cation. Conversion 1 eV = 8065.545 cm-1 [24]. a Estimated uncertainty: ±0.010 eV b
6. Conclusions
The TPES of the two 1,2-C2H2FCl isomers have been measured using synchrotron radiation. Eight (for
the cis-isomer) and nine (for the trans-isomer) photoelectron bands have been detected between the lowest adiabatic ionization energy and 24 eV photon energy. The description and assignment of most of these bands were supported by quantum chemical calculations. Besides singly ionized states, doubly excited configurations were assigned.
After the investigation of the 1,1- [1] and the 1,2-C2H2FCl isomers presented in this work, we now
summarize and compare the main features of their TPES. The overall pattern of the spectra is quite similar for the three compounds. Between the ground state and the first excited state of the molecular ion they all exhibit a strong TPE contribution which is ascribed to resonant autoionization of Rydberg states.
Table 9. Summary of the dominant characteristics (vibrational normal modes, their wavenumber and ionization
energies) related to the first three ionic states of the three C2H2FCl isomers.
a
For the 1,1-C2H2FCl isomer see Nielsen JR and Albright JC 1957 J. Chem. Phys. 26 1566 and for the 1,2-cis- and 1,2-trans-C2H2FCl isomers see [19].
b
For the 1,1-C2H2FCl+ data see [1].
Only the three lowest energy bands show quite large differences. The first two bands show a rich and extensive vibrational structure. The third band of the 1,1-isomer is continuous whereas it displays a dense structure for both 1,2-isomers. For each of these bands, vibrational wavenumbers were measured and compared to our quantum chemical results, with generally a good correlation. Table 9 summarizes the most salient features observed and measured in the TPES of the three compounds. The wavenumber characterizing selected vibrations as observed in the ground state of the neutral molecules has been added. The wavenumber associated with the C=C stretching (v3) is quite constant for the three neutral isomers. Contrarily, the 1,1-molecular ion shows quite
large differences with respect to its 1,2-isomers.
The IEad of the ground state of the molecular ion corresponds to ionization from the 3a"
(π-character) MO and is the highest for the 1,1-isomer. For all three compounds, the major vibrational progression has been assigned to v3 corresponding mainly to C=C stretching and C-H bending. The 1,1-isomer shows the
lowest wavenumber.
The first excited state corresponding to ionization from the 9a' MO exhibits the largest differences between the three isomers. The band shows a fairly extended vibrational progression in the 1,1-isomer, whereas it appears strong and short in the two other compounds. Quite different wavenumbers are measured. In the former the CH2 in-plane rocking and C-F and C-Cl stretching (v7) is the most strongly excited vibration. In
the two latter isomers the CH in-plane bending is excited in both cases. The difference between the excitation of
v4 or v6 is likely related to the geometry of the two species.
The second excited state corresponds to ionization from the 2a" MO, leading to a continuous, structureless band for the 1,1-isomer. Contrarily, for the 1,2-species a single very long vibrational progression of ν8 is observed corresponding in both cases to a combination of C-Cl stretching with the HC=CHF frame
Acknowledgments
We are indebted to the University of Liège for financial support. RL and BL gratefully acknowledge the
European Community for its support through its TMR (Contract EU-HPRI-1999CT-00028) and I3 (Contract R II 3 CT-2004-506008). DD's contribution was supported by the Belgian programme on Interuniversity Attraction Poles of the Belgian Science Policy (IAP n°P6/19).
References
[1] Locht R, Dehareng D and Leyh B 2014 J. Phys. B: At. Mol Opt. Phys. 47 085101 [2] Tornow G, Locht R, Kaufel R, Baumgärtel H and Jochims H-W 1990 Chem. Phys. 146 115 [3] Locht R, Leyh B, Hottmann K and Baumgärtel H 1997 Chem. Phys. 220 217
[4] Locht R, Leyh B, Hoxha A, Dehareng D, Jochims H-W and Baumgärtel H 2000 Chem. Phys. 257 283 [5] Locht R, Leyh B, Denzer W, Hagenow G and Baumgärtel H 1991 Chem. Phys. 155 407
[6] Carbonneau R, Bolduc E and Marmet P 1973 Can. J. Phys. 51 505 Carbonneau R and Marmet P 1973 Can. J. Phys. 51 2202 1974 Phys.
Rev. A 9 1898
[7] Marmet P 1979 Rev. Sci. Instrum. 50 79 and references therein
[8] Frisch M J et al 2009 Gaussian 09, Revision A.02 (Wallingford, CT: Gaussian) [9] Dunning T H Jr 1989 J. Chem. Phys. 90 1007
[10] Cizek J 1969 Adv. Chem. Phys. 14 35
[11] Scuzeria G E and Schaefer H F III 1989 J. Chem. Phys. 90 3700 [12] Zhao Y and Truhlar D G 2008 Theor. Chem. Ace. 120 215 [13] Hegarty D and Robb M A 1979 Mol Phys. 38 1795 [14] Eade R H E and Robb M A 1981 Chem. Phys. Lett. 83 362
[15] Bernardi F, Bottini A, McDougall J J W, Robb M A and Schlegel H B 1984 Faraday Symp. Chem. Soc. 19 137 [16] Van Caillie C and Amos R D 2000 Chem. Phys. Lett. 317 159
[17] Irikura K K, Johnson R D III and Kacker R N 2005 J. Phys. Chem. A 109 8430 [18] Puzzarini C, Cazzoli G, Gambi A and Gauss J 2006 J. Chem. Phys. 125 054307 [19] Craig N C, Lo Y-S, Piper L G and Wheeler J C 1970 J. Phys. Chem. 74 1712
[20] Stoppa P, Pietropolli C A, Giogianni S and Ghersetti S 2000 Phys. Chem. Chem. Phys. 2 1649 Stoppa P, Giorgianni S, Visinoni R and Ghersetti S 1999 Mol Phys. 97 329
[21] Tornow G 1981 Diplomarbeit Freie Universität Berlin, Berlin [22] Kaufel R 1985 PhD Dissertation Freie Universität Berlin Berlin [23] Tornow G 1986 PhD Dissertation Freie Universität Berlin Berlin
![Table 1. Adiabatic and vertical ionization energies (eV) measured by HeI-PES, NeI-PES [2] and by TPES using synchrotron radiation for cis- and trans- 1,2-C 2 H 2 FCl](https://thumb-eu.123doks.com/thumbv2/123doknet/5886781.143860/4.918.314.605.407.983/table-adiabatic-vertical-ionization-energies-measured-synchrotron-radiation.webp)