En vue de l'obtention du
DOCTORAT DE L'UNIVERSITÉ DE TOULOUSE
Délivré par :Institut National Polytechnique de Toulouse (Toulouse INP) Discipline ou spécialité :
Dynamique des fluides
Présentée et soutenue par :
M. ALBERTO JORGE VALENCIA NAVARRO le lundi 20 janvier 2020
Titre :
Unité de recherche : Ecole doctorale :
Micro-scale study of the first stage of cake formation for the microfiltration
of model particle and yeast suspensions: In-situ and real-time experimental
approach
Mécanique, Energétique, Génie civil, Procédés (MEGeP)
Laboratoire d'Ingénierie des Systèmes Biologiques et des Procédés (LISBP) Directeur(s) de Thèse :
M. PHILIPPE SCHMITZ
MME CHRISTINE LAFFORGUE-BALDAS
Rapporteurs :
M. JOSE TEIXEIRA, UNIVERSITE DE MINHO BRAGA Mme JULIE MENDRET, UNIVERSITE DE MONTPELLIER
Membre(s) du jury :
Mme MARTINE MEIRELES, CNRS TOULOUSE, Président M. JEFFREY MORRIS, CITY COLLEGE OF NEW YORK, Invité Mme CHRISTINE LAFFORGUE-BALDAS, INSA TOULOUSE, Membre
Mme MELANIE JIMENEZ, UNIVERSITY OF GLASGOW, Membre M. PHILIPPE SCHMITZ, INSA TOULOUSE, Membre
M. PIERRE JOSEPH, CNRS TOULOUSE, Invité
A mi familia: A Mamá, su amor y dedicación… Sin lugar a dudas la persona más fuerte que conozco. A Papá, mi modelo a seguir... Espero infundir la seguridad que siento cuando estoy a su lado
A mí hermana, mi mejor amiga, quién me llena de orgullo y ternura A mí hermano, mi mejor amigo, la persona en quien más confío
Acknowledgments
I would like to express my gratitude to the people that during these last years had a positive influence academically, professionally and personally. Not only for their guidance and good advice that helped me to reach the “ups”, but also their support that smoothed the “downs”. I had the nurturing opportunity of working under the guidance of three amazing supervisors; I would like to thank them for giving me the opportunity of working on this project. I am deeply grateful with Christine LAFFORGUE-BALDAS for her relentless encouragement, commitment and accurate advice. I have most appreciated the constructive attitude, scientific exchange and the unconditional support of Philippe SCHMITZ. In the same way, I highly value the willingness and availability of Jeff MORRIS, his scientific curiosity and kindness. All of them pushed me beyond and provided me with many tools for carrying this research to a satisfactory outcome.
I would like to thank the members of the jury for being part of the defense, the exhaustive review of the scientific content and their critical point of view. I appreciate their comments and suggestions as well as the perspectives they arose with their accurate queries.
A special thanks to Christophe ELLERO, Claude LE MEN and Pierre JOSEPH for their mayor support and intervention during the fabrication of the experimental set-up and campaign. The scientific exchanges, their creativity and advice were of most worth.
I would also like to thank my colleagues and friends. I cherish this experience and I always remember… the friends back home, Roberto, Vicky, Sebastian M. Let us keep creating memories… the friends found overseas, Fefe, Vivi, Kike, Jose, Jorge, Ramon, Naïla, Will and Isabella. You’ve made easier being far from home… the friends and colleagues from the lab, Alexandre, Francesco, Mohamed, the list is long, but a special word to Carlos “Pura vida”, our tea time was always refreshing, philosophically but also recreationally.
… My dearest friends Oscar, Sebastian R. and Santiago, words are not enough.
This work was done with the support of FERMAT Federation in the frame of the research grant program AAP 2015 from Idex UNITI “NEMESIS” conv-ANR-11Idex-0002-02.
1
Contents
Acknowledgments ... 3 Acronyms ... 13 Published article ... 15 Abstract ... 17 Résumé ... 19Chapter I: Context and aims ... 23
I. Context and applications ... 25
II. Aims ... 30
III. Technical scope ... 32
Chapter II: Bibliographic review ... 37
I. Filtration ... 39
I.1. Principle ... 39
I.2. Classification ... 39
I.3. Filtration media... 44
II. Membranes ... 45
II.1. Membrane fouling and cake formation ... 46
II.2. Membrane fouling models ... 51
II.3. Membrane cleansing and antifouling strategies... 53
III. Fundamental relationships... 53
2
IV.1. In-situ characterization techniques ... 58
IV.1. Ex-situ characterization techniques ... 73
IV.2. Summary ... 77
Chapter III: Materials and methods ... 79
I. Experimental set-up ... 81
II. Model suspensions ... 82
II.1. Yeast suspension ... 82
II.2. Model polystyrene (PS) particles ... 85
III. Filtering cells for side direct observation ... 87
III.1. Photolithography ... 88
III.2. Plasma etching ... 90
III.3. Piercing and anodic weld ... 92
IV. Image acquisition ... 92
V. Image processing ... 96
V.1. Cake growth monitoring ... 96
V.2. Particle concentration module (PCM) ... 98
V.3. Particle velocimetry module (PVM) ... 99
VI. Numerical simulations... 106
VI.1. First layer hydraulic resistance:... 106
3 Chapter IV: System validation and cake microfiltration characterization using a
model suspension of spherical monodispersed particles ... 111
I. System characterization ... 113
II. Experiments with a model suspension of spherical monodispersed particles 117 III. Qualitative analysis ... 117
IV. Quantitative analysis ... 123
IV.1. Cake growth and flowrate evolution ... 123
IV.2. Pressure, porosity and KK ... 125
IV.3. Permeability ... 129
IV.4. Numerical simulation ... 131
V. Conclusion ... 133
Chapter V: Experiments with cultivated yeast and model suspension ... 135
I. Cultivated yeast suspension ... 137
I.1. Cake growth and flowrate ... 137
I.2. Porosity, permeability and Kozeny coefficient ... 139
I.3. Compressibility and cake relaxation... 143
II. Filtration experiments using model suspensions: non-spherical and polydispersed latex particles ... 146
II.1. Non-spherical particle suspension ... 147
II.2. Suspension of polydispersed model particles ... 151
4
IV. Conclusion ... 160
Chapter VI: General conclusion ... 163
References ... 173
Annexes ... 185
I. Suspension balance model ... 187
I.1. Mass and momentum conservation equations ... 188
I.2. Particle mass and momentum coupling ... 189
I.3. Rheological model for 𝜮𝒑 ... 190
II. Experiments reproducibility for the filtration of monodispersed spherical particles 191 III. Upper filtration monitoring using confocal microscopy (CLSM) ... 193
III.1. Materials ... 194
III.2. Protocol ... 194
III.3. Results ... 195
5
Figure index
Figure 1. Water withdrawal ratios by continent and usage in 2015 [2] ... 25
Figure 2. Hybrid membrane systems [3] ... 26
Figure 3. Some milk industry filtration processes and the resulting products [3] ... 29
Figure 4. Useful ranges of various separation process [3] ... 40
Figure 5 Representation of: a) Dead end and b) Crossflow filtration ... 42
Figure 6. Filter classification [3]. ... 44
Figure 7. Different particle clogging mechanisms a) Sieving, b) Bridging and c) Aggregation... 47
Figure 8. Filter cake cross-section [56] ... 48
Figure 9. Direct observation of fouling formation on hollow fiber [57]. ... 60
Figure 10. Frontal and cross-flow set-ups used by Laar et al. [26] and Zwieden [83] for clogging... 61
Figure 11. Laser triangulometer principle [54] ... 62
Figure 12. Local porosity as a function of the cake thickness.[84] ... 62
Figure 13. (A) Jablonski’s scheme (1. Excitation, 2. Relaxation, 3. Emission); (B) Excitation and emission spectra [85] ... 64
Figure 14. Configuration of epifluorescence microscope [87] ... 65
Figure 15. Confocal laser scanning microscope configuration [88] ... 66
Figure 16. 3D reconstruction of image stacks obtained after filtration of BSA– FITC/dextran–TRITC using a Metricel membrane: 70 kDa (a) and 150 kDa (b) (green corresponds to BSA–FITC signal, red corresponds to dextran–TRITC signal) [90] ... 67
6 Figure 17. Confocal scanning laser microscopy images of a DV20 membrane after filtration of 15 ml of a 1 x10⁸ pfu/ml suspension of bacteriophage fluorescent labeled under constant pressure of 210 kPa [92] ... 67
Figure 18.Principle of the spinning disk confocal laser scanning microscope [89]... 68 Figure 19. Experimental set up for PIV technique [94] ... 69 Figure 20. Flow field showing turbulence generated by different kinds of spacers [45]. ... 71 Figure 21. Optical sectioning for PIV measurements (1) ... 72 Figure 22. a) An image of the physiological fluid used in this experiment with halogen illumination. The fluorescent particles are observed as very small points and RBCs as dark-grey rings. b) Velocity vector fields at different z positions [89]. ... 72 Figure 23. Scanning electron microscopy: schema and principle ... 74 Figure 24. SEM observation of the wine deposit after crossflow microfiltration [97] 75 Figure 25. Atomic force microscope principle [101] ... 76 Figure 26. SEM image of yeast (Saccharomyces cerevisiae) attached to an AFM cantilever – a cell probe [102] ... 77
Figure 27. Side DOTM set-up. a)Scheme of the experiment set-up: 1) Syringe pump, 2) Syringe, 3) Reservoir, 4) Manometer, 5) Mechanical support of the microfiltration cell, 6) Optical bench, 7) Acquisition PC. b) Scheme of the zoomed zone: microfiltration cell support and, connections to syringe, reservoir and manometer ... 81
Figure 28 a) Yeast cells, b) Spherical particles and c) Non-spherical particles with peanut shape ... 82
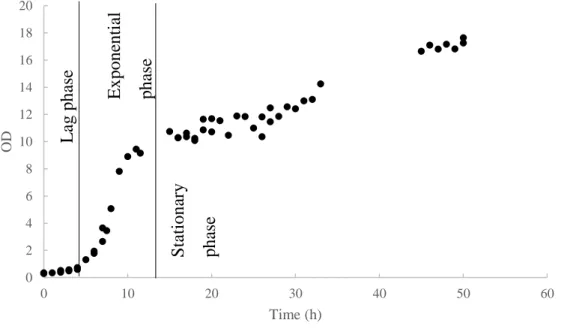
Figure 29. OD evolution through the culture. Identification of the different growth stages: lag, exponential and stationary phase ... 83
7 Figure 30. Concentration evolution through the culture. Identification of the different
growth stages: lag, exponential and stationary phase ... 84
Figure 31. Yeast cell concentration (Dry mass/liter) as a function of the optical density ... 85
Figure 32. Microfiltration cell configurations. The C is the identification of the slot width and Pe the slot periodicity. The difference Pe- C corresponds to the distance between consecutive slots. Highlighted is the zoom of the corresponding entire cell, C2Pe5. At the side is the corresponding information of each different geometry, the information is summarized in Table 7 (units are in µm). ... 87
Figure 33. Microfiltration cell distribution on the wafer. Blue zone correspond to C2Pe5 units, orange C4Pe7 units, yellow C4Pe10 units and green C4Pe20. ... 89
Figure 34. Schematic diagram of the photolithography technique [106]... 90
Figure 35. Plasma etching result C4Pe7 unit. ... 91
Figure 36. Irregularities of the engraving ... 92
Figure 37. Optical bench design... 93
Figure 38. Optical principle of the designed optical set up (By Claude Le Men) ... 94
Figure 39. Support for the microfiltration cell ... 94
Figure 40. a) Rectangular acquisition domain, b) Lower exposure times reveal the channel bottom texture (zoom) and interfere with further image processing, c) Image using an exposure times in the range of 100-120 µs ... 96
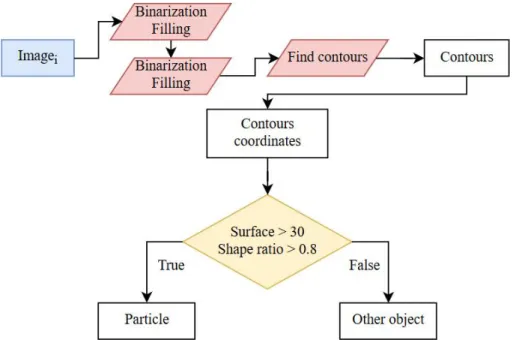
Figure 41. Results from the different steps of the identification code ... 97
Figure 42. Code diagram for cake deposit identification ... 98
Figure 43. a) Inspection of a line of pixels for the concentration estimation, b) The particle presence is evaluated for a fragment of the line, c) The 1D presence signal extended to 2D surface information assuming spheres as particles/cells cross section ... 99
8
Figure 44. Particle identification code applied to every image of the data set ... 100
Figure 45. Example of a particle deposit. Extraction of the reference matrix ... 101
Figure 46. Construction of the research matrix at the instant (i+1). The particle in red shows the position at the instant (i) as it is possible to compare in Figure 45. ... 101
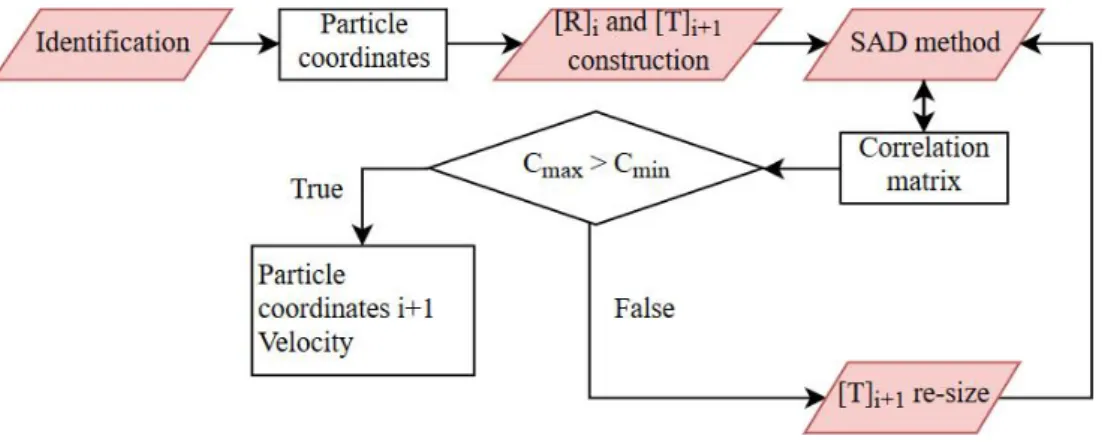
Figure 47. Diagram of the correlation algorithm ... 102
Figure 48. Simple example of the SAD method ... 103
Figure 49. Diagram of the particle tracking code ... 104
Figure 50. Particle presence vector at to consecutives instants of a filtration experiment. The displacement of this signal in time gives an estimation of the velocity. ... 105
Figure 51. a) Entire geometry without the membrane*. b) Complete geometry with the membrane*. c) Simplified geometry for cake-membrane interaction (first layer C4Pe7)*. d,e,f) Upper-view of the simplified geometry for C4Pe7, C4Pe20 and C4Pe10 units respectively. g) Detail on the membrane for the simulated geometry (channel + membrane for C4Pe10 unit). * The red surface corresponds to the inlet and the blue to the outlet. ... 107
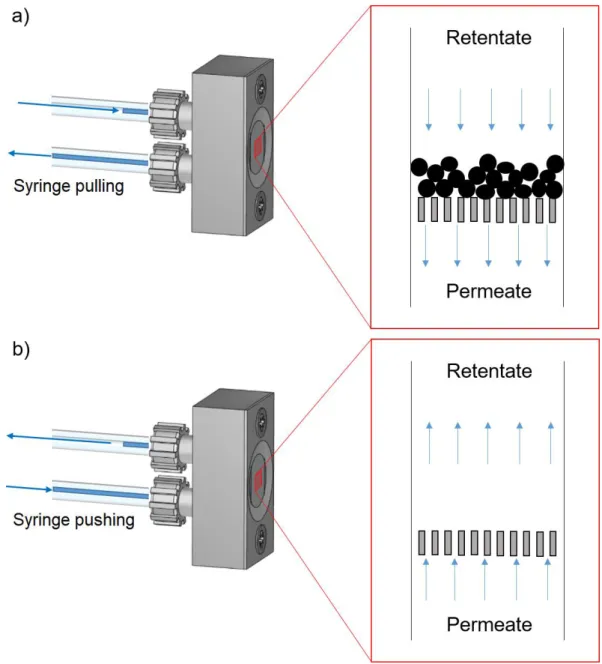
Figure 52. a) Syringe pulling to establish the flow in the filtration direction. b) Syringe pushing to fill the system ... 114
Figure 53. a,c,e) First stage of cake formation for C4Pe7, C4Pe10 and C4Pe20 configurations, respectively. b,d,f) Sketches of the typical structure of particle arrangement for the corresponding membrane configuration ... 118
Figure 54. Slot/pore configuration and variables intervening in the calculation of pp for membranes with circular pores and for the characteristic geometry of the current experiments ... 120 Figure 55. Different slot blocking configuration and first layers possible structure based on pp. a) Particles are in contact with an organized structure but do not block optimally the slots for pp < 1. b) Particles get in contact forming a well organized structure for pp = 1. c) For 1 <
9
pp < 2 particles cannot place on the membrane walls after slots are blocked. d) Particles can lay on the membrane surface for pp > 2. ... 122
Figure 56. Mean height of the deposit obtained using the CGM module during the filtration of spherical particles for different membrane geometries ... 124
Figure 57. Flowrate evolution as a function of the deposited mass per membrane unit surface during the filtration of spherical particles for different membrane geometries. ... 125
Figure 58. Pressure drop across cake alone and cake porosity evolution as a function of the deposited mass per surface unit for the filtration of spherical particles using different membrane geometries ... 127
Figure 59. Estimated porosity from the mass balance ϵh (Eq. 23) compared to the calculated porosity ϵp (Eq. 25) for KK = 5 for the filtration of spherical particles using different
membrane geometries. ... 128 Figure 60. Evolution of the Kozeny coefficient throughout the filtration on different membrane geometries and a suspension of spherical monodispersed particles. ... 129
Figure 61. Evolution of the cake permeability for the three different membrane units when filtering suspensions of model spherical particles. Light symbols asses the permeability related to first particle deposition while dark symbols corresponds to a formed deposit (> 3 layers) ... 130
Figure 62. Experimental values of the hydraulic resistance caused by membrane blocking for the different geometries when the first layers are forming (dashed lines with symbols). Symbols represent the simulation results for the membrane blocking resistance (< 1 layer of particles). ... 132
Figure 63. Yeast cell size distribution at 50 h of cultivation. ... 137 Figure 64. Yeast cake mean height as a function of the deposited mass per unit membrane surface. Mean values with the standard deviation. ... 138
Figure 65. Evolution of the flowrate mean value throughout the filtration experiment as a function of the deposited mass per unit surface ... 139
10 Figure 66. Porosity evolution. Mean values with the standard deviation plotted as a function of the deposited mass per unit surface ... 140
Figure 67. Evolution of the cake permeability during the filtration of yeast cell suspensions. Mean values with the standard deviation are plotted against the deposited mass per unit surface. KC corresponds to the permeability for a formed deposit (m > 20 g/m2) while KC’ for the blocking layers. ... 141
Figure 68. Kozeny coefficient as a function of the porosity for yeast cakes. ... 142 Figure 69. Specific hydraulic resistance as a function of the pressure ... 143 Figure 70. Compressibility of the yeast cake. Red surface corresponds to the cake at the final pressure, while green surface represents the difference between the compressed and relaxed cake. ... 144
Figure 71. Cell compression, deformation and reorganization on yeast cake compressibility. ... 145
Figure 72. Cake obtained for non-spherical particles and scheme of the characteristic peanut shape. ... 147
Figure 73. a) Cake mean height and b) Flow rate evolution. Both as a function of the deposited mass per unit membrane surface. The red lines differentiate the noted regimes of membrane blocking at the beginning of the filtration and the cake formation. ... 148
Figure 74. a) Porosity and b) Permeability evolution as a function of the deposited mass per unit membrane surface for non-spherical particles. KC corresponds to the permeability for
a formed deposit (m > 20 g/m2) while KC’ for the blocking layers. ... 149 Figure 75. a) Kozeny coefficient KK as a function of the porosity and b) Specific
resistance as a function of the pressure drop across the cake alone during the filtration of non-spherical particles... 150 Figure 76. Cake obtained for the polydispersed suspension. ... 151 Figure 77. Particle number concentration for the polydispersed suspension. ... 152
11 Figure 78. Cake mean height and b) Flow rate evolution for polydispersed suspensions. Both as a function of the deposited mass per unit membrane surface. ... 153
Figure 79. a) Cake porosity and b) permeability evolution for polydispersed suspensions. Both as a function of the deposited mass per unit membrane surface. Mean values with the standard deviation. KC corresponds to the permeability for a formed deposit (m > 20
g/m2) while KC’ for the blocking layers ... 154 Figure 80. a) Kozeny coefficient as a function of the porosity and b) Specific resistance as a function of the pressure difference across the cake alone for the filtration cake of polydispersed particles. ... 155
Figure 81. Comparison of the cake height evolution for the different suspensions. .. 156 Figure 82. Comparison of the porosity evolution of the cakes obtained for the different suspensions. ... 157
Figure 83. Comparison of the cake permeability evolution for the different suspensions against the deposited mas per unit membrane surface. ... 158
Figure 84. Comparison of the Kozeny coefficient as a function of the porosity for the different suspensions. ... 159
Figure 85. Comparison of the specific resistance as a function of the pressure across the cake alone for the different suspensions. ... 160
Figure 86. Pressure and porosity variation as a function of the deposited mass per unit filter surface ... 191
Figure 87. Cake growth as a function of the deposited mass per unit filter surface .. 192 Figure 88. Flowrate reduction throughout the filtration... 192 Figure 89. Permeability evolution as a function of the deposited mass per unit filter surface ... 193
12 Figure 91. Aquamarijn microsieves. ... 194 Figure 92. Micro-filtration chamber. 1) Cover, 2) Seal, 3) Glass slide, 4) Seal, 5) Chanel, 6) Microsieve platform ... 194
Figure 93. Upper monitoring set up. 1) Ultra-pure water reservoir, 2) Suspension reservoir, 3) Microfiltration chamber, 4) Microscope objective, 5) Manometer, 6) Pump, 7) Permeate, 8) Computer ... 195
Figure 94. Filtration monitoring at different moments. a, b) x10/0.4 dry objective. c, d) x63/0.9 water objective. ... 196
13
Acronyms
AFM: Atomic force microscopy
CGM: Cake growth monitoring module CLSM: Confocal laser scanning microscopy DOTM: Direct observation through membrane
LAAS: Laboratoire d’analyse et d’architecture des systèmes LED: Light-emitting diode
MF: Microfiltration NF: Nanofiltration OD: Optical density
PCM: Particle concentration module PS: Polystyrene
PVM: Particle velocimetry module RO: Reverse osmosis
SAD: Sum of absolute differences
SDCLSM: Spinning disk confocal laser scanning microscopy SEM: Scanning electron microscopy
UF: Ultrafiltration
15
Published article
A. Valencia, C. Le Men, C. Ellero, C. Lafforgue-Baldas, P. Schmitz, and J. F. Morris, “Direct observation at the microscale of particle deposition during the first stage of the microfiltration process,” J. Membr. Sci., vol. 599, p. 117823, Apr. 2020, doi: 10.1016/j.memsci.2020.117823
17
Abstract
Filtration is a widely used industrial process, which nature and purpose result in fouling and hence reduction of its efficiency with associated economic losses. This project aims to better understand the fouling through the microscale monitoring and analysis of the filtration process. For that, a new dead-end microfiltration apparatus is constructed and coupled with an imaging system to provide direct observation (DO) from the side. Particle deposition is characterized in-situ and in real time for four different suspensions: a cultivated yeast (Saccharomyces Cerevisiae) suspension and three suspensions of model particles in the same size range as the yeast cells (spherical particles, non-spherical particles and polydispersed particles in both size and shape). Model membranes are used to achieve fluid-particle separation, and different membrane geometries were created for studying the pore configuration effect on particle deposition and cake structure. Image processing is used to measure the observed cake height and to evaluate the concentration and particle velocity. This information is combined with the continuous pressure measurement and the qualitative description of the acquired images to provide a complete analysis of the microfiltration process. A mass balance is performed to estimate the porosity and the Kozeny coefficient (KK) along
with complementary analysis using Darcy equation and the Carman-Kozeny formula.
The system is validated for model conditions using the suspensions of spherical particles. The filtration performance for the different membrane geometries is similar. However, the initial cake structure is conditioned by the membrane geometry. This has an influence on pore blocking and further cake growth, which impacts on the pressure drop across the cake. Numerical simulations were used to investigate the initial behavior (pore blocking and hydraulic resistance) when the cake is forming and show good agreement with the experimental data.
Monodispersed particle suspensions show a very similar behavior in terms of porosity and permeability regardless of the different particle shapes. However, for a higher specific surface KK coefficient decreases. For monodispersed particle suspensions, KK behaves linearly
with the porosity. In the case of the cake formed by the polydispersed particles, an exponential evolution for KK coefficient is observed, which resembles more the yeast cake behavior.
18 polydispersed particles shows an intermediate behavior between the monodispersed cases and the yeast cells. This confirms the influence of polydispersity and explains partly the yeast cake behavior, the high specific resistance and low permeability. Yeast cake behavior is explained by the combined effect of cell polydispersity and the compressibility of the cake. Yeast cakes were the only to exhibit a compressible behavior, which was confirmed by a volume expansion after transmembrane pressure was removed. The analysis of this expansion results in a porosity after relaxation close to the estimate for polydispersed particles ~0.26. It remains to explain the nature of this compressibility.
The experimental protocol is an accurate approach for the study of the filtration cake formation for different suspensions. The DO resolution was improved (~ 0.6 µm) allowing better imaging of particles in the microfiltration size range. Combining the velocity information with the pressure measurements makes it possible to characterize filtration processes where both pressure and flowrate are variables.
19
Résumé
La filtration est un procédé industriel dont l’efficacité est toujours réduite par le colmatage. Ce projet vise à mieux comprendre le colmatage par l’observation et l’analyse du processus de filtration à la micro-échelle. Pour cela, un dispositif original de microfiltration frontale a été conçu et réalisé. Il est couplé à un système d’imagerie qui fournit une observation directe (DO) latérale. Le dépôt de particules est ainsi caractérisé in-situ et en temps réel pour quatre suspensions : levure cultivée (Saccharomyces cerevisiae) et particules modèles dans la même gamme de taille et de forme (particules sphériques, particules non-sphériques et particules polydispersées). Des membranes modèles dont les pores sont des fentes parallèles régulièrement réparties sont utilisées pour la séparation fluide-particules. Différentes géométries ont été créées pour étudier l’effet de la taille et de l’espacement des pores sur la structure du gâteau. Avec le traitement d’images on mesure la hauteur du gâteau de particules observé et on estime le champ de concentration et la vitesse moyenne des particules avant leur dépôt. Des mesures de pression couplées à la description qualitative et quantitative des images permettent une analyse complète du processus de microfiltration. Un bilan de masse est ainsi effectué pour estimer la porosité puis le coefficient de Kozeny (KK) en utilisant l’équation de
Darcy et la formule de Carman-Kozeny.
Le système est validé sous conditions modèles avec la suspension de particules sphériques. Le processus de filtration pour les différentes géométries de membrane est similaire. Cependant, la structure initiale du gâteau de particules est conditionnée par la géométrie de la membrane. Cela a une influence sur le blocage des pores et la croissance du gâteau, et donc un impact sur la différence de pression et son évolution. Des simulations numériques ont été effectuées pour calculer l’écoulement dans une configuration géométrique périodique de référence comportant un blocage des pores optimal lorsque le gâteau se forme. Elles sont en bon accord avec les données expérimentales.
Les suspensions de particules monodispersées présentent un comportement similaire en termes de porosité et de perméabilité, indépendamment des différentes formes de particules. Cependant, pour une surface spécifique plus élevée, le coefficient KK diminue. Pour les
suspensions de particules monodispersées, KK varie linéairement avec la porosité. Au contraire,
20 coefficient KK,, plus proche du comportement des gâteaux de levure. Lors de l’analyse de
l’évolution de la porosité des quatre types de suspension, le gâteau de particules polydispersées montre un comportement intermédiaire entre les cas des particules monodispersées et de la levure. Cela confirme l’influence de la polydispersité et explique partiellement le comportement du gâteau de levure, sa haute résistance spécifique et sa faible perméabilité.
Les caractéristiques du gâteau de levure s’expliquent par l’effet combiné de la polydispersité de la levure et de sa déformabilité. Le gâteau de levure est le seul à présenter un comportement compressible, confirmé par une expansion volumique remarquable du gâteau après la relaxation de la pression transmembranaire. L’analyse quantitatif de cette expansion fournit une porosité après relaxation proche de l’estimation faite pour les particules polydispersées ~0,26. Il reste donc à expliquer la nature de cette compressibilité.
Le protocole expérimental est une approche pertinente pour l’étude de la formation du gâteau de filtration pour différentes suspensions. La résolution de la DO a été améliorée (~ 0,6 µm) permettant une meilleure imagerie des particules dans la gamme de tailles de la microfiltration. La combinaison des mesures de vitesse et de pression permet de caractériser les processus de filtration où la pression et le débit varient simultanément.
23
Chapter I: Context and aims
25
I. Context and applications
Filtration is a widely used industrial process involving the transport and the separation of suspensions of matter with different nature, size and shape, as well as complex physical and chemical phenomena. Despite its wide usage, the nature and purpose of this process result in the fouling of the filter and hence the reduction of its efficiency with the associated economic losses. The multi-scale characteristics and the diverse nature of the suspensions mean that the problem involves a large number of variables. Moreover, the existence of different filter types and operating conditions adds even more complexity. This makes it difficult to perform an extensive characterization from which to develop comprehensive understanding of the fouling mechanisms involved in all situations. That is why the present work is dedicated to membrane microfiltration. Some of the applications of membrane filtration are presented below.
Water treatment
Worldwide, water demand is constantly under pressure due to the increasing population and the scarcity of sources. Being a limited resource, the issue of water is one of the modern society paradigms. Globally improving standards of living place demands on society’s ability to provide sufficient clean water [1].
26 In this field, membrane technologies have been valuable, as they are widely used for water purification at large scale, and, in fact, water treatment is one of the most important single application of membrane technology. Membrane usage for water treatment is of interest to both the industrial manufacturing sector and water management authorities. Human water consumption is divided in three main categories: domestic use, industry and agriculture. Figure 1 shows the ratios of water withdrawal by continent for each category of consumption.
Even if classical water treatment is firstly associated with chemical addition for coagulation, flocculation and disinfection, some microorganisms are resistant to chemical disinfectants. Membrane treatment appears as a better solution as it requires minimal addition of aggressive reagents and produces almost no by-products. For this reason, membrane processes are more and more used in many water treatment applications.
Figure 2. Hybrid membrane systems [3]
Normally membrane technologies work as a combined hybrid system. Hybrid membrane systems are conceptually viewed as a series of steps based on the membrane range of material rejection from RO to MF [4]. MF is used to remove turbidity and larger microorganisms; many studies have demonstrated MF rejection of microorganisms like yeast (Saccharomyces cerevisiae) and E. coli (Ben Hassan et al., 2014; Li et al., 2003; Zhang et al.,
27 2010). UF allows inorganic compounds and large molecules retention such as heavy metals, suspended solids, organic compounds and virus. Both UF and MF are standard processes for oil-water separation. The NF and RO are able to reject colorant molecules and ions, so that it can be applied as the final step to produce potable water. Figure 2 depicts the concept of hybrid membrane systems for water treatment.
Regarding sewage (or sludge), the high demand on membrane treatment by the industry and its wastes provide the motivation for the development of this technology. Forward osmosis is an emerging technology for separation and treatment of a broad range of wastewaters, including produced water from oil and gas [8], [9]. Forward osmosis was proposed as a breakthrough in the desalination technologies due to its potential for reducing the power consumption associated with the high pressure gradients of RO.
Industry
Some industrial applications need a certain quality in the input water and environmental regulations demand a certain quality in the output as well. As an example, about 15% of the industrial input water used by United States manufacturing is ultrapure water produced by MF and UF techniques (see Figure 2).
Not all common contaminants in water can be removed by only one method, so that different water treatment processes are applied according to the type of disposed water and the residue that must be eliminated from the permeate. Table 1 presents a comparison between the different methods.
28 Table 1. Comparison of water purification techniques [3]
Purification process Dissolved ionized solids Dissolved ionized gasses Dissolved
organics Particulates Bacteria Pyrogens
Distillation E P G E E E Deionization E E P P P P Reverse osmosis G P G E E E Carbon adsorption P P* G** P P P Filtration P P P E E P Ultrafiltration P P G++ E E E UV oxidation P P G++ P Gs P
E: excellent G: good P: poor
* Activated carbon will remove chlorine by adsorption
** Special grades of carbon
+ Depends on molecular weight of
organics
++ Some types will remove organics
s Selected bactericidal capabilities, depending on intensity, contact time and
flowrate
Some of the industrial applications using filtration processes in order to capture the desired product or for water treatment are:
- Dairy industry: in the food industry, dairy is the most important field of application of membrane technology. The lactose industry in particular has many products involving MF and UF as shown in Figure 3, but also NF and RO processes can be applied to obtain different lactose by-products. One example is the patented 3-step membrane filtration for production of lactose-free dairy products [10]. Vasileva et al. also use hybrid membrane system for the hydrolysis of whey lactose, which is used in the products such as dairy, confectionery, baking and soft drinks [11].
29 Figure 3. Some milk industry filtration processes and the resulting products [3]
- Industrial waste treatment: interest in green technologies and integrated processes has increased efforts and investment in development of new techniques and protocols for water reuse and waste reduction. Besides technological development and economical profit, political aspects play an important role as there are new legislations regarding the quality of waste effluents to the environment [1]. There are many examples of separation processes that are already in place. Reverse osmosis and nanofiltration membranes were investigated for treatment of wastewater that is food industry effluent in order to reduce the chemical oxygen demand [12]. Also, during ethanol production yeast fermentation of sugars produce 8-12% of ethanol from the total volume, and the remaining products are waste. This waste has 5% of solid content, formed by dead yeast cells, cell debris and traces of residual sugars. By using MF the resulting waste, or “stillage”, can be clarified [3] [13]. Combination of other techniques with filtration has also been practiced, for example in the treatment of leather industrial effluents by filtration and coagulation processes [14].
UF retentate MF
MILK
Total protein isolates Specialty milk products Cheese manufacture Cheese manufacture Protein isolates Beverages Hydrolyzate UF permeate Membrane fermenter Fermented products UF Lactose manufacture Membrane reactor Cream Low bacteria Low-fat milk
30 Other examples among many where membrane filtration processes are used are the ink industry, latex emulsions production, pulp and paper industry, sugar refining, vegetable oils, and protein processing [3].
Biotechnology pharmaceutical applications
“Pharmaceutical industry can be viewed as a complex system of processes, operations, and organizations involved in the discovery, development, and manufacturing of drugs” [15]. Biotechnology applications include a wide range of biological processes to obtain different product inputs or the final product itself. The pharmaceutical and biotechnology industries having some mutual objectives, and thus are overlapping in some sectors of development and sharing in certain expertise and techniques. Separation techniques are widely present in both industries and play a role in recovery of molecular and particulate components, protein concentration, suspension clarification, sterilization, and more. Ultrafiltration and microfiltration are widely used to recover macromolecules and retain suspended colloids, particles and microorganisms. One of the main applications of membrane technology in this field is the separation and harvesting of enzymes and microorganisms. An example is the sterile filtration for bacterial removal at the initial stage of the production line of many products and laboratory procedures. Sterile filtration is normally performed in a dead-end configuration [16]. Another application is the membrane bioreactor technology, where membranes are used for numerous purposes: enzymatic and microbial conversion processes [17], tissue culture, for the production of aminoacids, antibiotics, anti-inflammatories, anticancer drugs, vitamins, optically pure enantiomers and isomers [18], enrichment of nitrogen or oxygen, and filtration of exhaust air [3].
Adsorptive membranes have also been used as an alternative to resin-based chromatography columns, because shorter diffusion times are obtained. This could allow maintaining high efficiencies at high flow-rates using large biomolecules with small diffusivities (Charcosset, 2006).
II. Aims
As seen before, real filtration applications involve the separation by membrane processes of a large spectrum of materials in the same feedstock, which are different in size, shape and nature. From now, solid matter will be referred as particles. These differences bring
31 a wide variety of interactions between particles like enhanced diffusion due to small sized particles, attraction or repulsion depending on the surface charge, deformation as function of the mechanical properties, etc. The flow and operating conditions may result in enhanced mixing or focalization due to particle migration, the fouling layer compaction, relaxation and reorganization caused by changes in pressure. Finally, the carrying fluid properties like the pH have an important effect on particle interactions. All these variables define the filtration performance, its efficiency and limitations.
The present work aims to better understand the membrane fouling mechanism through the monitoring and analysis at the micro-scale of particle accumulation at the membrane surface using model suspensions of solid particles and cultivated yeast (Saccharomyces
cerevisiae).
An accelerated development made of yeast technology a highly productive and economic industry [19]. Being metabolically diverse, yeasts are widely used in many industrial processes. Different yeast strains are used for the production of ethanol, vitamins, organic acids, carotenoids, and enzymes. Yeasts are also used to catabolize benzene compounds and may prove useful for cleaning up spills of industrial chemicals as well as for biosynthesizing new compounds. Some of the developments in the pharmaceutical industry are also based on the yeast technology for the synthesis of active proteins and other compounds [20]. Many of these fields involve the membrane microfiltration as a main or a secondary process, which drives the attention to the study of the yeast filtration performance. Yeast is a microorganism whose properties like cell metabolism, mechanical response and size and shape polydispersity have been studied. However, the characteristics of yeast filtration cakes rises some question with regards the high cake hydraulic resistance and the consequent permeability and efficiency loss. These effects can be present in many real filtration applications. The interest of framing the project into a realistic filtration scenario led to focus the present study on the analysis of the microfiltration of cultivated yeast suspensions.
The choice of three model particle suspensions answer the interest of characterizing the system by a simpler scenario that allows to establish a valid protocol and the easy comparison with simulations. In addition, each model suspension assesses some of yeast characteristics: the yeast shape related to the budding behavior and the polydispersity. Model polymer particles are produced by emulsion, dispersion, or suspension polymerizations. [21]–[23].
32 Focusing in a more dynamic approach this project constitute the follow-up of the work achieved by Beaufort [24] and Ben Hassan [25]. In this work, an in-situ direct observation of the filtration cake growth is done using confocal laser scanning microscopy (CLSM). This method allowed to study the effect of the membrane geometry and the suspension nature and size disparity on the cake morphology. Even though the confocal microscopy is a powerful tool that allows the acquisition of 3D data, it falls short regarding acquisition rate necessary to analyze the filtration from a dynamic continuous approach. This is caused by the time required to scan an entire volume with high resolution. That is why the previous work analyzed the filtration cake formed layer by layer and not in real-time. In addition the thickness of the studied deposits was limited by the laser penetration, which only allows the examination of relatively thin fouling layer < 35 µm thickness.
III. Technical scope
The design and creation of a new microfiltration set-up is done so that particle deposition could be investigated in-situ and continuously. The configuration provides direct observation from the side of a wide field of view, thus permitting characterization of the vertical concentration profile, the cake structure and the rheology transition between the suspension behavior and the growing cake zone on the membrane surface.
This new set-up must satisfy certain specifications to achieve the desired coupling to optical devices and techniques, with optical resolution for model particles allowing continuous examination and data acquisition of the filtration phenomenon. The assistance and facilities of LAAS (Laboratoire d’analyse d’architecture des systèmes) are essential to determine the feasibility and guide design of the device; a critical expertise brought by these collaborators is their knowledge of techniques for creating micro-scale architectures.
The idea for the device is a dead end microfiltration cell consisting of a channel with a filter to achieve the separation. The device must be easily attached to a pump, the tubing, the suspension reservoirs and allows the observation. For that, a mechanical support must be designed to act as the interface between the microfiltration cell and the tubing allowing the connection to the pump and a manometer to register pressure variations. Taking these demands into account, the following considerations are studied:
33 - Filtering unit: the filtering unit is placed in the middle of the dead end microfiltration channel. The structure consists of a series of parallel walls forming an arrangement of slots (analogue to pores for common membranes). The slots width is given by the distance between the walls and must be smaller than the particle/cells minimum size. The filtering structure must guarantee that all particles and cells are rejected by size selectivity, i.e. only the sieving mechanism controls the system fouling by partial blocking and cake filtration (see Table 2). The length of the channel upstream and downstream of the filtering structure must be sufficiently long to insure that the flow reaches a stable flow regime, i.e. a fully developed flow can be assumed.
- Geometric constraints: the geometry of the experiment must be set at different scales. First of these is the macro-scale related to the assembly of the whole set-up. The microfiltration cell support is the key component to guarantee the flow conditions on the microfiltration cell and the observation of the filtration phenomenon. It must hold the microfiltration cell at the right position to achieve both the sealed connection to the flow system and the configuration of the microscope observation.
The meso-scale is associated with the channel dimensions, which define the main flow parameters, e.g. flow velocity, and the important contribution of the channel friction to the total pressure drop of the system. The aim is to study the filtration under laminar conditions and more specifically Stokes flow for Re < 1. For this regime under dilute conditions, particles follow closely the streamlines with negligible particle-fluid relative velocities. Hence, the flow velocity must be in agreement with optical set-up acquisition
Finally, the micro-scale is associated with the filtering structure. Varying the slots width and the distance between them (wall thickness); it is possible to study different membrane permeabilities and the effect of membrane geometry on the cake structure. - Optical features: the main optical parameters are the working distance of the
microscope objective as well as the optical equipment performance in terms of acquisition rate, memory, observable field, and image resolution. The principal feature regarding the camera choice is the pixel size of the acquired image, i.e. the resolution. The resolution should allow observing clearly both model particles and yeast cells. The
34 model particle diameter is 8.4 µm with standard deviation of 0.9 µm and the yeast cells size ranges from 2-10 µm. A pixel size of 1 µm or less is targeted, so that, even the smallest yeast cells are resolved. Besides the resolution, the observed field must capture the entire membrane as well as a representative domain above the filter to characterize the cake and the suspension. In this way, it is possible to study the behavior of the suspension in the different concentration zones and the whole surface of the filtering unit, in order to estimate the feedstream concentration and to determine cake homogeneity. For that, the optical set-up should be able to observe a 1 mm by 1 mm field in x and y corresponding to the channel width and the domain above the membrane. Another constraint regarding optics is the camera dimensions and the coupling with the whole set up.
- Feasibility: the small dimensions, particularly at the filtering structure, present a challenge. The most suitable technique for creating the filtering module is photolithography followed by plasma etching; nonetheless, the plasma etching technique capability is limited when working at very small sizes such as those of the membrane microchannels. Having a channel length of 1 mm and the minimum slot width of 2µm, the technique can provide depths around 25-30 µm. The limited channel depth could lead to clogging issues for the model particles and yeast cells of approximatively 8.4 and 6.0 µm (mean for yeast cells) diameter, respectively. The studies by van de Laar et al. [26] and Dressaire et al. [27] conclude that aggregation could lead to channel clogging before reaching the filtering unit. In addition, an intermittent bridging phenomenon is common. An aggregation of 2-10 particles could lead to the formation of particle arches; then if one dimension of the channel is equal or less than 10 times the particles diameter, which is the case, bridging is likely to happen. However, it is important for this study to have a limited depth to allow focusing throughout the depth; this allows observation of all the particles in the depth dimension. It is also important to guarantee that particles are not aggregated in the suspension. Previous tests were performed during the internship of Alice Gornall [28] in order to gauge the effect of salt concentrations on settling rates and the possibility of aggregation of yeast particles. To minimize later downstream processing, salt concentrations were kept below 0.5%, the maximum concentration of fresh water. There is very little effect on settling rates. It
35 was therefore concluded that such low salt concentrations have little to no influence over particle aggregation and so the remainder of experiments were carried out in a 0g/L salt solution.
The outline of this document is organized as follows:
Chapter II presents and extended bibliographie with a general overview of the filtration principle for then focus on the membrane microfiltration, the fouling mechanisms and the fundamental relationships considered for the further analysis. Different fouling characterization methods are reviewed.
Chapter III describes the experimental set up and protocol as well as the model conditions for the numerical simulations.
Chapter IV is focused on the validation of the experimental set-up for the filtration of a suspension of monodispersed spherical particles. The filtration performance for this suspension is analyzed and the results are used for further comparison.
Finally, Chapter V evidences yeast cake behavior and offers explanation to its morphological properties and filtration performance by evaluating yeast cells features, like size distribution and shape, using model particle suspensions.
37
Chapter II: Bibliographic review
39
I. Filtration
Transport and separation processes are present in several branches of industrial development. Among them, filtration is widely used and has a strong presence in the biotechnology and pharmaceutical industry [29], the drinking water and waste water treatment sectors [30], [31] and the food and beverage industry [32]. Giving its presence, it is natural to seek new ways to enhance the filtration performance and effective solutions to filtration and separation problems [33].
The main hindering features related to filtration system failure are the fouling and clogging phenomena. Mechanisms such as sieving, bridging and particle aggregation [27] result in permeate flux decline and lower efficiency of the process.
I.1. Principle
Filtration is a selective process that allows separation of two or more constituents from a fluid stream. This separation is often based on the size but also may rely on different properties including diffusion, ionic charge, density, temperature and surface activity as depicted in Figure 4. The separation is achieved using a filter through which the fluid passes and leaves behind certain components.
The filter is the selective barrier that allows retention of specific components from the fluid feed stream. The retained material is known as retentate and the passing material is called permeate. The filter represents an obstacle to the flow, thus it has an associated hydraulic resistance and a consequent energy loss related to a pressure drop. To establish the flow through the filter either a pressure gradient or a chemical potential gradient is needed.
I.2. Classification
There are multiple criteria to classify the separation processes, some of them are: the separation range of usage, the filtration operating mode, the flow condition and the filtrate retention zone.
Separation range of usage
Figure 4 shows different processes classified by the range of usage and the dominant separation factor. Filtration process can be applied in a wide range of particle sizes from reverse
40 osmosis (RO) being able to retain components in the range of simple ions of sub-nanometer scale to common filtration of coarse particles.
Figure 4. Useful ranges of various separation process [3]
The present study is focused on membrane separation by sieving i.e, surface size rejection. Concerning particle size, the filtration processes retaining particles of size equal or inferior to the microfiltration range are also known as membrane separation processes. For these cases the main role of the membrane is to act as the selective barrier, the filter. Membrane filtration extends its applications further in order to include the separation of dissolved solutes in liquid streams and also separation of gas mixtures [3]. RO and nanofiltration (NF) are used to separate particles in the ionic range from 10-4 to 10-3 µm. Both are widely used for single-stage seawater or brackish water desalination [34] and it is possible to remove pollutants such as the hydrolyzed reactive dyes, mineral salts and organic compounds [35]–[37]. RO and NF have a high rejection performance but also require very high transmembrane pressures (and thus high absolute) which results in important capital and operational costs. In the case of ultrafiltration (UF), separation units are able to reject particles from 10-3 to 0.1 µm. UF membranes remove inorganic contaminants such as heavy metals along with suspended solids and organic compounds from a bulk suspension [38]. In the case of microfiltration (MF), particles within the range of 0.1 to 10 µm are retained. Microorganisms like Saccharomyces
Cerevisiae and E. Coli, colloids and smoke particle from suspensions and gases are some of the
examples of the retained material. The advantage of both MF and UF ultrafiltration is the low driving force required. However, problems associated with fouling limit their application. Both are usually used as hybrid or integrated membrane processes, which means that they are integrated with other
41 membrane processes, either with or without conventional unit operations to increase performance depending on the type of feed and product quality required; this is the case for desalination and water purification by reverse osmosis (RO) [4].
Filtration operating mode
In terms of flow direction, the process is mainly classified in two operating modes: frontal (also known as dead end) and crossflow filtration. In the case of dead end filtration, the main flow direction is perpendicular to the filter. In this configuration, all retentate accumulates on the filter surface with no opportunity for flux-induced cleaning. The advantages of dead-end filtration are the high percentage of rejection and product recovery as well as simplicity of operation. The main drawbacks remain the flux and capacity limitations. The flux is largely determined by permeability of the filter, which is related to the pore diameter, pore distribution [39] and membrane surface properties [40]. The thickness of the porous medium as well as tortuosity of filter channels are important factors, especially for depth filtration. Besides the characteristics of the filter, the feed suspension properties will generally affect dead-end filtration performance: the viscosity and density of the feed suspension as well as the nature of the retained materials may result in lower fluxes due to fouling layers with high hydraulic resistances [41]–[43]. All these factors can accentuate or attenuate the fouling phenomena. The observed effects depend on the imposed flow conditions: fouling results in the transmembrane pressure rising for constant flux conditions, whereas flowrate reduction is observed when the pressure is constant. The growth of the fouling layer may result in system failure due to unacceptably high pressures or low flowrates) which limits the filtration capacity.
In crossflow or tangential filtration, the primary flow direction is tangential to the filter. Crossflow filtration tends to improve the hydrodynamic flow conditions, with shear stresses as an antifouling factor. In this configuration it is possible to attenuate the retentate accumulation at the filter as function of the flow parameters [44]. This can enhance the filtration efficiency since the fouling phenomenon resulting from the cake formation results in high operational costs. It is because of this feature that the potential for improvement based on the control of the hydrodynamic conditions has been the motivation of many studies. These studies are focused on the influence of different membrane geometries and operating modes to induce higher levels of shear rate associated with higher turbulence to hinder cake formation [45]–[47].
42 Figure 5 Representation of: a) Dead end and b) Crossflow filtration
Flow condition
Filtration studies typically seek to determine such flow parameters as the pressure-velocity relation, or the hydraulic resistance of the deposit, among others. These parameters are obtained through experiments that are conceived according to the objectives under different flow conditions:
- Constant pressure - Constant flux
At constant pressure, the flow rate can be obtained according to Darcy’s equation, i.e.
𝐽 = 1 𝐴 𝑑𝑉 𝑑𝑡 = ∆𝑃 𝜇(𝑅𝑚+ 𝑅𝑐) Eq. 1
where 𝑅𝑚 (m-1) is the membrane hydraulic resistance, 𝑅𝑐 (m-1) the cake hydraulic resistance, 𝐴 (m²) the filter surface and 𝜇 (Pa.s) the dynamic viscosity. The quantity 𝑅𝑐 increases, typically linearly or faster, with the deposited solid mass per filter surface unit 𝑚 (kg/m²). Then 𝑅𝑐 is expressed as the product of an average specific cake resistance and 𝑚:
𝑅𝑐 = 𝛼𝑚 =𝛼𝐶𝑉 𝐴
43 Eq. 2
Here, 𝐶 represents the effective bulk concentration (g/m³), 𝛼 (m/kg) is the average specific resistance and 𝑉 (m³) is the cumulative permeate volume. Through substitution of Eq. 2 in Eq. 1 and integration, one finds [𝜇𝛼𝐶 ∆𝑃𝐴2] 𝑉 + 𝜇𝑅𝑚 ∆𝑃𝐴 = 𝑡 𝑉 Eq. 3
The slope 𝜇𝛼𝐶/2∆𝑃𝐴2 is known as the Modified Fouling Index (MFI). Previous reported experimental data for filtration under constant pressure shows approximately linear behavior of t/V vs. V over a broad range of varying flux 𝐽 for small foulant concentration [48].
The approach described by Eq. 3 allows determination of a mean specific fouling resistance 𝛼 if all the other measurable quantities are known. Nevertheless, it is often not possible to characterize accurately the temporal evolution of 𝛼. For this reason, another approach is formulated using Eq. 1 and Eq. 2 and the definition of membrane permeate flux 𝐽0 = ∆𝑃/𝜇𝑅𝑚 at 𝑡 = 0. Upon substitution and rearranging one obtains:
𝛼𝑖 = (∆𝑃𝐴 𝜇𝐶𝐽0) ( 𝐽0− 𝐽𝑖 𝐽𝑖 ) 1 𝑉𝑖 Eq. 4
Substituting the instantaneous values of cumulative permeate volume 𝑉 and permeate flux 𝐽 one obtains the specific resistance 𝛼 throughout the entire filtration process.
For constant flux condition the total pressure drop in the filter-cake system is ∆𝑃𝑡 = ∆𝑃𝑚+ ∆𝑃𝑐
Eq. 5
with ∆𝑃𝑚 and ∆𝑃𝑐 being, respectively, the pressure drops across the membrane and cake only. For a constant flowrate 𝐽, the cake resistance Rc, knowing the concentration C and recording ΔP as a
44 𝛼𝑖 =∆𝑃𝑐,𝑖
𝐽𝜇𝑚 Eq. 6
Filtrate retention zone
There are two types of filtration regarding the zone of retention, surface and depth filtration.
Surface filtration works by direct interception. Particles whose size is bigger than the pores are
stopped at the upstream surface of the filter. Depth filtration employs a medium with a significant thickness providing filtering in its depth. For this type of filtration, both of the phenomena of direct interception and retention occur; nonetheless, retention in depth remains the principal filtration mechanism. This kind of filters are density graded so that larger particles tend to be trapped at the surface and finer particles are trapped within the depth of the filter [33].
When filtration takes place there are two driving phenomenon:
- Retention of smaller passing particles within the pores by adsorptive forces and hence pore size reduction.
- A fouling cake formation that acts like a filter itself and grows progressively during the filtration process.
I.3. Filtration media
There are two main kinds of filters depending on the deposition area: the surface filtration
media and depth-type media (Figure 6).
45
Depth type media are often density-graded, with density increasing from the upstream to the
downstream. This graded structure increases the probability of retaining fine particles on their passage and is constituted by a matrix of randomly oriented fibers forming a tortuous assembly of flow channels [3]. These filters are categorized as fibrous, porous or cake-like media.
Surface filtration is due mainly to sieving; it means particles whose diameter is greater than the characteristic pore size at the surface on which flow is incident are retained on the filter surface. However, particles whose size is smaller than the pore can clog the system by different mechanisms as bridging and aggregation [26], [27], [49]. Surface filtration media are basically of three types:
- Screen type filter - Edge type filters - Stacked disk filters
The present study is focused on membrane filtration. Here below, a more detailed characterization of membranes is done.
II. Membranes
Membranes are classified as surface filtration media of screen type, they are currently used widely in engineering applications for the filtration of micron and sub-micron size particles from liquids, and gases.
There are different kinds of membranes, which are designed to be resistant to both feed and cleaning fluids; membranes should be mechanically and thermally stable, while having a high permeability and selectivity. The design of the membrane unit responds to the specific requirements of the target process, so that a compromise of the previous noted characteristics as well as the cost are taken into account to guarantee a stable and efficient operation.
Membranes vary in material composition, pore size, structure and relative isotropy. Regarding the material composition, they are made of synthetic polymers (polypropylene, perfluoropolymers, elastomers polyamides and polysulphones), modified natural products (cellulose based) and miscellaneous other materials (inorganic, carbon, ceramic, metals dynamic and liquid membranes). Membranes whose physical and chemical properties are the same among the whole structure are known as isotropic membranes, otherwise they are known as anisotropic membranes [33].
46 Recent studies have highlighted the advantages of dynamic membranes over the conventional microfiltration and ultrafiltration membranes by exploiting the fouling cake as a means of achieving solid-liquid separation [50]. An improvement in membrane manufacture yielded the development of microsieves, which are extremely fine screen filters (~1 µm) with identical pores in regular distributions and high permeabilities [25].
II.1. Membrane fouling and cake formation
Membrane fouling is the primary limiting issue in membrane filtration technology, and for this reason filtration optimization is intrinsically related to understanding of particle deposition at the membrane. Particle deposition is not only the first step, but also one of the major reasons for filtrate flux decline with time under flow and the associated membrane fouling [51]. Fouling causes a permeability decay, high energy consumption and a need for frequent cleaning or replacement [52].
Almost all feed components will foul the membrane to an extent that depends on the physicochemical nature of the membrane and the solute, and thus how they interact with each other [3]. There exist some fouling features that are inherent to feed stream flux:
Changes in membrane properties: result of physical or chemical deterioration of the membrane. Depending on the pressure, the membrane can undergo a slow deformation, i.e. “creep” or compaction that is permanent. Chemical deterioration is related to pH, temperature and other agents that attack the membrane material.
Change in feed properties: variations in the feed stream viscosity and diffusivity could be expected as the solid concentration varies within the cake layer, the transition and polarization zones or the suspension.
An extensive work on membrane fouling has been done. Fouling phenomena are the main cause of filtration efficiency loss and they are related to system clogging. Different clogging mechanisms related to suspended particles have been identified and models developed in order to predict flux decay and pressure rise.
Sieving is one of these mechanisms and is due to the surface accumulation of particles whose sizes are larger than the pores. This particle accumulation creates a porous medium of increasing thickness that continuously adds resistance to the flow [53]. However, this mechanism cannot be simplified into a simple geometrical problem. While for rigid particles it is a size exclusion
47 phenomenon, the different nature of the feed suspension adds complexity for the filtration of anisotropic and soft deformable particles, which is the more common case in industrial applications.
Particle bridging is another fouling mechanism. The combination of geometrical and hydrodynamic effects increase the particle volume fraction allowing the particles to form arches at constrictions like the pores. Converging flow and high particle concentration generates bridge-like structures composed of a few particles, typically between 2 and 10. Bridging happens most commonly for dense suspensions close to the jamming value, but can also occurs for low concentrations [27], [49].
The last mechanism is associated with particle aggregation. Short-range attractive van der Waals forces result in the formation of colloidal particle clusters in the bulk suspension or liquid interfaces when particles are close enough, and the same forces may cause adhesion to the pore boundaries. The work by van de Laar [26] used transient state theory to describe a balance of the driving forces resulting from advection and diffusion to rationalize how particles interact with each other and accumulate on the channel walls. This mechanism is associated with internal fouling as particles with smaller diameter than the pores (constrictions) are able to flow into, and partially through, the pores and start aggregating on the walls.
Figure 7. Different particle clogging mechanisms a) Sieving, b) Bridging and c) Aggregation Figure 7 illustrates the previous clogging mechanisms. The extension of the membrane fouling associated with each fouling mechanism depends on different filtration parameter; however, the common denominator is the contribution to the formation of a fouling layer, the cake. Many approaches addressing cake structure and the influence of particle interactions have been applied in order to better understand these mechanism involved in the filtration phenomenon [54], [55]. The filtration cake structure has been characterized through different in-situ and ex-situ observation
![Figure 1. Water withdrawal ratios by continent and usage in 2015 [2]](https://thumb-eu.123doks.com/thumbv2/123doknet/2946070.79705/31.892.190.698.669.1063/figure-water-withdrawal-ratios-continent-usage.webp)
![Table 4. Non-invasive methods applied to membrane processes [78].](https://thumb-eu.123doks.com/thumbv2/123doknet/2946070.79705/63.892.79.770.625.979/table-non-invasive-methods-applied-membrane-processes.webp)
![Figure 18.Principle of the spinning disk confocal laser scanning microscope [89]](https://thumb-eu.123doks.com/thumbv2/123doknet/2946070.79705/74.892.258.635.788.1071/figure-principle-spinning-disk-confocal-laser-scanning-microscope.webp)
![Figure 19. Experimental set up for PIV technique [94]](https://thumb-eu.123doks.com/thumbv2/123doknet/2946070.79705/75.892.229.666.684.1023/figure-experimental-set-up-piv-technique.webp)