OATAO is an open access repository that collects the work of Toulouse
researchers and makes it freely available over the web where possible
Any correspondence concerning this service should be sent
to the repository administrator:
[email protected]
This is an author’s version published in:
http://oatao.univ-toulouse.fr/22883
To cite this version:
Wong, Ka Wai Lawrence and Zhao, Jisheng and Lo Jacono,
David and Thompson, Mark C. and Sheridan, John
Experimental investigation of flow-induced vibration of a
sinusoidally rotating circular cylinder. (2018) Journal of Fluid
Mechanics, 848. 430-466. ISSN 0022-1120
Official URL:
https://doi.org/10.1017/jfm.2018.379
Experimental
investigation of flow-induced
vibration
of a sinusoidally rotating
circular
cylinder
K. W. L. Wong1, J. Zhao1,†, D. Lo Jacono2, M. C. Thompson1 and
J. Sheridan1
1Fluids Laboratory for Aeronautical and Industrial Research (FLAIR), Department of Mechanical and
Aerospace Engineering, Monash University, Melbourne, VIC 3800, Australia
2Institut de Mécanique des Fluides de Toulouse (IMFT), Université de Toulouse, CNRS, Toulouse,
France
The present experimental investigation characterises the dynamic response and wake structure of a sinusoidally rotating circular cylinder with a low mass ratio (defined as the ratio of the total oscillating mass to the displaced fluid mass) undergoing cross-stream flow-induced vibration (FIV). The study covers a wide parameter space spanning the forcing rotary oscillation frequency ratio 0 6 fr∗6 4.5 and the forcing rotation speed ratio 0 6 αr∗6 2.0, at reduced velocities associated with the vortex-induced vibration (VIV) upper and lower amplitude response branches. Here, fr∗= f
r/fnwand αr ∗= ΩoD/(2U), where fris the forcing rotary oscillation frequency, fnwis the natural frequency of the system in quiescent fluid (water), Ωois the peak angular rotation speed, D is the cylinder diameter and U is the free-stream velocity; the reduced velocity is defined by U∗ = U/( fnwD). The fluid–structure system was modelled using a low-friction air-bearing system in conjunction with a free-surface recirculating water channel, with axial rotary motion provided by a microstepping motor. The cylinder was allowed to vibrate with only one degree of freedom transverse
to the oncoming free-stream flow. It was found that in specific ranges of fr∗
, the body vibration frequency may deviate from that seen in the non-rotating case and lock onto the forcing rotary oscillation frequency or its one-third subharmonic. The former is referred to as the ‘rotary lock-on’ (RLO) region and the latter as the ‘tertiary lock-on’ (TLO) region. Significant increases in the vibration amplitude and suppression of VIV could both be observed in different parts of the RLO and TLO regions. The peak amplitude response in the case of U∗= 5.5 (upper branch) was observed to be 1.2D, an increase of approximately 50 % over the non-rotating case, while in the case of U∗= 8.0 (lower branch), the peak amplitude response was 2.2D, a remarkable increase of 270 % over the non-rotating case. Notably, the results showed that the amplitude responses at moderate Reynolds numbers (Re = UD/ν = 2060 and 2940, where ν is the kinematic viscosity of the fluid) in the present study showed significant differences from those of a previous low-Reynolds-number (Re = 350) numerical study at similar reduced velocities by Du & Sun (Phys. Fluids, vol. 14 (8), 2015, pp. 2767–2777). Remarkably, in an additional study examining the cylinder vibration as a function of U∗
while the fixed forcing rotary oscillation parameters
were kept constant at (f∗ r, α
∗
r) = (1.0, 1.0), the cylinder experienced substantially larger oscillations than in the non-rotating case, and a rotation-induced galloping response was observed for U∗ > 12, where the amplitude increased monotonically to reach approximately 3.0D at the highest reduced velocity (U∗ =
20) tested. Furthermore, new wake modes were identified in the RLO and TLO regions using particle image velocimetry measurements at selected points in the f∗
r−α ∗
r parameter space.
Key words: flow–structure interactions, vortex streets, wakes
1. Introduction
Flow-induced vibration (FIV) of elastically mounted bluff bodies is observed in phenomena as diverse as the vibration of cooling arrays in nuclear power plants, the oscillations of a flagpole in the wind and the vibration of offshore oil risers in tidal currents. These vibrations can compromise the integrity of engineering structures and even cause catastrophic failures. Design methods used to avert such effects require a thorough understanding and prediction of their occurrence and characteristics. This has motivated numerous studies that have aimed to characterise the fluid–structure system and better understand the vibration mechanisms. Surveys of the field are covered in reviews by Griffin, Skop & Koopmann (1973), Bearman (1984), Carberry, Sheridan & Rockwell (2001), Sarpkaya (2004), Williamson & Govardhan (2004) and Gabbai & Benaroya (2005), and books by Blevins (1990), Naudascher & Rockwell (2005) and Païdoussis, Price & De Langre (2010), among others. Flow-induced vibration, on the other hand, could also find applications in vibration control, and energy harvesting where significant body oscillations can be utilised. Comprehensive reviews on this topic are given by Xiao & Zhu (2014) and Young, Lai & Platzer (2014).
There are two typical FIV body oscillator phenomena: vortex-induced vibration (VIV) and galloping (see Naudascher & Rockwell 2005). Vortex-induced vibration is caused by vortices shed from a body, which in turn exert fluctuating forces on the body and, if it is elastic or elastically mounted, then cause structural vibration under resonant conditions. Since the pioneering experimental study by Brooks (1960), VIV has been extensively investigated using the canonical model of an elastically mounted rigid circular cylinder that is free or forced to oscillate transversely in a free stream (Bishop & Hassan 1964; Feng 1968; Bearman 1984; Williamson & Roshko 1988; Govardhan & Williamson 2000; Carberry et al. 2001; Morse & Williamson 2009; Zhao et al. 2014a).
A phenomenon fundamental to VIV is the synchronisation between the structural vibration and the vortex shedding (also known as ‘lock-in’ or wake–body synchronisation), where the vortex shedding frequency ( fsh) deviates from the Strouhal frequency (fSt) of a stationary cylinder and matches the body oscillation frequency ( fy). While there exist differences in the definition of lock-in in the literature, the definition used in the present study follows that given by Sarpkaya (1995), that the body vibration frequency matches that of the fluctuating transverse lift force. When lock-in occurs, in general, significantly large body oscillations are encountered. Thus, researchers are interested in how the cylinder will respond when fsh is forced to deviate from both fSt and fy. The present study promotes this frequency deviation by imposing sinusoidal rotary oscillations on an elastically mounted circular cylinder. Similar mechanical configurations could have practical applications in offshore
engineering, where rotary oscillations of drill shafts could be utilised to decrease or even suppress VIV. On the other hand, energy harvesting could utilise rotary oscillations of long slender structures to promote VIV and enhance body oscillations for power production. Such applications require better understanding and prediction of the structural vibration response under different conditions of the flow a nd the imposed rotary oscillation.
A number of active VIV control methods have been proposed and studied over the past four decades. However, some of these methods are sensitive to the flow orientation and may lose their effectiveness as the flow d irection i s c hanged. An active control method that is insensitive to the flow o rientation i s s inusoidally driven rotary oscillations of a circular cylinder. The angular speed of the sinusoidal rotary oscillation imposed on the cylinder is governed by
Ω = Ωosin(2πfrt), (1.1) where Ωo is the peak angular velocity and fr is the forcing rotary oscillation frequency.
For a rigidly mounted cylinder undergoing sinusoidally driven rotary oscillations, synchronisation between the vortex shedding and the forcing rotary oscillations is a phenomenon of significant interest. Such synchronisation was observed numerically and experimentally over a wide Reynolds-number (defined by Re = UD/ν, with U the free-stream velocity, D the cylinder diameter and ν the kinematic viscosity of the fluid) range of 40< Re < 6100 by Okajima, Takata & Asanuma (1975), who found that the vortex shedding frequency deviated from the Strouhal frequency and locked onto the forcing frequency. This phenomenon has commonly been referred to as ‘lock-on’ since. Here, it should be noted that lock-on should not be confused with lock-in, which is a term commonly used to refer to the wake–body synchronisation in FIV. Later, Taneda (1978) reported that at Re = 30–300, rotary oscillations at high fr could almost eliminate vortex shedding and the recirculation region in the near wake of the cylinder.
More recent studies have further investigated the fluid forces and their phases with respect to the body rotary oscillations and the wake structure over wider parameter space. Tokumaru & Dimotakis (1991) reported a sixfold reduction in drag compared with the non-rotating case at some optimal forcing parameters at Re =15 000. However, this was not observed in other studies. Choi, Choi & Kang (2002) suggested that the discrepancy might result from large differences in Re. More recent numerical work by Cheng (2001), Cheng, Liu & Lam (2001) and Choi et al. (2002) has shown that there is no significant reduction in the lift with sinusoidally driven rotary oscillations over most forcing parameters. In fact, within the lock-on regime, the lift can be enhanced significantly by rotary oscillations. Moreover, Cheng (2001), Cheng et al. (2001) and Choi et al. (2002) demonstrated that lock-on could occur over a wide parameter space of the maximum rotary speed rate,α∗
r =ΩoD/(2U), and the normalised forcing rotary oscillation frequency (equivalent Strouhal number), Stfr = frD/U. Baek & Sung (1998), Cheng (2001), Cheng et al. (2001) and Choi
et al. (2002) have documented the presence of frequency modulation in the fluid forces. However, the conditions at which this occurs are disputed. Choi et al. (2002) elaborated that the presence of frequency modulation is the result of discrepancies between fr and fsh of a non-rotating cylinder, and it exists at varying levels of influence when the fluid–structure system is not under lock-on.
Nevertheless, Cheng et al. (2001) and Choi et al. (2002) reported that the frequency modulation has a significant influence on the wake structure. A number of wake
modes associated with rotationally oscillating cylinders, such as modes I and II, were reported in Okajima et al. (1975), Tokumaru & Dimotakis (1991), Chou (1997), Cheng (2001), Cheng et al. (2001) and Choi et al. (2002). An interesting wake mode was reported in Chou (1997), Cheng (2001) and Cheng et al. (2001), which consisted of a counter-rotating tandem vortex pair shed per half shedding cycle. In this wake mode, each vortex pair is composed of a larger primary vortex followed by the shedding of a smaller secondary vortex; the secondary vortex orbits around the primary vortex as the pair moves downstream. This is not unexpected, as the rotary oscillation forces the shedding of high-strength compact primary vortices, which draw across opposite-signed vorticity from the opposite side of the cylinder to form orbiting secondary vortices.
More recently, Du & Sun (2015) appear to have been the first to investigate FIV of an elastically mounted circular cylinder undergoing sinusoidally driven rotary oscillations in two-dimensional flow. Their study was conducted numerically at a low Reynolds number Re = 350 over the reduced velocity range U∗=
4.0–5.5. It should be noted that the reduced velocity is defined by U∗=
U/( fnD), where fn is the natural frequency of the system. Due to the addition of free transverse body vibration, Du & Sun (2015) redefined the forcing rotary frequency in a non-dimensional form by f∗
r =fr/fn, a definition also adopted in the present work. They found that lock-on occurred even at the early stage when the structure started to oscillate transversely to the free-stream flow, and that its occurrence was dependent on α∗
r and f ∗
r. When the system was under lock-on, a significant reduction in the transverse oscillation amplitude could be achieved. However, there was an exception that large-amplitude oscillations were encountered with a forcing rotary frequency at f∗
r ≈1. Furthermore, they reported that at f∗
r = 1.3 and U ∗ =
5.0, the effectiveness of forcing rotary oscillations increased with α∗
r, and at α ∗
r & 1.3 to attenuate the body vibration amplitude to less than 0.05D. Interestingly, Du & Sun (2015) also observed tandem vortex pairs; however, the detailed behaviour was not described and in particular whether the same orbiting structure was observed.
In summary, the previous study by Du & Sun (2015) has numerically investigated the vibration responses and wake modes, but only for limited cases in the forcing parameter space and at a relatively low Reynolds number. Their study focused on reduced velocities associated with the transition between the initial and upper branches of VIV of a non-rotating cylinder. The present work is an attempt to experimentally study this problem over a higher Reynolds-number range, where the VIV response is likely to be less sensitive to Reynolds-number variations. Thus, the findings are likely to be more applicable to typical physical/industrial applications, where Reynolds numbers are generally higher. This investigation also aims to study the vibration response and wake structure over a wider parameter space of α∗
r and f ∗ r at two reduced velocities associated with the upper and lower branches in the lock-in regime of VIV of a non-rotating cylinder. Additionally, the present study appears to be the first to investigate the structural vibration response with fixed forcing rotary oscillation parameters at (f∗
r, α ∗
r) = (1, 1) over a wide range of reduced velocity. The structure of the remainder of the paper is as follows. The experimental methodology, including experimental details and a validation study, is presented in §2. The results and discussion are presented in §3. Finally, conclusions are drawn in §4.
Side view. Back view.
A photograph of the experimental rig. Air-bearing system
Cylinder Supporting structure Rotor
Air-bearing shaft Laser sheet Laser head Camera Platform Force balance Moving carriage x y z z U (a) (b) (c)
FIGURE 2. (Colour online) Schematics of the present experimental set-up in two different
views in (a,b), with a photograph of the system in (c).
shedding and to reduce end effects of the cylinder, a conditioning platform was placed under the cylinder, and a gap between the cylinder end and the platform surface was set to approximately 1 mm(0.03D) (see Khalak & Williamson 1997, 1999; Zhao et al.
2014a,b; Wong et al. 2017; Zhao et al. 2018).
The sinusoidal rotary motion of the cylinder was controlled using a motion control system consisting of a controller (model 6K2; Parker Hannifin, USA), a motor drive (model E-DC) and a miniature low-voltage microstepping motor (model LV172) with a resolution of 25 000 steps per revolution (see Wong et al. 2017; Zhao et al. 2018). The total oscillating mass, including the cylinder, motor assembly and moving components of the air-bearing system, was m = 2479 g and the mass of the displaced fluid was md=ρπD2L/4 = 433 g, where ρ is the water density, resulting in a mass
436 K. W. L. Wong, J. Zhao, D. Lo Jacono, M. C. Thompson and J. Sheridan ratio of m∗=
m/md=5.73. The natural frequencies of the system and the structural damping in both air and water were determined through free-decay tests conducted individually in air and in quiescent water. The natural frequency was found to be fna =0.468 Hz in air and fnw =0.429 Hz quiescent water. The structural damping ratio with consideration of the added mass was ζ = c/(2√k(m + mA)) ' 2.44 × 10⁻³, where mA is the added mass, determined by mA=(( fna/fnw)2−1)m.
2.2. Data acquisition and processing methods
The data acquisition (DAQ) and the control of the free-stream velocity and the rotary motion of the cylinder in the U∗–α∗
r–f ∗
r parameter space were automated using customised LabVIEW (National Instruments, USA) programs (see Wong et al.
2017). Two fixed reduced velocities, U∗ =
5.5 and 8.0, selected from the upper and lower branches in the non-rotating VIV case respectively, were tested in the present study. The corresponding Reynolds numbers for these two cases were 2060 and 2940 respectively. While the experiments were undertaken, the temperature fluctuations were less than ±0.5◦
C; therefore, fluctuations in the kinematic viscosity with temperature were considered to be minimal. The velocity ratio was varied over the range 06 α∗
r 6 3.5 in increments ranging from 0.05 to 0.2 and the rotary frequency ratio was varied over the range 06 f∗
r 6 4.5 in increments ranging from 0.05 to 0.1.
The cylinder displacement was measured using a non-contact digital optical linear encoder with a resolution of 1 µm (model RGH24; Renishaw, UK). The body oscillation amplitude and frequency, the fluid forces and corresponding phases were calculated based on the highly accurate displacement measurements (see Zhao et al.
2018). The rotary motion of the cylinder was measured using a digital optical rotary encoder with a resolution of 4000 counts per revolution (model E5-1000; US Digital, USA). For each point in the U∗
–α∗ r–f
∗
r parameter space, the DAQ measurements were sampled at 100 Hz for 300 s (for at least 100 oscillation cycles). Sufficient transition time (240 s) was given between changing either α∗
r or f ∗
r to allow the FIV response to fully develop before recording the signal sequences. The measurement signals were filtered using a fourth-order low-pass Butterworth filter with a cutoff frequency of 10 Hz to remove high-frequency noise. Fast Fourier transforms (FFTs) were used for frequency analysis. The relative phases between the exciting fluid forces and the body motion were calculated using the Hilbert transform.
To capture the vortex structures in the near wake of the cylinder, the particle image velocimetry (PIV) technique was employed. The flow was seeded with hollow microspheres (model Sphericel 110P8; Potters Industries Inc.), which had a normal diameter of 13 µm and a specific weight of 1.1 g m−3. The particles were illuminated by a 3 mm thick horizontal planar laser sheet from two miniature Ng:YAG pulse lasers (model Continuum Minilite II; USA). Imaging was performed using a high-speed camera (model Dimax S4; PCO AG, Germany) with a resolution of 2016 × 2016 pixel2. This camera was equipped with a 50 mm lens (Nikon Corporation, Japan), giving a magnification factor of 11.95 pixels per mm for the field of view of interest. For each PIV imaging location in the U∗
–α∗ r–f
∗
r parameter space, 3100 image pairs were recorded for quantitative analysis. The PIV image pairs were captured at 11 Hz using a TTL pulse generator. The TTL signals were sampled simultaneously with the cylinder displacement at 1000 Hz. This allowed the instantaneous cylinder position to be accurately located for phase-averaging of the PIV images. To provide fine resolution of the evolving wake structures, which could be perturbed quickly by
0.5 1.0 1.5 2.0 0 0.5 1.0 1.5 2.0 2.5 3.0 3.5 4.0 4.5 0 0.5 1.0 1.5 2.0 2.5 3.0 3.5 4.0 0.5 1.0 1.5 2.0 0 0.5 1.0 1.5 2.0 2.5 3.0 3.5 4.0 4.5 0 0.5 1.0 1.5 2.0 2.5 3.0 3.5 4.0 RLO TLO RLO TLO 1.0 1.2 0 SW 2S 2S 4S 4S 2P CS 0.2 0.4 0.6 0.8 (a) (b) 0 0.2 0.4 0.6 0.8 1.0 1.2 1.4 1.6 1.8 2.0
FIGURE 4. (Colour online) The amplitude response (A∗
10) contours in the f ∗ r−α
∗
r parameter space for the two reduced velocities U∗
=5.5 and 8.0 in (a) and (b) respectively. The boundaries of the RLO and TLO regions are designated by the dashed and dotted lines respectively. The points identified by different symbols represent different wake modes observed through PIV measurements; these modes will be presented in §3.3.
f∗
r for each fixed α ∗
r, as illustrated in figure 5 and discussed in §3.1.1. Apparently, RLO is similar to the conventional lock-on that has been observed in cases of rigidly and elastically mounted cylinders undergoing rotary oscillations. However, while
locking of the vortex shedding frequency to the one-third subharmonic of the forcing frequency (fsh ∼= fr/3) has been reported in previous studies of a rigidly mounted cylinder (see Choi et al. 2002; Thiria, Goujon-Durand & Wesfreid 2006), TLO does not yet seem to have been reported for a transversely oscillating cylinder.
Clearly, these lock-on regions are dependent on both of the forcing parameters, f∗ r and α∗
r. For the case of U ∗=
5.5, the RLO region occurs in a narrow band around f∗
y =1 for α ∗
r < 1, and it becomes rapidly wider, with the lower boundary decreasing towards f∗
y ≈0.5 and the upper boundary increasing towards f ∗
y ≈3.0 at α ∗
r =2.0. The TLO region, on the other hand, occurs within the range of 3.0 . f∗
r < 3.4 at α ∗ r =0.1, and the range becomes wider gradually for α∗
r up to 0.5, prior to shrinking again, resulting in a triangular shaped region terminating at α∗
r '1.6 (also see figure 11). For the case of U∗=
8.0, the occurrence of RLO is observed at f∗
r,VIV'1, which is slightly higher than f∗
r =1, for α ∗
r=0.1. Then, the RLO region expands gradually with increasing α∗
r, to cover the range of 0.75 < f ∗
r < 2.75 at α ∗
r=2.0. Unlike the situation for U∗ =
5.5, TLO at this U∗
is observed to occur at a considerably higher rotary frequency ratio f∗
r ≈3.4 (or f ∗
r,VIV≈3.25), covering a very narrow f ∗
r range, at α ∗ r=0.1. This is expected due to mass-damping effects, which can also cause the body vibration frequency fy to deviate from fnw in the VIV lower branch for a non-rotating cylinder. For 0.1 < α∗
r 6 0.5, the TLO range expands rapidly, with the lower limit reaching f∗
r ≈3.0 but the upper limit beyond the maximum rotary frequency ratio (f ∗ r =4.5) tested in the present study. However, similarly to the case of U∗=
5.5, the RLO range shrinks to show a triangular shaped region in f∗
r–αr parameter space, as α∗r is further increased, and terminates at α∗
r '1.5 and f ∗
r '3.1 (f ∗
r,VIV'3.0). The dynamic response for these two U∗
cases will be further investigated in §§3.1.1
and 3.1.2. Furthermore, the wake patterns identified using PIV measurements marked by symbols in figure 4 will be presented in §3.3.
3.1.1. Dynamic response at various fixed α∗
r values for U ∗=
5.5
To provide further insight into RLO and TLO, the dynamic response, including the amplitude response, the frequency PSD contours of the body vibration and the vortex force, the coefficients of the transverse total lift and the vortex forces, and the corresponding phases with respect to the body displacement, is examined as a function of f∗
r for different fixed rotary velocity ratios of α ∗
r =0.5, 1.0 and 2.0, as shown in figures 5–7 respectively.
At α∗
r =0.5, as shown in figure 5, the amplitude response remains consistent at A∗
10≈0.8 for f ∗
r < 0.75, slightly higher than A ∗
10'0.77 measured for the non-rotating case (as illustrated by the horizontal dashed line in figure 5a). When f∗
r is increased to around 0.9, the body vibration frequency starts to lock onto the forcing frequency (figure 5b), which is indicative of the occurrence of RLO. Interestingly, on the other hand, the vortex force frequency also switches to a clear lock-on state from that exhibiting frequency components matching fnw and fr at lower fr∗ values (see figure 5c). Further increase of f∗
r sees an increasing trend of the vibration amplitude to reach a local peak value of A∗
10'0.93 at f ∗
r =1. Interestingly, at this point, the dominant frequency of the vortex force jumps suddenly to 3fnw, indicating that the vortex shedding is not synchronised with the forcing motion and the body vibration at f∗
r =1. This will be demonstrated further in figure 10. After this local peak, the amplitude response decreases sharply to A∗
10'0.3 at f ∗
r ≈1.2, while both fy and fCv
resume locking on to fr. Correspondingly, the root-mean-square (RMS) transverse lift coefficient follows a variation similar to that of A∗
10, rising to reach a peak of CRMS
y ≈1.8 at f ∗
r =1, prior to an abrupt drop to ∼0.35 at f ∗
–0.1 0.1 0.2 0.3 –0.2 –0.3 0 –2 –1 0 1 2 –90 –45 0 45 90 135 180 225 270 0 5 10 15 20 (a) (b) (c)
FIGURE 8. (Colour online) Sample time traces of the normalised body displacement (a),
the fluid forces (b) and the phases (c) at (f∗ r, α
∗
r) = (1.15, 0.5) from the RLO region of the case U∗
=5.5. In (b,c), the black lines represent the components associated with the transverse lift while the blue lines represent the components associated with the vortex force. It should be noted that τ = t × fnw is the normalised time. For more details, refer to the caption of figure 5.
causes the A∗
10 response and C RMS
y to drop sharply to their local minima (A ∗ 10 ≈0.3 and CRMS
y ≈0.3, close to the magnitude of the non-rotating case) at f ∗ r =1.3.
Compared with VIV of a non-rotating cylinder, the body oscillations in the RLO region appear to be less periodic. To illustrate this, figure 8 shows sample time traces of the normalised cylinder displacement, the fluid force coefficients and the phases at f∗
r =1.15. As can be seen, although the body oscillation frequency exhibits a clear dominant component matching the forcing frequency (figure 5b), the amplitudes of the cylinder displacement and the fluid forces vary over time; however, the corresponding phases are relatively stable at 180◦
.
After the RLO region, the frequency response returns to the VIV lock-in state, and A∗
10 increases rapidly with f ∗
r. For the higher range 1.3 < f ∗
r < 2.4, the A ∗
10 values remain fairly stable around 0.7, except for a small rise up to ∼0.8 at the second harmonic of the forcing frequency f∗
r =2. Increase of f ∗ r in the range 2.4 < f ∗ r < 2.6 results in a gradual decrease in A∗
10 to 0.45, and also a slow decrease in f ∗
y towards the third harmonic of the forcing frequency (fy∼=fr).
0.4 0.8 –0.4 –0.8 0 –2 –1 0 1 2 –90 –45 0 45 90 135 180 225 270 0 5 10 15 20 (a) (b) (c)
FIGURE 9. (Colour online) Sample time traces of the body displacement (a), the fluid
forces (b) and the phases (c) at (f∗ r, α
∗
r) = (2.75, 0.5) from the TLO region of the case U∗
=5.5. For more details on the symbols and lines in the plots, refer to the captions of figures 5 and 8.
As the cylinder initially undergoes TLO, there is a sharp increasing trend in both A∗
10 and C RMS
y to reach their local peak values (A ∗
10 '0.82 and C RMS
y '1.8) as fy approaches fVIV at fr∗ '2.8. With further increase of f
∗ r, A
∗
10 decreases gradually to 0.5 at the end of the TLO region (f∗
r =3.5). Meanwhile, C RMS
y decreases rapidly to a minimum value of 0.4 at f∗
r =3.3, prior to a rapid increase to 0.95 at f ∗ r =3.5. Corresponding to this inflection change, φt undergoes a sharp jump from 0
◦
to 180◦ . On the other hand, CRMS
v increases gradually from 0.6 at fr∗'2.6 to 0.8 at f ∗ r '2.8 and then decreases to a minimum of 0.3 at f∗
r ≈3, prior to a rapid increase to a peak value of ∼2 at the end of the TLO region. Associated with the inflection point of CRMS
v at fr∗≈3, φv also undergoes a sharp jump from 0
◦ to 180◦. Of further interest, the vortex shedding frequency exhibits components at fr/3 and fr in the TLO region. Unlike the RLO region, the body oscillations and the fluid forcing coefficients are highly periodic in the TLO region. As illustrated in figure 9, the cylinder displacement and fluid forcing components are highly periodic, with stable amplitudes over time; correspondingly, both φt and φv remain very stable around 0◦.
For higher f∗
r values beyond the TLO region, A ∗
10 fluctuates slightly about 0.5, while the frequency responses indicate a locked-in VIV state. Moreover, both CRMS
y and C RMS v tend to decrease from their local peaks to the magnitude of the non-rotating case. On the other hand, however, while φv remains consistently at 180◦
446 K. W. L. Wong, J. Zhao, D. Lo Jacono, M. C. Thompson and J. Sheridan 160◦
, distinctly different from the in-phase state of the non-rotating case. Apparently, the vibration response exhibits some features similar to those of the lower branch of the non-rotating case, e.g. the magnitudes of A∗
10, f ∗
y, φt and φv. For the higher velocity rate α∗
r =1.0 shown in figure 6, while most of the trends previously described for α∗
r =0.5 persist, there are some noticeable changes in the vibration response, associated with an increase in α∗
r. Compared with the case of α∗
r =0.5, RLO occurs over a slightly wider range, 0.75 . f ∗
r . 1.3, with more distinct boundaries present in the A∗
10 response. On the other hand, the TLO region lies in a much narrower range of 2.8 . f∗
r . 3.2, with an abrupt drop in the A ∗
10 response at the end of the TLO region. In both the RLO and TLO regions, the local peaks of A∗
10 do not seem to be affected by the increase of α∗
r. Outside these regions, despite a slight increase at low f∗
r values, the A ∗
10 response is generally attenuated, e.g. the A ∗
10 values are reduced to less than 0.6 for most of the f∗
r range between the RLO and TLO regions, and to less than 0.5 for most of the f∗
r range investigated beyond the TLO region. In particular, the locking to the second harmonic of fr disappears. Moreover, it should be noted that, while the general trends of φt and φv are similar to the case of α∗
r =0.5, φt jumps down to approximately 0◦ for fr∗ values beyond the TLO region. When the rotation rate is increased to the highest value (α∗
r =2.0) tested in this f∗
r–α ∗
r parameter space study, the RLO region becomes strikingly wider to extend over the forcing frequency range 0.5 6 f∗
r 6 1.8, as shown in figure 7. At the onset of RLO at f∗
r '0.5, the amplitude response drops abruptly from A ∗
10 ≈0.77 (slightly lower than that of the non-rotating case) to ∼0.45 and then increases rapidly with f∗
r, to reach a local peak of 0.8 at f ∗ r =1. Meanwhile, both C RMS y and C RMS v tend
to drop from their peaks (CRMS
y ≈3 and C RMS
v ≈2.75) to minima (CRMSy ≈0.25 and CRMS
v ≈0.3). Further increase of the forcing frequency sees a rapid decrease in the amplitude response to A∗
10< 0.05 at f ∗
r =1.8. Meanwhile, both φt and φv jump abruptly from 0◦
initially to 180◦
. Moreover, both CRMS
y and C RMS
v first increase gradually to reach their local peaks (CRMS
y ≈0.6 and C RMS
v ≈1.6) at fr∗ ≈1.2 and then decrease gradually to a similar magnitude of 0.25 at f∗
r =1.8, which is expected from the extremely low oscillation amplitudes. As the forcing frequency is further increased in the range 1.8 < f∗
r < 3.1, the amplitude response and the force coefficients are further attenuated. It should also be noted that, while the dominant body oscillation frequency matches the forcing frequency, the fVIV component becomes stronger gradually; on the other hand, the vortex shedding frequency remains locked on to the forcing rotary oscillation frequency in this f∗
r range. As a result, both φt and φv tend to decrease gradually from 180◦
to 90◦
. For the remaining range 3.1 < f∗
r 6 4.5, the body vibration returns to the state of non-rotating VIV lock-in, resulting in increasing trends of A∗
10 to 0.4, CRMS
y to 0.2 and C RMS
v to 0.5. On the other hand, φv, as expected, remains consistently at 180◦
, and φt is observed to remain around 0◦ for both ends of this fr∗ range, with an abrupt narrow plateau at approximately 120◦
for the range 3.6 6 f∗ r 6 3.8. Furthermore, it is of particular interest that the TLO region is fully suppressed. Compared with the previous lower-α∗
r cases, despite an increase in A ∗
10 for low forcing frequency rates (f∗
r < 0.5), the body oscillations are significantly attenuated for most of the f∗
r range tested, and suppressed within the RLO region. To better show the effect of α∗
r on the vibration response, a secondary study was conducted over a larger range of 06 α∗
r 6 3.5 with fine increments at two different fixed f∗
r values. This was motivated by a desire to better understand whether the RLO region persists and to see whether the TLO region reappears at higher α∗
r. Figure 10 presents the vibration response as a function of α∗
(CRMS
y ≈0.3). On the other hand, C RMS
v drops sharply to ∼0.5 as α∗r is increased to 0.3, and then it follows a trend similar to that of CRMS
y , remaining at ∼0.6 for α ∗ r up to 1.3, prior to decreasing to ∼0.4 at α∗ r =3.5. Unlike C RMS y , the C RMS
v values are considerable lower than those of the non-rotating case throughout the α∗
r range. Furthermore, the phases φt and φv remain very stable at 0◦ and 180◦ respectively across the αr∗ range.
For the fixed forcing frequency ratio at f∗
r =3.0, the TLO phenomenon is observed to occur over the range of 0< α∗
r 6 1.6, as evidenced by the dominant frequency component of f∗ y locking on to 3f ∗ r (f ∗ y ∼ =3f∗
r ≈1 shown in figure 11b). As shown in figure 11(a), despite a slight increase at the onset of TLO, the A∗
10 response remains very stable at the magnitude of the non-rotating case for α∗
r up to 1.3, prior to a sudden drop to 0.45. As α∗
r is further increased in the rest of the TLO region, the amplitude response decreases gradually to A∗
10 ≈0.2 at f ∗
r =1.6. In this range (1.3 < α∗
r < 1.6), the vortex shedding frequency exhibits a very strong component at fnw, while its dominant component appears to be at 3fnw across the α∗r range tested. Interestingly, after this TLO region, the body oscillation frequency becomes dominated by its third harmonic component ('3fnw), while the first harmonic component still remains strong. Associated with this behaviour, the body oscillation is fully suppressed forα∗
r up to 2.7. Unexpectedly, a further increase of α ∗
r sees a secondary TLO region for the rest of the α∗
r values, resulting in a small bump in the α ∗
r response with a peak of ∼0.2 at α∗
r≈3.1. Again, the vortex shedding frequency exhibits a very strong secondary component at fnw in this ‘bump’ region. On the other hand, both CRMSy and CRMS
v follow a reverse-bell-shape trend similar to that seen for A∗10. They decrease rapidly from plateaus of CRMS
y ≈0.8 and C RMS
v ≈0.5 to their minima when the TLO is lost at f∗
r ≈1.6. In the secondary TLO region, they also see small bumps centred at α∗
r ≈3.1. Furthermore, while both φt and φv are found to fluctuate around 90◦ when the cylinder vibration is suppressed over the range 1.6 < α∗
r 6 2.7, they remain stable at 0◦
and 180◦
respectively in the two TLO regions. 3.1.2. Dynamic response at various fixed α∗
r values for U ∗=
8.0
Previous studies have shown that the body oscillations of a non-rotating cylinder in the lower branch are highly periodic and can be represented by a sinusoidal function (see Morse & Williamson 2009; Zhao et al. 2014a). Thus, it is of interest to investigate the effect of forcing rotary oscillations on the transverse body vibration in the lower branch. In this subsection, the vibration response as a function of f∗ r is examined for U∗ =
8.0 as a representative location in the lower branch of the non-rotating case, again with the same three fixed forcing velocity ratios of α∗
r =0.5, 1.0 and 2.0, as shown in figures 12–14 respectively.
For the case of α∗
r =0.5 in figure 12, the vibration response quantities exhibit general trends similar to those of the previous case with the same fixed α∗
r at U∗=
5.5. In the present case, the A∗
10 values appear to be stable at 0.7, slightly larger than that of the non-rotating case for the low forcing frequency ratios 0< f∗
r . 0.7. Within this f∗
r range, the body vibration frequency is moderated by the interaction of fVIV (as the dominant component) and fr, resulting in beating-like behaviour in the body oscillation. To illustrate this, figure 15 shows sample time traces of the cylinder displacement along with the fluid forces and phases at(f∗
r, α ∗
r) = (0.65, 0.5). As can be seen in figure 15(a), the cylinder vibrates with varying amplitude from cycle to cycle. However, the time series of the fluid forces and the phases in figure 15(b,c) indicate that the dynamic response is strongly periodic. In fact, such beating-like behaviour was also observed with similar forcing parameters at U∗ =
0 0.5 1.0 1.5 2.0 2.5 3.0 3.5 4.0 4.5 –45 0 45 90 135 180 225 0.5 0 1.0 1.5 2.0 0 1 2 3 4 0 1 2 3 4 0.5 0 1.0 1.5 0 –0.5 –1.0 –1.5 –2.0 –2.5 –3.0 RLO TLO (a) (b) (c) (d) (e)
FIGURE 12. (Colour online) Vibration response quantities as a function of f∗
r at a fixed forcing velocity ratio of α∗
r =0.5 for the non-rotating VIV lower-branch case U ∗
=8.0. For further details, refer to the caption of figure 5.
which results in the behaviour of ‘sliding’ through 360◦
in φt. As fr∗ is increased to 0.95, while the frequency component matching fr becomes much stronger, the body oscillation amplitude increases gradually to A∗
10 ≈ 0.9, similar to that with the same forcing parameters at U∗ =
5.5. However, there are also some significant differences in the evolution of the vibration response with increasing f∗
r. When RLO occurs at f∗
r =1.0, the A ∗
0 0.5 1.0 1.5 2.0 2.5 3.0 3.5 4.0 4.5 –45 0 45 90 135 180 225 0.5 0 1.0 1.5 2.5 2.0 0 1 2 3 4 0 1 2 3 4 0.5 0 1.0 2.0 1.5 0 –0.5 –1.0 –1.5 –2.0 –2.5 –3.0 RLO TLO (a) (b) (c) (d) (e)
FIGURE 13. (Colour online) Vibration response quantities as a function of f∗
r at a fixed forcing velocity ratio of α∗
r =1.0 for the non-rotating VIV lower-branch case U ∗
=8.0. For further details, refer to the caption of figure 5.
increases sharply to reach a peak of 1.3 at fr=1.1. This peak value is approximately 40 % greater than that of the same α∗
r case at U ∗=
5.5. The occurrence of the A∗ 10 peak is also associated with a jump in φt from 0◦ to 180◦. Further, the present RLO region extends to a much higher forcing frequency ratio of f∗
r =1.6. Over this region (1.1 < f∗
r 6 1.6), the cylinder vibration is highly periodic, with both φt and φv remaining consistently stable at 180◦, similar to the low-branch VIV response of
0 0.5 1.0 1.5 2.0 2.5 3.0 3.5 4.0 4.5 –45 0 45 90 135 180 225 0.5 0 1.0 1.5 3.0 2.5 2.0 0 1 2 3 4 0 1 2 3 4 0.5 0 1.0 2.5 2.0 1.5 0 –0.5 –1.0 –1.5 –2.0 –2.5 –3.0 RLO (a) (b) (c) (d) (e)
FIGURE 14. (Colour online) Vibration response quantities as a function of the forcing f∗
r at a fixed forcing velocity ratio of α∗
r =2.0 for the non-rotating VIV lower-branch case U∗
=8.0. For further details, refer to the caption of figure 5.
a non-rotating cylinder. To illustrate this, figure 16 shows sample measurements at (f∗
r, α ∗
r) = (1.15, 0.5). In the higher-f ∗
r range between the RLO and TLO regions, the body vibration is generally attenuated by the rotary oscillation for both U∗
cases; however, lock-on at f∗
r =2.0 is not observed for the current case. Furthermore, the present TLO region occurs over a much wider range of 2.9 . f∗
r . 4.4. Remarkably, the amplitude peak in the TLO region is observed to be A∗
0 5 10 15 20 –45 –90 0 45 90 135 180 270 225 –2 –1 0 1 –1 0 1 2 (a) (b) (c)
FIGURE 15. (Colour online) Sample time traces of the body displacement (a), the fluid
forces (b) and the phases (c) at (f∗ r, α
∗
r) = (0.65, 0.5) from the TLO region of the case U∗
=8.0. For more details on the symbols and lines in the plots, refer to the captions of figures 5 and 8.
f∗
r =3.0, which is of the same magnitude as that in the RLO region, an increase of approximately 120 % over the non-rotating case, and almost two times that observed in the TLO region at the same fixed α∗
r at U ∗=
5.5. At the fixed forcing velocity ratio of α∗
r =1.0 shown in figure 13, despite some small changes, the general trends of the vibration response remain very similar to the case of α∗
r =0.5 at the same U
∗. Clearly, the RLO region becomes wider over the range 0.95 6 f∗
r 6 1.7, while the TLO region shrinks to the range 3.0 6 f ∗ r 6 3.4. Interestingly, unlike the case of U∗
that sees a decreasing trend of the A∗
10 peak in the RLO region with increasing α∗
r (figure 10a), the A ∗
10 peak is observed to be 1.8, an increase of 12.5 % over that of the previous case α∗
r =0.5. On the other hand, the peak amplitude response in the present TLO region is found to be A∗
10'1.2, which is indicative of a decreasing trend in the A∗
10 peak with increasing α ∗
r in the TLO region. This decreasing trend is similar to that seen at U∗=
5.5. As the velocity ratio is increased to α∗
r =2.0 in figure 14, while the TLO region disappears, the RLO region is further widened to encompass the range 0.95 6 f∗
r 6 2.2, in which the A∗
10 peak is also found to increase to 2.2, an increase of approximately 270 % over the non-rotating case. The increasing trend in the A∗
10 peak value with α∗
r in the RLO region is consistent with the A ∗
10 contour map in figure 4(a). Beyond its peak, the A∗
10 response decreases rapidly as f ∗
0 5 10 15 20 –45 –90 0 45 90 135 180 270 225 –3 –2 –1 0 1 –1 0 1 3 2 (a) (b) (c)
FIGURE 16. (Colour online) Sample time traces of the body displacement (a), the fluid
forces (b) and the phases (c) at (f∗ r, α
∗
r) = (1.15, 0.5) from the RLO region of the case U∗
=8.0. For more details on the symbols and lines in the plots, refer to the captions of figures 5 and 8.
lower values than for the non-rotating case at f∗
r =1.3. Further, the cylinder vibration is fully suppressed for f∗
r > 2.2. In this region, the vibration frequency is split into two main components, with one matching fnw and the other matching fr. On the other hand, the vortex shedding frequency continues to lock on to fr for fr∗ up to ∼4, but exhibits low-frequency broadband noise for higher f∗
r values, which suggests that vortex shedding is suppressed. Consequently, decreasing trends are seen in both φt and φv from 180◦
to φt≈45◦ and φv≈60◦ at high fr∗ values, similar to those found in the desynchronisation region of the non-rotating case. On the other hand, for low fr∗ values, the vibration response behaves similarly to the previous cases of α∗
r =0.5 and 1.0, where the A∗
10 response tends to increase with f ∗
r prior to the onset of RLO. From the above results, it is evident that (varying) rotary oscillation can result in similar RLO and TLO regions at the reduced velocities associated with the upper and lower branches of the non-rotating case. However, it is also clear, but not surprising, that the cylinder vibration response depends on not only the forcing rotary motion parameters but also the initial VIV response branch in the absence of rotary oscillation.
456 K. W. L. Wong, J. Zhao, D. Lo Jacono, M. C. Thompson and J. Sheridan this subsection further investigates the cylinder vibration response with fixed forcing parameters (f∗
r, α ∗
r) = (1.0, 1.0) over a wide reduced velocity range of 3 6 U ∗
6 20. Figure 17 presents the vibration response as a function of U∗
of a cylinder undergoing forced rotary oscillation with (f∗
r, α ∗
r) = (1.0, 1.0). Strikingly, the given forced rotary oscillation results in a distinctly different vibration response with substantially larger amplitudes compared with the non-rotating case, as shown in figure 17(a). As revealed by the frequency responses in figure 17(b,c), the cylinder vibrates with a frequency clearly locking onto the forcing rotary frequency (f∗
y =f ∗ r =1) through the entire U∗
range tested; on the other hand, however, the vortex force frequency response indicates that there exist three regimes: regime I for U∗ < 6.6, regime II for 6.6 < U∗< 11.4 and regime III for higher U∗ values.
Regime I, which covers the U∗
range corresponding to that covering the initial and upper branches of the non-rotating case, is characterised by the vortex force frequency exhibiting its dominant component at f∗
Cv=3 and also two harmonics at f ∗
Cv =1 and
2. With the dominant frequency of the vortex shedding three times that of the body vibration, the cylinder appears to be subject to galloping response in this regime, where the oscillation amplitude is enhanced substantially over the non-rotating case and increases rapidly with U∗
. Interestingly, a noticeable jump in the A∗
10 response is observed at U∗=
5.0, which is similar to the jump from the initial to the upper branch of the non-rotating case. While both CRMS
y and C RMS
v appear to be fluctuating, the phases φt and φv remain consistently stable at 0◦ and 180◦ respectively.
In regime II, the dominant frequency of the vortex shedding switches to the harmonic at 2fnw, while still showing considerable 3fnw content. As a result of the interaction between these harmonics, the vibration amplitude growth tends to become slower with increasing U∗
, leading to a plateau of A∗
10≈1.75 over the range 8. U∗
. 11.4. Nevertheless, the vibration amplitude is enhanced to approximately three times that in the lower branch of the non-rotating case, which occurs over a similar U∗
range.
Further, in regime III, the vortex shedding exhibits a single frequency at 3fnw. This is clearly indicative of a galloping response. Correspondingly, the vibration amplitude resumes increasing rapidly with U∗
. On the other hand, both CRMS y and C
RMS
v are found to decrease to their minimum values (CRMS
y ≈0.29 and C RMS
v ≈0.19) as A∗10 increases to reach its peak of '3 at the highest U∗
value tested. The total phase is found to remain close to 0◦
, in favour of the galloping response. Interestingly, these results show that the dynamical state in the desynchronisation region of a non-rotating cylinder can be significantly changed by rotary oscillations.
In summary, it has been shown that forced rotation with (f∗ r, α
∗
r) = (1, 1) can in general cause the cylinder to gallop with substantially larger oscillation amplitudes than those of the non-rotating case undergoing VIV. This is in spite of a plateau region occurring due to strong interaction between the harmonics of the vortex shedding frequency over the range 8. U∗
. 11.4. The present galloping response appears to be quite similar to that of a constantly rotating cylinder undergoing in-line FIV in Zhao et al. (2018), where, while the geometric centreline symmetry is kept, the rotary motion breaks the instantaneous flow symmetry to give rise to an asymmetric excitation force that is phase with, and thus enhances, the body vibration. As noted in Zhao et al. (2018), this type of galloping is termed as rotation-induced galloping. This is different from conventional transverse galloping, which is seen typically with cylindrical bluff bodies of aerodynamically unstable geometries (e.g. square sections in Nemes et al. (2012) and Zhao et al. (2014b)) and wake-induced galloping, which is caused by unsteady oncoming flow (e.g. two interfering circular cylinders in Bokaian & Geoola (1984)).
458 K. W. L. Wong, J. Zhao, D. Lo Jacono, M. C. Thompson and J. Sheridan vortices consisting of a strong counterclockwise (CCW) vortex (in red) and a much weaker clockwise (CW) one (in blue) is shed in the first half-cycle in (ai), and a second Po pair is shed in the second half-cycle in (aii); however, the weak vortices shed close to the wake centreline dissipate rapidly downstream by x/D ≈ 2 while the vortices shed from the outer side remain very strong, travelling downstream at a slight angle to the wake centreline. For most of the spot PIV locations at higher α∗
r and f ∗ r values outside the TLO region, the vortex shedding exhibits a well-defined 2S mode. As can be seen from the phase-averaged vorticity contours at (f∗
r, α ∗
r) = (1.0, 2.0) in figure 18(b), while large vibration amplitudes are still encountered, two single opposite-signed vortices of equal strength are alternatively shed, forming two parallel rows in the wake. On the other hand, at the highest spot location (f∗
r, α ∗
r) = (3.0, 2.0), where the cylinder vibration is suppressed, the vortex shedding still exhibits a 2S mode, but with vortices shed into two narrowly spaced rows due to the vibration suppression. This pattern appears to be very similar to the mode I in the case of a rigidly mounted cylinder with different (f∗
r, α ∗
r) values documented by Choi et al. (2002). However, at a lower location (f∗
r, α ∗
r) = (3.0, 1.5) in a transition region to the suppression of cylinder vibration above the TLO region, the vortex shedding is observed to be in a CS mode (not shown here) comprising a coalescence (C) of small (S) vortices being shed simultaneously from both sides of the cylinder (see Williamson & Roshko 1988).
Of further interest is a new wake mode observed in the TLO region. To demonstrate the downstream evolution of this wake mode, figure 19 shows the normalised vorticity contours selected from eight representative phases (out of 48 phases in total). As the cylinder is moving upwards from its neutral position (figure 19ai,aii), two CCW vortices (labelled I and II) are being shed off from the bottom shear layer, and meanwhile a CW vortex (labelled III) is being formed. When the cylinder reaches its highest position (figure 19aiii), the CW vortex III is shed. Interestingly, the two CCW vortices interact with each other to merge further downstream at x/D ≈ 2. Similarly, when the cylinder moves backwards to its neutral position, another CW vortex (labelled IV) is formed (figure 19bi), and then is shed to merge with the previous CW vortex as the cylinder moves further towards its lowest position. Clearly, four vortices are shed per vibration cycle, and thus this wake mode is named 4S. In this case, the two like-signed vortices are not of similar strength and merge quickly downstream; however, at higher U∗
discussed subsequently, the two like-signed vortices are of similar strength and maintain a separate existence as they advect downstream. Such a wake mode with two same-signed vortices shed per half-cycle does not seem to have been previously observed in VIV of a non-rotating cylinder; however, it is not surprising here since the combined effect of the rotary oscillation and the cylinder vibration can rapidly alter the vorticity flux into the separating shear layers, resulting in two vortices being shed from the same shear layer in each half vibration cycle. Thus, having been shed at different cylinder transverse and angular positions, the twin-like vortices travel with different speeds, leading to merging downstream.
Furthermore, in the case of U∗=
8.0, while some of the wake modes observed in the case of 5.5 are present in the f∗
r−α ∗
r map in figure 4(b), an interesting new mode is also identified in the TLO region. As can be seen, in the non-lock-on region below the RLO region, the vortex shedding exhibits a 2P mode (not shown here) (see Govardhan & Williamson 2000; Morse & Williamson 2009; Zhao et al. 2014a, for details about this wake mode), despite the cylinder vibration being modulated by rotary oscillation. The 2P mode continues to exist in part of the RLO region encountered with large body vibration for α∗
0 2 4 6 0 2 4 6 0 2 –2 0 2 –2 0 2 –2 0 2 –2 0 2 –2 0 2 –2 0 2 –2 0 2 –2 I I I II II II III III III III III IV IV (ai) (bi) (aii) (bii) (aiii) (biii) (aiv) (biv)
FIGURE 19. (Colour online) Phase-averaged vorticity contours showing the evolution of
the 4S wake mode at (f∗ r, α
∗
r) = (3.0, 1.0) in the TLO region of the U ∗
=5.5 case. See supplementary movie 4 for the full oscillation cycle. For more details, refer to the caption of figure 18.
ratios (i.e. (f∗ r, α
∗
r) = (1.0, 1.5) and (1.0, 2.0)), the wake mode is observed to be the 4S mode. Figure 20 shows the evolution of the phase-averaged wake structure over one cycle. Similarly to the case seen in the TLO region at U∗=
5.5, two same-signed vortices are shed every half-cycle; however, twin-like vortices appear to have similar offsets to the wake centreline and also similar travelling speeds, and thus they merge much further downstream. Moreover, similarly to that found for U∗ =
5.5, the 2S mode is persistently observed over a wide region across the RLO region encountered with low-amplitude vibration response and the non-lock-on region at higher f∗
0 2 4 6 0 2 4 6 0 2 –2 0 2 –2 0 2 –2 0 2 –2 0 2 –2 0 2 –2 0 2 –2 0 2 –2 I I I I I I I II II II II II II II II III III III III III III IV III IV IV IV (ai) (bi) (aii) (bii) (aiii) (biii) (aiv) (biv)
FIGURE 20. (Colour online) Phase-averaged vorticity contours showing the evolution of
the 4S wake mode at (f∗ r, α
∗
r) = (1.0, 1.5) in the RLO region of the U ∗
=8.0 case. See supplementary movie 5 for the full oscillation cycle. For more details, refer to the caption of figure 18.
In the TLO region, a new wake mode named 2(Po+S) is observed, which consists of a Po pair of vortices and a single one shed per half-cycle. Figure 21 illustrates the evolution of this wake mode at (f∗
r, α ∗
r) = (3.0, 1.0). From figure 21(ai,aii), it is clear that a Po pair of vortices is being shed as the cylinder moves upwards, and meanwhile a single CW vortex is being formed. When the cylinder reaches its highest position, the CW vortex is cut off by the shear layer rolling up from the bottom of the body, forming a Po +S pattern, as shown in figure 21(aiii). This shedding configuration is symmetric as the cylinder moves towards its lowest position to shed
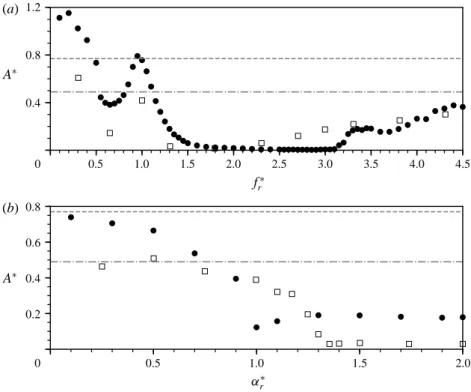
0 0.5 1.0 1.5 2.0 2.5 3.0 3.5 4.0 4.5 0 0.5 1.0 1.5 2.0 1.2 0.4 0.8 0.2 0.4 0.6 0.8 (a) (b)
FIGURE 22. The amplitude response of the present experiments with m∗
= 5.73 at U∗
=5.5 (u) compared with the numerical simulations with m∗
=10 at U∗
=5.0 by Du & Sun (2015) (@). (a) The amplitude response as a function of f∗
r with a fixed forcing velocity ratio α∗
r =2.0. (b) The amplitude response as a function of α ∗
r with a fixed forcing frequency ratio f∗
r =1.3. The dashed lines represent the amplitude response of the non-rotating case of the present study while the dash-dotted lines represent that of Du & Sun (2015).
impact on the wake structure when the cylinder is elastically mounted and immersed in a flow at moderate Reynolds number.
3.4. A comparison with numerical simulations
Figure 22 presents a comparison of the vibration amplitude response as a function of f∗ r (with fixed α ∗ r =2.0) and α ∗ r (with fixed f ∗
r =1.3) in (a) and (b) respectively between the present experiments at U∗=
5.5 (Re = 2060) and previous low-Reynolds-number numerical simulations at U∗=
5.0 (Re = 350) by Du & Sun (2015).
As can be seen in figure 22(a), in general, both the experimental and the numerical studies exhibit similar trends in the amplitude response as a function of the forcing rotary frequency. At low f∗
r values (f ∗
r < 0.5), the vibration amplitude responses in both studies appear to be considerably larger than their non-rotating cases. Similarly, they decrease to a local minimum at f∗
r '0.7 and then rise to reach a local peak at f∗
r '1.0, prior to a sharp decreasing trend leading to suppression of VIV. At high f ∗ r values (f∗
r > 2.3 in Du & Sun (2015) and f ∗
r > 3.2 in the present study), both studies see an increasing trend in the amplitude response to a similar magnitude (A∗≈
0.3 at f∗
r =4.5). Furthermore, as shown in figure 22(b), similar trends can also be seen in the amplitude response as a function of the forcing rotary velocity ratio in the two
studies. As α∗
r is increased in both studies, the amplitude response tends to decrease gradually from the magnitude of the non-rotating case to relatively constant minimum values. These values are A∗≈
0.2 for α∗
r& 1.0 for the present study and A ∗≈
0.02 for α∗
r & 1.3 in the study of Du & Sun (2015).
In summary, despite differences existing in the magnitude of the amplitude response and suppression region of VIV, which are most likely due to the effects of U∗
, Re and m∗ (m∗
=5.73 in the present study and m∗
=10 in Du & Sun (2015)), both studies show similar effects of the forcing parameters f∗
r and α ∗
r individually on the cylinder vibration amplitude response.
4. Conclusions
The present work has investigated experimentally the transverse flow-induced vibration of an elastically mounted circular cylinder undergoing sinusoidally driven rotary oscillations in a moderate-Reynolds-number free-stream flow. Characteristics of the fluid–structure system, including the vibration amplitude and frequency responses, the fluid forces and phases, and the wake structures, were studied through an extensive experimental programme covering a wide parameter space spanning the forcing rotary oscillation frequency ratio range 06 f∗
r 6 4.5 and the forcing rotary velocity ratio range 06 α∗
r 6 2.0 at two reduced velocities U ∗ =
5.5 and 8.0. These reduced velocities were selected to provide representative states from the VIV upper and lower branches of the non-rotating case respectively. Additionally, the structural vibration response was also examined with the fixed forcing rotary oscillation parameters (f∗
r, α ∗
r) = (1, 1) over a wide range of the reduced velocity 36 U∗
6 20.
The results showed that there exist similar RLO and TLO regions in the f∗ r–α
∗ r parameter space at the two representative reduced velocities. Similarly to conventional lock-on which is referred to as the vortex shedding frequency locking onto the forcing frequency, the cylinder vibration frequency in the RLO region is found to lock onto the forcing frequency. For both the U∗
cases, RLO is observed to occur in the vicinity of f∗
r =1 (or fr=fnw), and the RLO region widens as the forcing velocity ratio αr∗ is increased. On the other hand, the TLO phenomenon is observed to occur in the vicinity of f∗
r =3 (or fr =3fnw) for αr∗ up to ∼1.6, where the cylinder vibration frequency locks onto the one-third subharmonic of the forcing frequency (i.e. fy∼= fr/3). Although the locking of vortex shedding frequency to the one-third subharmonic frequency of the forcing frequency (fsh∼=fr/3) has been reported in previous studies of a rigidly mounted cylinder, TLO seems to have been first observed for the case of an elastically mounted cylinder in the present study.
Moreover, the results showed that the forcing rotary oscillation has profound effects on the cylinder vibration response in the two U∗
cases. In general, in the non-lock-on reginon-lock-on below the RLO lower boundary, the amplitude respnon-lock-onse is observed to be considerably larger than that of the non-rotating case. As f∗
r is further increased, the amplitude response experiences a noticeable drop at the onset of RLO and then increases rapidly to reach a local peak at f∗
r '1.0, prior to a sharp decreasing trend over the rest of the RLO region. The peak amplitude response in the RLO region is observed to be A∗
10 '1.2 (an increase of ∼50 % over the non-rotating case) in the case of U∗=
5.5, and A∗
10'2.2 (an increase of ∼270 % over the non-rotating case) in the case U∗ =
8.0. Interestingly, the local A∗
10 peak occurring at f ∗
r '1.0 in the RLO region tends to decrease with increasing α∗
r in the case U ∗ =
5.5, while it is observed to increase with α∗
r in the case of U ∗ = 8.0. However, for f∗ r & 1.3 in the RLO region at U∗= 8.0, the A∗
464 K. W. L. Wong, J. Zhao, D. Lo Jacono, M. C. Thompson and J. Sheridan non-rotating case, and it can even be suppressed for α∗
r & 1.3. On the other hand, the cylinder vibration can also be significantly enhanced, attenuated and suppressed in the TLO region. The A∗
10 peak in the TLO region is observed to be 0.82 in the case of U∗=
5.5, and 2.2 in the case of U∗=
8.0. This suggests that the rotary oscillation has a stronger effect in the TLO region deriving from the VIV lower branch. Although the TLO region is observed to be suppressed for 1.6 . α∗
r 6 2.0 in both U ∗
cases, a secondary TLO region with low vibration amplitudes is observed to occur around α∗
r =3.1 at U ∗=5.5.
In addition, the study examining the cylinder vibration response as a function of U∗ for the fixed rotary oscillation parameters of (f∗
r, α ∗
r) = (1.0, 1.0) shows that the cylinder experiences substantially larger oscillations than those for the non-rotating case, and a rotation-reduced galloping response is observed for U∗ > 12, where the amplitude response increases monotonically to reach A∗
10 ≈ 3 at the highest reduced velocity (U∗ =
20) tested. This clearly demonstrates a limitation of using sinusoidal rotary oscillations naively as a method for suppression of VIV, as specific combinations of the rotary oscillation parameters and flow conditions are required for suppression. Similarly, the use of sinusoidal rotary oscillations for energy harvesting applications will also require the cylinder to oscillate with large amplitudes for efficient power production dictated by specific parameter combinations.
Furthermore, the wake structure was examined via spot PIV measurements sampling the f∗
r−α ∗
r parameter space. For U ∗=
5.5, it was shown that the switching behaviour between 2S and 2Po modes observed in the upper branch for the non-rotating case was still present in the non-lock-on region below the RLO region; however, when large cylinder vibration was encountered in the RLO region, the vortex shedding exhibited a 2Po mode forαr∗6 1.0 and a 2S mode for α
∗
r> 1.5. In the TLO region, an interesting new 4S mode comprising two same-signed vortices shed per half-cycle was observed. On the other hand, for U∗=
8.0, the 2P mode was found to be present in the non-lock-on region at low f∗
r values, but when large cylinder vibration was encountered in the RLO region (i.e at f∗
r =1.0), the wake exhibited a 2P mode for α ∗ r 6 1.0 and a 4S mode for α∗
r > 1.5. Similarly to the case of U ∗ =
5.5, 2S was observed when the cylinder vibration was suppressed at higher f∗
r and α ∗
r values. In addition, an interesting new wake mode, a 2(Po+S) mode, was identified in the TLO region.
From the results presented and a previous numerical study, it is evident that the effect of sinusoidal rotary oscillation on the FIV of elastically mounted cylinders is robust and appears not to be very sensitive to the Reynolds number. However, further research is still required to thoroughly understand the varying fluid–structure mechanisms under extended ranges of flow and the rotary oscillation conditions. Some interesting questions have arisen from the present investigation. One question, in particular, is whether lock-on and body vibration can be observed when the cylinder is oscillating at a higher odd ratio of f∗
r, such as f ∗
r =5. If TLO can occur due to the body oscillation frequency locking onto the one-third subharmonic of the rotary forcing frequency and lead to substantial oscillation amplitudes, can the same also occur when the body locks to the one-fifth subharmonic of the rotary forcing frequency? Further investigation of the galloping behaviour at higher U∗
values is also warranted.
Acknowledgements
The financial support from Australian Research Council Discovery Project Grants DP110102141, DP150102879 and DP170100275 is gratefully acknowledged. The
authors would also like to acknowledge the financial support of the Centre National de la Recherche Scientifique (CNRS) through Grant no. PICS161793 under the Projet International de Coopération Scientifique. K.W. acknowledges the financial support from a Commonwealth sponsored Australian Postgraduate Award (APA) for his PhD study.
Supplementary movies
Supplementary movies are available at https://doi.org/10.1017/jfm.2018.379.
REFERENCES
BAEK, S.-J. & SUNG, H. J. 1998 Numerical simulation of the flow behind a rotary oscillating circular cylinder. Phys. Fluids 10 (4), 869–876.
BEARMAN, P. W. 1984 Vortex shedding from oscillating bluff bodies. Annu. Rev. Fluid Mech. 16 (1), 195–222.
BISHOP, R. E. D. & HASSAN, A. Y. 1964 The lift and drag forces on a circular cylinder in a flowing fluid. Proc. R. Soc. Lond. A 277 (1368), 32–50.
BLEVINS, R. D. 1990 Flow-Induced Vibration, 2nd edn. Krieger Publishing Company.
BOKAIAN, A. & GEOOLA, F. 1984 Wake-induced galloping of two interfering circular cylinders. J. Fluid Mech. 146, 383–415.
BROOKS, P. N. H. 1960 Experimental investigation of the aeroelastic instability of bluff two-dimensional cylinders. Masters, University of British Columbia.
CARBERRY, J., SHERIDAN, J. & ROCKWELL, D. 2001 Forces and wake modes of an oscillating cylinder. J. Fluids Struct. 15 (1), 523–532.
CHENG, M. 2001 Numerical investigation of a rotationally oscillating cylinder in mean flow. J. Fluids Struct. 15, 981–1007.
CHENG, M., LIU, G. & LAM, K. 2001 Numerical simulation of flow past a rotationally oscillating cylinder. Comput. Fluids 30 (3), 365–392.
CHOI, S., CHOI, H. & KANG, S. 2002 Characteristics of flow over a rotationally oscillating cylinder at low Reynolds number. Phys. Fluids 14 (8), 2767–2777.
CHOU, M.-H. 1997 Synchronization of vortex shedding from a cylinder under rotary oscillation. Comput. Fluids 26 (8), 755–774.
DU, L. & SUN, X. 2015 Suppression of vortex-induced vibration using the rotary oscillation of a cylinder. Phys. Fluids 27 (2), 023603.
FENG, C. C. 1968 The measurement of vortex induced effects in flow past stationary and oscillating circular and D-section cylinders. Masters, The University of British Columbia.
FOURAS, A., LO JACONO, D. & HOURIGAN, K. 2008 Target-free stereo PIV: a novel technique with inherent error estimation and improved accuracy. Exp. Fluids 44 (2), 317–329. GABBAI, R. D. & BENAROYA, H. 2005 An overview of modeling and experiments of vortex-induced
vibration of circular cylinders. J. Sound Vib. 282 (3), 575–616.
GOVARDHAN, R. & WILLIAMSON, C. H. K. 2000 Modes of vortex formation and frequency response of a freely vibrating cylinder. J. Fluid Mech. 420, 85–130.
GOVARDHAN, R. & WILLIAMSON, C. H. K. 2006 Defining the ‘modified Griffin plot’ in vortex-induced vibration: revealing the effect of Reynolds number using controlled damping. J. Fluid Mech. 561, 147–180.
GRIFFIN, O. M., SKOP, R. A. & KOOPMANN, G. H. 1973 The vortex-excited resonant vibrations of circular cylinders. J. Sound Vib. 31 (2), 235–249.
KHALAK, A. & WILLIAMSON, C. H. K. 1997 Fluid forces and dynamics of a hydroelastic structure with very low mass and damping. J. Fluids Struct. 11, 973–982.
KHALAK, A. & WILLIAMSON, C. H. K. 1999 Motions, forces and mode transitions in vortex-induced vibrations at low mass-damping. J. Fluids Struct. 13, 813–851.
MORSE, T. L. & WILLIAMSON, C. H. K. 2009 Prediction of vortex-induced vibration response by employing controlled motion. J. Fluid Mech. 634, 5–39.