UNIVERSITÉ DE MONTRÉAL
Development of a Blood Antigen Molecular Profiling Panel using
Genotyping Technologies for Patients Requiring Frequent
Transfusions
By Ian Mongrain
Department of Pharmacology Faculty of Medicine
Master Thesis presented at the Faculty of Graduate Studies In preparation for Masters ès Science (M.Sc) level
In Pharmacogenomics
17 Juillet 2009
UNIVERSITÉ DE MONTRÉAL Graduate Study Faculty
Master Thesis is entitled:
Development of a Blood Antigen Molecular Profiling Panel using
Genotyping Technologies for Patients Requiring Frequent
Transfusions
By Ian Mongrain
Pharmacology Department Faculty of Medicine
Will be evaluated by the following Jury members: Martin Sirois, PhD, Président Rapporteur Michael Phillips, PhD, Directeur Scientifique Simon DeDenus, B.Phar, PhD, Membre du Jury
RÉSUMÉ
Contexte. Les phénotypes ABO et Rh(D) des donneurs de sang ainsi que des patients transfusés sont analysés de façon routinière pour assurer une complète compatibilité. Ces analyses sont accomplies par agglutination suite à une réaction anticorps-antigènes. Cependant, pour des questions de coûts et de temps d’analyses faramineux, les dons de sang ne sont pas testés sur une base routinière pour les antigènes mineurs du sang. Cette lacune peut résulter à une allo-immunisation des patients receveurs contre un ou plusieurs antigènes mineurs et ainsi amener des sévères complications pour de futures transfusions. Plan d’étude et Méthodes. Pour ainsi aborder le problème, nous avons produit un panel génétique basé sur la technologie « GenomeLab _SNPstream» de Beckman Coulter, dans l’optique d’analyser simultanément 22 antigènes mineurs du sang. La source d’ADN provient des globules blancs des patients préalablement isolés sur papiers FTA. Résultats. Les résultats démontrent que le taux de discordance des génotypes, mesuré par la corrélation des résultats de génotypage venant des deux directions de l’ADN, ainsi que le taux d’échec de génotypage sont très bas (0,1%). Également, la corrélation entre les résultats de phénotypes prédit par génotypage et les phénotypes réels obtenus par sérologie des globules rouges et plaquettes sanguines, varient entre 97% et 100%. Les erreurs expérimentales ou encore de traitement des bases de données ainsi que de rares polymorphismes influençant la conformation des antigènes, pourraient expliquer les différences de résultats. Cependant, compte tenu du fait que les résultats de phénotypages obtenus par génotypes seront toujours co-vérifiés avant toute transfusion sanguine par les technologies standards approuvés par les instances gouvernementales, les taux de corrélation obtenus sont de loin supérieurs aux critères de succès attendus pour le projet. Conclusion. Le profilage génétique des antigènes mineurs du sang permettra de créer une banque informatique centralisée des phénotypes des donneurs, permettant ainsi aux banques de sang de rapidement retrouver les profiles compatibles entre les donneurs et les receveurs.
ABSTRACT
Background. ABO and Rh(D) phenotyping of both blood donors and transfused patients is routinely performed by blood banks to ensure compatibility. These analyses are done by antibody-based agglutination assays. However, blood is not routinely tested for minor blood group antigens on a regular basis because of cost and time constraints. This can result in alloimmunization of the patient against one or more minor antigens and may complicate future transfusions. Study design and Methods. To address this problem, we have generated an assay on the GenomeLab SNPstream genotyping system (Beckman Coulter, Fullerton, CA) to simultaneously test polymorphisms linked to 22 different blood antigens using donor’s DNA isolated from minute amounts of white blood cells. Results. The results showed that both the error rate of the assay, as measured by the strand concordance rate, and the no-call rate were very low (0.1%). The concordance rate with the actual red blood cell and platelet serology data varied from 97 to 100%. Experimental or database errors as well as rare polymorphisms contributing to antigen conformation could explain the observed differences. However, these rates are well above requirements since phenotyping and cross-matching will always be performed prior to transfusion. Conclusion. Molecular profiling of blood donors for minor red blood cell and platelet antigens will give blood banks instant access to many different compatible donors through the set-up of a centralized data storage system.
TABLE OF CONTENT
RÉSUMÉ ... iii ABSTRACT ... iv TABLE LIST ... ix ABBREVIATION LIST ... x AKNOWLEDGEMENT ... xi INTRODUCTION ... 1 1. General Introduction ... 12. Genomic variations: An overview ... 2
2.1. Single Nucleotide Polymorphism ... 2
2.2. Satellites, Microsatellites, Minisatellites and CNVs ... 3
2.3. Genetic variation and human diseases ... 4
2.4. The Promises of Pharmacogenomics ... 6
2.4.1. Gene selection: Direct and Indirect approaches ... 8
2.4.2. Selection of markers: Candidate genes and HapMap resources ... 9
2.4.3. Towards clinical translation ... 11
3. Genotyping and cutting edge technologies ... 13
3.1. Medium-High-Throughput technologies ... 14
4. Blood antigens: Red blood cells and platelet antigens ... 16
4.1. Goodbye hemagglutination, welcome DNA based assays ... 17
5. Scientific interest and global objectives ... 19
MATERIALS AND METHODS ... 22
1. Gene and marker selection ... 22
2. DNA sources ... 22
3. DNA extraction from FTA cards ... 23
3.1. Long PCR amplification on DNAs extracted from FTA cards ... 24
4. Genotyping ... 25
4.1. Primer Design ... 25
4.2. Multiplex PCR amplification ... 26
4.4. Detailed Genotyping procedure using the Beckman Coulter SNPstream
technology ... 33
4.5. Detailed Genotyping procedure using Sequenom MassArray system ... 35
4.6. Sequencing ... 37
5. Clinical blood antigen genotyping assay procedure ... 39
5.1. Blood sample collection at Héma-Québec ... 39
5.2. Sample management ... 39
5.3. DNA plate management and DNA extraction ... 42
5.4. PCR oligos and extension oligo mixes batches preparation ... 42
5.5. Multiplex PCR master mix batch preparation ... 42
5.6. Genotyping process ... 43
5.7. Data acquisition ... 43
5.8. Data Analysis and reporting ... 43
RESULTS ... 45
1. Assay development and optimisation ... 45
1.1. Bioinformatics analysis of the genes and markers of interest ... 45
1.2. SNPstream and Sequenom minor blood group antigen genotyping panel assay design 1.3. SNPstream minor blood group antigen genotyping assay optimisation ... 66
1.3.1. Phase I assay optimisation ... 66
1.3.2. Phase II assay optimisation ... 69
2. SNPSTREAM MINOR BLOOD GROUP ANTIGEN GENOTYPING ASSAY VALIDATION ... 85
2.1. Accuracy evaluation ... 85
2.2. Robustness evaluation ... 92
3. CLINICAL APPLICATION: PROOF OF CONCEPT STUDY ... 94
3.1. Clinical genotyping process and key results ... 94
3.2. Clinical results: accuracy and robustness ... 99
DISCUSSION ... 117
BIBLIOGRAPHY ... 134
FIGURE LIST
1- Pharmacogenetics Vs. Pharmacogenomics2- Candidate gene Vs. whole genome scanning approaches 3- Concept of the haplotype structure
4- Example of a gene candidate approach strategy 5- Haplotype block structure of the gene TPMT 6- Pharmacogenomics and clinical implementation
7- Personalized medicine guidance: From bench to bedside. 8A- Description of single-base extension genotyping
8B- Description of allele specific extension genotyping
9- Detailed genotyping flow using Beckman Coulter SNPstream platform 10- Detailed genotyping flow using Sequenom MassArray system
11- Process flow overview of the clinical blood antigen genotyping assay 12- Clinical FTA blood sample management flow
13- Data analysis and reporting flow 14- Bioinformatics analysis of the gene Kel
15- Bioinformatics analysis of the genes GYPA, GYPB and RHCE
16- Standard manual PCR and Extension oligo designs for SNPstream and Sequenom platforms
17- SNPstream specific non-standard PCR and extension oligo design for the antigen e/E
18- Non-standard PCR and extension oligo designs for the antigens c/C 19- Extraction of DNAs from FTA cards
20- Phase I genotyping results optimisation 21- Phase II genotyping results optimisation
22- Genotyping Vs. Sequencing results of the antigen M/N 23- Genotyping Vs. agarose gel results of the marker c/C-intron 24- Clinical process flow summary and Qc check points
25- Sample reception and LIMS management 26- LIMS mediated DNA extraction protocol 27- LIMS mediated genotyping protocol
28- Genotyping quality control assessment using the in-house SHERPA software 29- Results reporting using the in-house Area51 software
TABLE LIST
1- Genes, markers and antigens details2- SNPstream PCR oligos mix details
3- Sequenom PCR oligos mix details
4- SNPstream GA and TC Extension oligos version details
5- Sequenom Forward-Reverse Extension oligos details
6- PCR and sequencing oligos used to sequence the whole genotyping blood antigen panel contents.
7- Qualitative representation of the DNA sequences complexity at the gene and marker levels
8- Summary results after the phase 1 genotyping optimisation
9- Summary results of the accuracy validation phase
10- Inferred phenotypes from the genotyping results and correlation with the serological phenotypes
11- Summary results of the assay robustness validation phase
12- Conversion table of the genotyping results to phenotype
13- Inferred phenotypes accuracy and reproducibility results obtained during the clinical genotyping of blood donors
ABBREVIATION LIST
ADR: Adverse drug reactionAIDS: Acquired Immune Deficiency Syndrome ASE: Allele specific extension
ASO: Allele specific oligonucleotide CNV: Copy Number Variation DNA: deoxyribonucleic acid
FDA: Food and Drug Administration GBAP: genotyping blood antigen panel GLP: Good laboratory practice
HDN: Haemolytic disease of the fetus and newborn HQ: Héma-Québec
MAF: Minor allele frequency PCR: Polymerase chain reaction PGX: Pharmacogenomics RBC: Red blood cell
RFLP: Restriction fragment length polymorphism SBE: Single base extension
SNP: Single nucleotide polymorphism SOP: Standard Operating procedure
SSCP: Single-stranded conformation polymorphism TOF: Time of flight
UCSC: University of California of San-Francisco UTR: Untranslated regions
CAP : College of American Pathologist
AKNOWLEDGEMENT
Je veux remercier tout particulièrement l’équipe de recherche de Héma-Québec, en particulier Maryse St-Louis et Josée Perreault, qui ont travaillé étroitement avec moi pour la mise en place de ce projet de recherche et de son application clinique. Je veux les remercier d’avoir collaboré avec Génome Québec et de nous avoir fait confiance dans le développement de la première banque de sang génotypé clinique au Canada et d’avoir mis notre équipe de recherche en avant plan dans plusieurs présentations qu’ils ont effectuées. Ce fut un plaisir énorme de travailler avec vous. De plus, je ne peux m’empêcher de remercier grandement Alexandre Montpetit qui a initié ce projet à ses tout débuts et d’avoir contribué de façon majeure au développement et à la vulgarisation scientifique de ce projet. Un gros merci à Michal Blazejczyk, Marc Bouffard et Yannick Renaud qui ont contribué de façon généreuse à la mise en place du processus informatisé de ce projet, sans eux l’analyse des résultats aurait été très laborieuse. Également, je suis très reconnaissant à Lizette Mailloux et à Marie-Josée Gaulin qui ont toutes deux effectué un travail de génotypage clinique génial. Bravo! Aussi, je veux remercier Michael Phillips, mon directeur de recherche, de m’avoir fait confiance dans toutes les étapes de ce projet, autant pour le développement que de gestion au jour le jour du projet du début à sa toute fin. Je remercie grandement Andrea Smith, la gestionnaire principale du projet qui a mis de façon grandiose la table entre Génome Québec et Héma-Québec, ce qui a sans aucun doute facilité toutes les collaborations scientifiques et d’affaires présentes et futures. Finalement, je veux remercier Sharon Marsh qui a été une référence sans limites dans la mise en place de ce mémoire, pour ses conseils stratégiques importants et bien sûr, pour la correction détaillée de la langue anglaise.
INTRODUCTION
1. General Introduction
Personalized medicine, Pharmacogenomics, Molecular Profiling, and Targeted Therapeutics are all terms describing the same ideal: identifying individual variations affecting drug therapies and specialized therapies. It’s well established in the scientific community as well as in the regulatory instances that modern medicine should target and understand the individual’s genomic make-up in order to increase the effectiveness of therapies, as well as decrease the toxicities. Many good examples are now reflected in modern therapies, such as Herceptin© (Trastuzumab), Gleevec© (Imatinib) or Iressa© (Gefitinib). These anti-cancer therapeutic agents are currently prescribed with a molecular profiling assay and they represent the gold standard for the personalised medicine approach. To extend this success to other fields of medicine, many pharmacogenomics studies have to be performed using state-of-the-art genotyping technologies. Many of these technologies are now available to help in the research of SNPs (Single Nucleotide Polymorphisms) that affect or influence a patient’s therapeutic outcome. Some of these technologies provide the ability to perform whole genome scanning experiments (e.g. Illumina, Affymetrix) and some are more suitable for focusing on specific genomic regions (e.g. SNPstream, Sequenom). (McLeod et al., 2004).
Since pharmacogenomics is a fairly new field of research, most of the current studies are in the early stages of development. Even if some studies are more mature, most of them are still closely attached to the bench and more effort is required to transfer it into the clinic or at the bed-side. In the last two years, two projects from the Génome Québec and Montreal Heart Institute Pharmacogenomics Centre were successfully transferred from development into the clinical application. These projects entail the development of a molecular profiling panel for minor blood antigens that was one of our first projects that we transferred into a clinical process and the other project that is currently progressing towards a clinical application is the CVD (Cardiovascular
Disease) risk panel. Both projects are using cutting edge technologies available for such applications, and the more important thing is that the projects are developed and optimized for clinical grade usage. This work is already contributing to their use in modern therapy (minor blood antigen panel) as well as to contribute to future pharmacogenomics guidance.
2. Genomic variations: An overview
There is a real interest in documenting the amount of genetic variation in the human species. This information is required by the biomedical community, who require detailed maps of genetic variations (i.e. SNPs: Single Nucleotide Polymorphisms, insertions and deletions (indels), variable number of tandem repeats (VNTRs), Microsatellites, Minisatellites and CNV: Copy Number Variation) in order to identify genes and loci associated with diseases. The ultimate goal is to characterize these variations to identify disease-related polymorphisms among patients and populations. This information is also desired by anthropologists to reconstruct our “Human History” and understand the role of culture and geography in the global distribution of human variation and migration (Weiss, 1998). These genomic variations are also valuable for the investigation of molecular events that underline evolution, genetic drift, mutation, recombination and selection (Nachman, 2001).
2.1. Single Nucleotide Polymorphism
The Human Genome Project has identified that the most common form of variation in the human genome is the single nucleotide polymorphism (SNP). A SNP, by definition, is a stable substitution of a single base with a frequency of 1% in at least one population. Single nucleotide polymorphisms are distributed throughout the human genome at an estimated frequency of one every 1900 bp. Up to now, more than six million SNPs have been mapped and are accessible in public databases. At the chromosome level, SNP densities appear to be constant across the human genome
with the only exception being sex chromosomes (Sachidanandam et al., 2001). SNPs can occur in different places within the genome and this can result in multiple effects on gene function and expression. For example, SNPs can occur in the non-coding 5’UTR, non-coding 3’UTR, intergenic regions, introns and exons. SNPs that occur in exonic regions may be nonsynonymous, coding for an amino acid change (eg. GluAsp) as well as synonymous, coding for no amino change (eg. GluGlu).
2.2. Satellites, Microsatellites, Minisatellites and CNVs
In 1993, Daniel Tautz was the first researcher to distinguish between satellites, microsatellites and minisatellites. He concluded that satellites are composed of repeats of several thousand base pairs with frequencies of 103 to 107 at each genomic locus and they are located in heterochromatin, mainly in the centromeres. Minisatellites and microsatellites are more broadly dispersed throughout the genome and they have a moderate degree of repetition; microsatellites typically made up of <10 base pair repeats whereas the minisatellites usually contain between 10 to 100 base pairs (Debrauwere et al., 1997). Since the mini and microsatellites are highly polymorphic, these genomic variations have been used to support genomic fine mapping as well as to support the forensic investigations. More recently it has been discovered that the structural diversity of humans is much greater than previously expected. This new finding combined with affordable cutting-edge technologies, has led to the creation of a new research area, copy number variation (CNV) mapping (Goidts et al., 2006). CNVs define regions of copy number polymorphisms in the genome and are responsible for a significant amount of structural variation. One of the most examined CNVs is the segmental duplication, these are low-copy number repeats of DNA blocks ranging from a few kilobases to several hundred kilobases in length (Goidts et al., 2006).
2.3. Genetic variation and human diseases
Generally SNPs have been studied for their impact on defects in biological processes; consequently research has concentrated on SNPs that alter the function or the expression of the genes. From many studies of complex diseases it has been suggested that multiple variants confer the susceptibility, but it’s not clear yet whether rare (<1%) or common polymorphisms are determinants that are the most responsible. Based on SNP maps, it has been estimated that there could be between 50,000 and 250,000 functional SNPs (Risch, 2001). Over time, many less common single nucleotide variants have been discovered, these do not occur at a high enough frequency to be considered as a SNPs (at least 1% frequency), however, they nonetheless have been associated with biological defects and other clinical importance (Pritchard, 2001). It is well established that an amino acid substitution caused by a SNP may interfere with the protein function. Likewise, gene expression can also be affected by SNPs positioned in a critical regulatory site. The famous example of the CFTR (Cystic Fibrosis) gene illustrates perfectly the deleterious effect of a variation that changes an amino acid which results in altered gene function, so much so that more than 60 different exonic variants are routinely screened in the clinic as a phenotype screening test (Moskowitz et al., 2008).
It is also important to take note that SNPs located in promoter regions can adversely affect gene expression and infer deleterious phenotypes, such as SNPs located in the promoter region of the genes that coordinate the immune response, namely variations in TNFα, IL4, IL6 and IL10 have been associated with a range of autoimmune and infectious diseases (McGuire et al., 1994). Additionally, it has been demonstrated that the -439T>C SNP located in the promoter region of the Duffy antigen receptor gene encoding the chemokines FY can completely abolish expression when it is present, the same study also demonstrated that this polymorphism is mainly present within African populations and leads to a protective phenotype against the malaria parasite Plasmodium Vivax (Iwamoto et al., 1996).
Historically the intergenic and intronic regions have been less well examined and are infrequently associated with changes in phenotype. Recently however, intergenic and intronic SNPs have been of interest and are no longer associated with “Junk DNA” (Zuckerkandl, et al., 2007). To illustrate this, a recent study involving the CYP2D6 cytochrome enzyme has demonstrated that the single nucleotide polymorphism G>A located in the intron 6 at the position 2988 has a direct impact on the mRNA level and also on protein expression. Further mechanistic experiments have demonstrated that conversion from G to A destabilizes the splicing events and therefore reduces the amount of mature CYP2D6 containing exon 6 (Toscano et al., 2006). This recently described polymorphism is known as *41 and represents one of the main deleterious components of CYP2D6 gene and therefore affects greatly human body detoxification.
Variations in regulatory regions are typically associated with mRNA expression levels, and consequently the resulting protein levels. Polymorphisms found in the promoter regions can also be predictive for human diseases. The UGT1A1 gene illustrates the importance of such polymorphisms in a non-coding region. The variant UGT1A1*28 is well described in literature to affect the downstream regulation of the enzyme consequently leading to the impaired elimination of the bilirubin and subsequently causing Gilbert Syndrome (Roden et al., 2006).
Since 1993, microsatellites and minisatellites have been well characterized and are associated with human diseases that have dominant mode of inheritance. The diseases are classified into two groups, the first represents the size of repeats in the coding or regulatory genomic regions affecting gene expression and leading to aberrant or toxic proteins (Sutherland et al., 1995). The second group is associated with familial heredity defects and cancers. These types of variation are often located in very unstable repeat regions. Taken together more than a dozen well known and characterized diseases have been recorded. Huntingdon disease, muscular dystrophy and fragile X syndrome are some of the most examined pathologies related to minisatellites. Typically, the numbers of repeats are directly connected with the age of the disease onset (Fu et al., 1991). With new research in the CNV area, many
Figure 1: copied from Roden et al., 2006
different associations have been made regarding disease susceptibility. A great example of the utility of such mapping is the case of the HIV, where CNVs have been highly associated CCL3L1 gene duplications and the susceptibility to acquire AIDS (Gonzalez et al., 2005).
2.4. The Promises of Pharmacogenomics
Between 1909 and 1923, the physiologist Archibald Garrod, was the first person to propose that common genetic factors might underline the error of metabolism and the variability in drug response (Roden et al., 2006). Today, the outcome of drug therapy is often well understood, but still sometimes unpredictable, varying from beneficial effects to lack of efficacy to very serious adverse drug reactions. Recent statistics have demonstrated that more than 100,000 deaths annually in the US are attributable to adverse drug reactions. Up to 7% of all hospital admission in North America and Europe are related to ADRs (adverse drug reactions) (Manolopoulos, 2007).
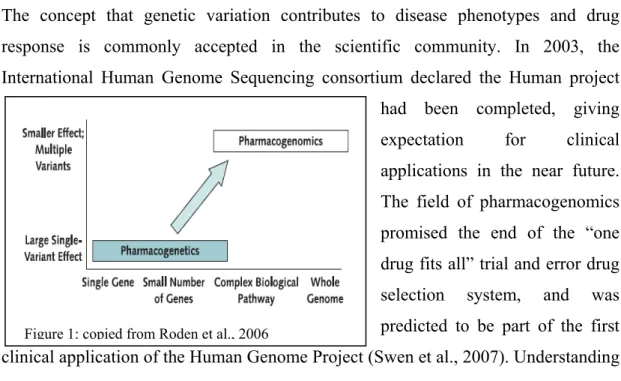
The concept that genetic variation contributes to disease phenotypes and drug response is commonly accepted in the scientific community. In 2003, the International Human Genome Sequencing consortium declared the Human project
had been completed, giving expectation for clinical applications in the near future. The field of pharmacogenomics promised the end of the “one drug fits all” trial and error drug selection system, and was predicted to be part of the first clinical application of the Human Genome Project (Swen et al., 2007). Understanding the genetic contribution to the variability in drug response provides a new tool in
drug development with the hope of decreasing the risk of toxicity and identifying the patients that will beneficially response to the medication (Roses, 2004). The terms of “Pharmacogenomics” and “Pharmacogenetics” are broadly used in different scientific discussions as well in many literatures and reviews. Both terms are intimately connected since they are referring to the exact same endpoint. Pharmacogenetics focuses on the large clinical effect of single gene variants in a small number of patients, whereas pharmacogenomics examines many genomic loci including large biological pathways such as lipid-lowering agents (Liao, 2002) and hypertension (Dedenus, 2004), as well as the whole genome (Iakoubova et al., 2008) to identify variants that together determine the variability in therapeutic outcomes (See figure 1). Even if pharmacogenomics and pharmacogenetics are quite recent research areas, the literature abounds with studies that involve different genes and different therapeutic fields. In the current clinical practice at least five known drugs are prescribed with pharmacogenetic tests (Sheffield et al. 2009). In early 1990, some studies demonstrated that women with breast cancer having HER2 over expression had very poor prognosis. In the same decade Genetech developed a monoclonal antibody directed drug against the HER2 protein conferring for those women real improvement in clinical outcomes. Pharmacogenomics gained in popularity when Herceptin© (Trastuzumab) was prescribed with a pharmacogenomics pre-screen test. Today, testing for HER2 over expression is a standard practice to detect candidates for Herceptin© (Trastuzumab) treatment among women suffering from breast cancer (Swen et al., 2007). Also, one of the most studied pharmacogenomics tests is for Warfarin. Since this drug is the most widely prescribed oral anticoagulant drug and there is greater than 10-fold interindividual variability in the dose required to attain the therapeutic response, the need of a pharmacogenomics clinical test to determine the optimum starting dose was urgent. The genes CYP2C9 and VKORC1 have been identified as the two major contributors for the interindividual response to warfarin. Today, many retrospective and prospective studied tend to demonstrate that the genomics markers *2 and *3 of CYP2C9 gene and -1639 G>A of VKORC1 gene, contribute at least at 40% of the interindividual variability in dose requirement (Van Schie et al., 2009). Other current examples of pharmacogenomics being applied in
Figure 2: Copied from: Taylor et al., 2001
the clinic include irinotecan, a colorectal anticancer agent, Abacavir, an antiviral and Tamoxifen a breast cancer treatment, are routinely prescreened for UGT1A1, HLA-B and CYP2D6 respectively (Roden et al., 2006 and Swen et al., 2007).
2.4.1. Gene selection: Direct and Indirect approaches
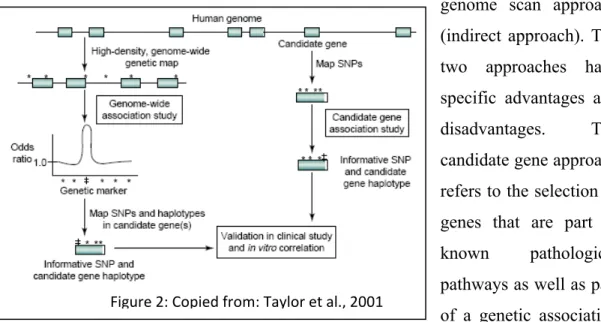
With these numerous successes, many other therapeutic areas are on the way to identifying key genomics-based elements correlated with either drug efficiency or toxicity. Among these therapeutic areas, the antihypertensive, lipid-lowering, anticancer and neurologic disorder drugs are the most advanced in the identification of potential pathways that underline genes and markers that could infer specific risk of drug toxicity or poor drug response. The current effort put in these different studies is identifying more and more complex pathways and polygenic problems. For instance, lipid lowering therapies implicates the very complex Mevalonate pathways and indirectly related pathways such as the isopranoids and glycosylation pathways as well as the intracellular signaling pathways (Hanai et al., 2007). This has led to the identification of more than 500 related and less related genes and more than 50,000 potential clinically relevant markers. To investigate this, two genotyping strategies can be employed; the candidate gene approach (direct approach) and the whole genome scan approach (indirect approach). The two approaches have specific advantages and disadvantages. The candidate gene approach refers to the selection of genes that are part of known pathological pathways as well as part of a genetic association hypothesis. This strategy can be extremely powerful for studying the genetic make-up
of complex traits and pin-point the rare variants. Nevertheless, the candidate approach is greatly limited as it relies on existing knowledge about the presumed biological pathways and biological concept, and unfortunately most of the biological attributes remain unknown (Zhu et al., 2007). In contrast, the whole genome scan approach proceeds without any presupposition regarding biological knowledge, which leads to an unbiased approach. The main advantage of this approach is a greater coverage of all pathways including unknown loci that possibly underline the drug toxicity or inefficiency. The biggest disadvantages of this technique are the high cost related to such experiments, which needs expensive technologies and reagents and the relative high number of individual needed to reach statistical endpoint value. Also, since the whole-genome scan approach relies mainly on Hapmap data, it can only identify pre-described loci, so a candidate approach will be necessary to further map and isolate the causative markers (The International HapMap consortium, 2003). Figure 2 illustrates the concept of candidate genes and whole genome scan approaches and the downstream processes involved in defining the clinical application (Taylor et al., 2001). Over the past few years the whole genome approach has held great interest for the pharmacogenomics studies. Since the clinical drug response is not only reflecting the intrinsic properties of target cells or pathways, but also metabolic properties, drug-drug interactions, pharmacokinetic, pharmacodynamic as well as the population and gender. Consequently the whole-genome scan approach enables the highest degree of possible associations to be identified. Also, with the completion of the Hapmap project in 2003, the availability of Hapmap data for different populations have permitted a better evaluation of population and gender effects on drug toxicity (Zhang et al., 2008).
2.4.2. Selection of markers: Candidate genes and HapMap
resources
Traditionally when a pharmacogenomics study design uses a candidate gene approach, most candidate markers are selected from both literature and public database (eg dbSNP and OMIM) search. For the candidate gene approach, the
Figure 3: Copied from HapMap project
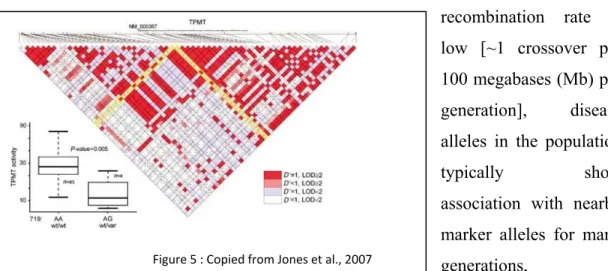
Figure 5 : Copied from Jones et al., 2007 Figure 4
markers are selected based on their known association with specific diseases as well as their pharmacogenetic clinical importance. Most of the time the list of markers is complemented with markers that have unknown function but could potentially modify the target protein (e.g. variants located in the exons, promoter and intronic splicing sites). The HapMap data resource has greatly improved SNP
selection. Briefly the HapMap resources have elucidated the common patterns of DNA sequence variation in the human genome, leading to well characterized SNPs, their frequencies in multiple populations, and the extent of linkage disequilibrium
between them. Linkage
disequilibrium is explained by the fact that
each disease-causing mutation arises on a particular copy ofthe human genome and bears a specific set of common alleles in cis at nearby loci, termed a haplotype (figure 3). Because the
recombination rate is low [~1 crossover per 100 megabases (Mb) per generation], disease alleles in the population
typically show association with nearby
marker alleles for many
generations, a phenomenon termed linkage disequilibrium (LD) (Altshuler et al., 2008). The linkage
relevant SNPs (tagSNPs) that will provide enough information to predict the frequency and incidence of the remaining common SNPs, thus only “tag SNPs” are required to be part of a genotyping panel and for subsequent analysis in further experiments (figure 3) (The International HapMap consortium, 2003). The combination of tagSNPs and well characterized functional markers permit the highest possible gene coverage, making possible the functional marker-phenotype association as well as a haplotype based association (see figure 4). A recent study (Jones et al., 2007) has demonstrated the use of a combined strategy, which is the use of candidate genes complemented with HapMap resources, giving more strength for finding the associated markers. They demonstrate that the use of HapMap markers and a candidate gene approach have led to identification of the well established TPMT polymorphism (719 A>G), which is linked with the clinical loss of TPMT activity and consequently higher drug related toxicity (see figure 5).
2.4.3. Towards clinical translation
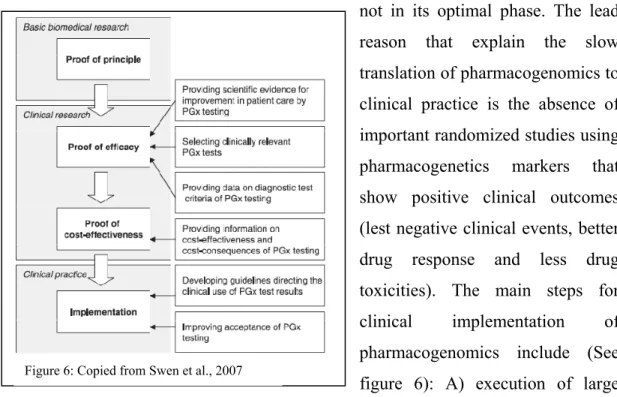
Despite the accumulation of publications in pharmacogenomics showing the clinical benefits for many biological processes, the translation towards the clinic is not in its optimal phase. The lead reason that explain the slow translation of pharmacogenomics to clinical practice is the absence of important randomized studies using pharmacogenetics markers that show positive clinical outcomes (lest negative clinical events, better drug response and less drug toxicities). The main steps for clinical implementation of pharmacogenomics include (See figure 6): A) execution of large prospective clinical studies showing the benefit of pharmacogenomics; B) developing
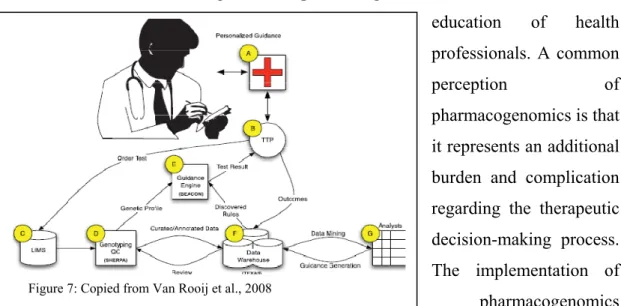
Figure 7: Copied from Van Rooij et al., 2008
robust and validated tests to support the specific molecular profiling assays; C) development of specific clinical guidelines; D) education of clinicians and other health care professionals who interact with patients; E) creation of ethical guidelines (Manolopoulos, 2007). The lack of approved diagnostic tests and the lack of robust genetic assays are the two most critical technical issues today. However, recent improvements in the technologies that support the analysis of variant alleles that underline the ADR or drug inefficiency have resulted in a number of potentially commercial assays. With the recent advancement of available robust and accurate technologies combined with the recent introduction of FDA-approved clinical assays, such as the Amplichip from Roche and the Invader UGT1A1*28 assay, the translation to the clinic is on the way to common use. However, one of the major non-technical issues for the integration of pharmacogenomics into the clinic is still
education of health professionals. A common
perception of pharmacogenomics is that
it represents an additional burden and complication regarding the therapeutic decision-making process. The implementation of
pharmacogenomics training at undergraduate and postgraduate levels as well as continuing medical education will help inform professionals how to apply pharmacogenomics in modern medicine. In order to facilitate the integration of pharmacogenomic results into clinical application, some researchers have started to initiate the development of a pharmacogenomic clinical informatics systems (see figure 7). This application will bridge the gap between the current pharmacogenomic research and the reality of clinic application. The clinical translation will facilitate the incorporation of pharmacogenomics testing by informing the clinician about available pharmacogenomics tests, facilitate the transfer of relevant pharmacogenomics
information between the lab and clinical site and provide clinical guidance on drug prescriptions and relevant dose based on lab results (Van Rooij et al., 2008).
3. Genotyping and cutting edge technologies
The detection of causative polymorphisms that have the potential to impact protein expression or activity has always been of great interest among the scientific community. Before the arrival of PCR (polymerase chain reaction) in the mid 1980s, the first genotyping technique to be used to detect a single base mismatch was the hybridization of allele-specific oligonucleotides (ASO) and was first described in 1979 (Wallace et al., 1979). The technique was then used for the first time in 1983 to detect the sickle-cell mutation in the β-globin gene (Conner et al., 1983). With the invention of PCR, a broad spectrum of different genotyping techniques was developed. One of the first PCR-based genotyping techniques that was developed was SSCP (single-stranded conformation polymorphism) detection, where both alleles are separated on a non-denaturing polyacrylamide gel and detected following their migration patterns (Shi, 2001). This technique was relatively popular excluding the fact that it is labor intensive and low throughput. Another widely employed PCR-based genotyping technique was called PCR-RFLP. This involved PCR amplification followed by restriction enzyme digestion and became one of the most popular techniques in the 1980s and is still used today. This technique utilizes highly specific restriction enzymes that cleave specific DNA sequences. If the polymorphism creates or removes a restriction enzyme site present in the PCR fragments then the polymorphism will result in a specific digestion pattern that can be visualised using gel electrophoresis (Shi, 2001). The PCR-RFLP based genotyping technique, despite being low-throughput, remains today extremely popular and has been utilized in many recent studies and clinical applications. For instance, this technique is currently used in the clinic to detect variability in the HLA region (Human leukocyte antigen) (Doxiadis et al., 2003) as well as some cytochrome P450 variations (Jannetto et al., 2004). However these PCR-gel based strategies are mainly used for single gene
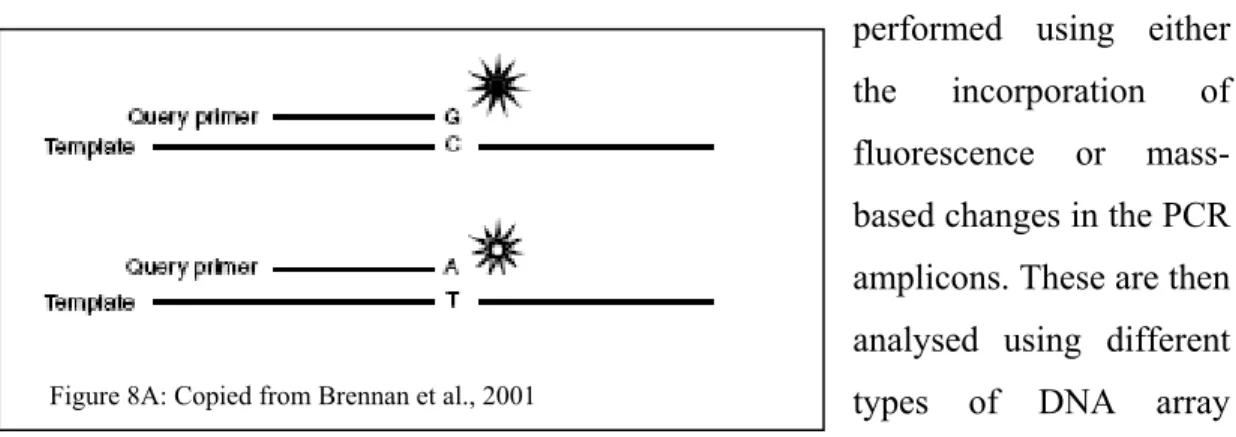
Figure 8A: Copied from Brennan et al., 2001
analysis in a low throughput context, and with the growing interest for polymorphism detection in polygenic diseases, such strategies are not viable.
Over the past 10 years, an impressive number of different non-gel-based high-throughput technologies have been developed in order to support large diseases-based genetic polymorphism association studies as well as for supporting large-scale pharmacogenomics studies. Two main categories of technologies have been developed, the medium-high-throughput and very high-throughput technologies. Each category of technologies has been developed to support different needs. In general, the medium-high-throughput technologies are most suitable for a large number of samples (>384) to be screened for a few genetic polymorphisms (~12 to 50), whereas the very-high-throughput technologies are most suitable for a large amount of genetic polymorphisms (~1536 to 1,000,000) for a low number of samples (<96).
3.1.Medium-High-Throughput technologies
This category of technology primarily utilizes a PCR-based strategy, but instead of identifying the genetic polymorphisms using gel electrophoresis, the detection is
performed using either the incorporation of fluorescence or mass-based changes in the PCR amplicons. These are then analysed using different types of DNA array matrices. Typically, this category of technology can multiplex between 12 and 50 different genomic regions in a single PCR reaction and can analyse 384 samples simultaneously. In general, the size of the PCR amplification containing the genetic variation is limited to ~100 to 200 bp in order to amplify uniformly all of the
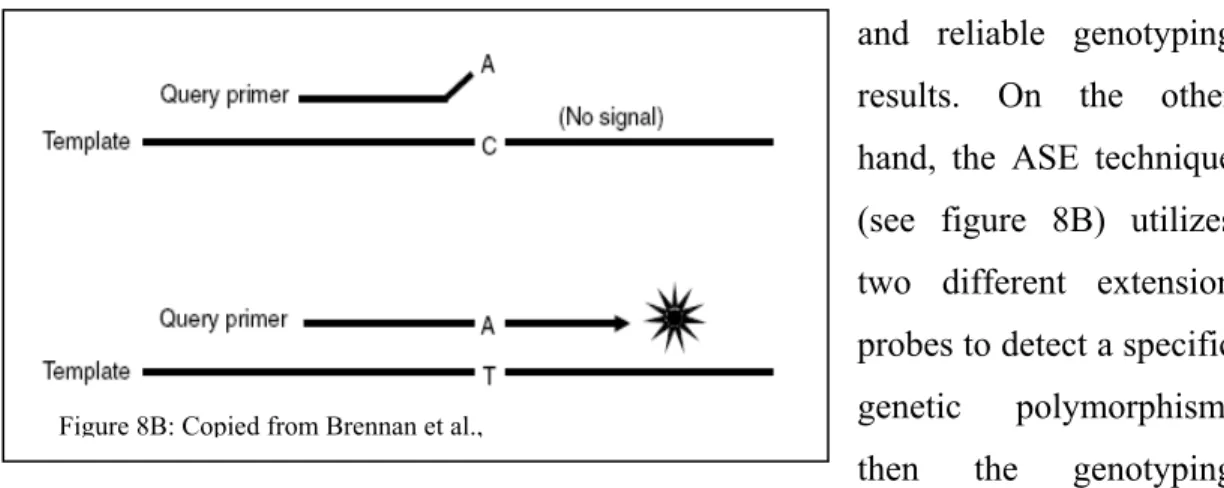
Figure 8B: Copied from Brennan et al.,
genomic regions and reduce amplification competition among the PCR reactions within the same tube.
From the multiplex PCR reaction, depending on which technology the downstream genotyping process is processed; the detection of the polymorphic sites is typically achieved using either SBE (Single base extension) or ASE (Allele specific extension). Single base extension tends to be more robust and accurate than the ASE technique since the SNP detection is based on the high accuracy of nucleotide incorporation by the DNA polymerase (Syvanen et al., 2001) (see figure 8A). Basically the same extension probe is hybridized to the pre-amplified PCR template and then the SNPs are extended by one base using a modified DNA polymerase and nucleotides. Since the extension probe for a specific polymorphism has the same affinity for all different alleles, the reaction conditions remain similar giving robust and reliable genotyping results. On the other hand, the ASE technique (see figure 8B) utilizes two different extension probes to detect a specific genetic polymorphism, then the genotyping specificity is driven by the affinity of both extension probes for the PCR template. Since precise and accurate hybridization is required for specific allele extension of the probe, most of the time this technique requires rigorous optimisation to allow for uniform and similar annealing hybridization to accurately discriminate both alleles. This is more complex when multiplexing is involved. However, both genotyping techniques are represented among the most cited technologies. SBE is the method of choice for many known medium-throughput technologies as such as, SNaPshot from Applied Biosystems (Foster City, CA), SNPstream from Beckman Coulter (Fullerton, CA) and MassArray from Sequenom (La Jolla, CA), whereas the ASE detection is utilized by Taqman from Applied Biosystems (Foster City, CA), Tag-It from Luminex Molecular Diagnostic (Austin, TX) and Infinity from Autogenomics
(Carlsbad, CA) (Syvanen, 2001 and King et al., 2008). For all these technologies, the detection method depends on specific PCR amplification of the genomic region encompassing the genetic polymorphism. Specific PCR amplification is required to precisely and quantitatively amplify the desired genomic region to a degree where the detection method can adequately distinguish between homozygotes and heterozygotes for the SNPs of interest. The difficulty of designing and performing multiplexed PCR reactions is an important factor that limits the throughput of SNPs within each reaction.
These technologies have been used for many medium sized studies as well as to support clinical assays. In the context of fundamental research applications, these technologies have been utilized to support the fine SNP mapping of the associated genomic loci or to validate associated SNPs in a replicate cohort (Sladek et al., 2007). Since these technologies are completely customizable and give accurate results, diagnostic and clinical applications utilizing them are possible.
4. Blood antigens: Red blood cells and platelet antigens
Blood group antigens are proteins, glycoproteins or glycolipids that are located on the exofacial surface of the RBC (red blood cell) and platelet membranes. They are known to be genetically polymorphic. Inheritance of these variations results in variability in the structural characteristics of an individual’s blood cells. For red blood cells, there are 30 blood group antigen systems whereas for platelets there are 24 antigens. The genetic bases of the carbohydrate–dependent blood groups are established by variation in glycosyl-transferase DNA sequences expressed by the erythroid and platelet cells, which are known to affect the enzyme specificity or the efficacy of polysaccharide synthesis occurring in the Golgi compartment (Avent et al., 2007). The most clinically relevant RBC antigen systems are related to the structural erythrocyte membrane proteins: ABO (ABO), RH (D, cC, eE), Duffy-DARC (Fyab), Kidd-JK (Jkab), Kel and XK (kK and Kapab), MNS- GPYA-GPYB
(MN, sS), Colton-AQP1 (CO) and Dombrock-ART4 (DO) (Avent et al., 2007). These proteins have different functions in the cell, such as; transporters and channels (RH, JK, CO), structural functions (GPYA and GPYB), chemokine receptors (FY), and membrane-bound proteins (KEL and DO). The most relevant platelet antigens are HPA1-ab, HPA2-ab, HPA3-ab, HPA4-ab, HPA5-ab and HPA15-ab.
The cells carrying a particular antigen can, if introduced into the circulation of patient with difference minor blood cell antigens, produce an immune response. The antibodies produced by the patient against the foreign antigens can result in problems in transfusion incompatibility, maternal-fetal incompatibility and autoimmune hemolytic anemia (Reid, 2003). In many countries, only major blood antigens ABO and D are routinely tested for in patients receiving infrequent blood transfusions, however chronically transfused patients that are suffering from sickle cell diseases, thalassaemia, autoimmune hemolytic anemia and plastic anemia need closer monitoring of their RBC and platelet antigen profiles (Polin et al., 2008). Additionally, it has been described by the National Heart, Lung and Blood institute that the incidence rate for alloimmunization for patients suffering from sickle cell disease and receiving blood, is 20 percent or higher compared to 5 percent in the other transfusion-dependent patients (Reid, 2007). The major blood antigens, ABO, are rarely involved in HDN (hemolytic disease of the fetus and newborn), in contrast the minor antigens Rh, Kell, Duffy and Kidd are seriously implicated in neonatal alloimmunization. In the case of platelets, limited numbers of platelet transfusion-dependent patients develop HPA antibodies; however the HPA profile is often required in the case of neonatal alloimmune-mediated thrombocytopenic purpura (Beiboer et al., 2005).
4.1.Goodbye hemagglutination, welcome DNA based assays
Traditionally, hemagglutination has been the principal analytical tool of immunohematology to determine blood antigens. This technique was used for the
first time by Karl Landsteiner in 1901 when he discovered the major ABO blood antigens and was then modified by Coombs, Mourant and Race when they discovered many other minor blood antigens. The principal of hemagglutination is the antibody-mediated clumping of particles that express antigens on their surface. Basically, serum containing a known antibody is added to a suspension of RBCs and if the cells carry the equivalent antigen they are agglutinated, if no agglutination appears the cells are lacking the antigen (Anstee, 2005). More recently, 29 of the 30 blood group genes have been cloned that encode more than 300 blood group antigens. This has paved the way toward the development of DNA molecular based testing, especially for the minor blood group antigens where the majority of genetic bases are associated with only one SNP. However the genetic basis of the major blood group (ABO) antigens are quite complex, since more than 15 SNPs have to be typed to correlate the current hemagglutination test. Robust, reliable tests and reagents have been optimized for the major blood antigens (ABO and D) over the last twenty years, but at the same time the hemagglutination technique has shown a lack of robustness and reliability for the minor blood antigens. Even if the hemagglutination tests, when appropriately performed, have the sensitivity and specificity to support clinical needs, the technique has demonstrated limitations for many important clinical aspects such as unreliable prediction of a fetus at risk to develop hemolytic disease of newborn (HDN), difficulty to correctly type the RBCs of patient who recently received a blood transfusion, as their blood cells are coated with antibodies, and it does not predict D zygosity in D+ patients (Reid, 2003). In addition, only relatively small numbers of donors can be typed because of reagent shortages in reliable antisera due to limited availability of antigen-specific antisera inventories. Also it has been reported that many antibodies are not well characterized and some antibodies are weakly reactive or simply unavailable (Reid, 2003). This is also true for the platelet antigens where only the HPA1 assay has a specific monoclonal antibody available, whereas the other important HPA antigens can only by typed using fastidious human antisera-based assays (Reid, 2007). Because of the poor availability and poor performance for some of these reagents, the hemagglutination technique has been severely limited while at the same time being the accepted standard for worldwide blood-typing for the entire
20th century. With the challenges and inefficiencies of the hemagglutination assay coming to light and the advent of new genomic technologies, now is the time to change the paradigm and to evaluate the effectiveness of antigen specific genotyping as a tool for clinical blood banking.
5. Scientific interest and global objectives
Since it is widely accepted that genetic variation contributes to variability in disease phenotypes and drug responsiveness, the development of DNA based molecular profiling assays has become more established and has led to the promise of personalized medicine. From the drive to develop many meaningful genetic assays, many different techniques and technologies have been developed to support the identification of genetic variants and therefore contribute to the association between DNA makeup, diseases and xenobiotics responses. Historically, because of technical issues and statistical power, the interaction of diseases or drug response with DNA composition has only evaluated one gene at the time for a limited number of genetic markers. With the recent advancement in genotyping technologies, reduction in costs, the capacity to multiplex many genes and the ability to screen many markers in a single reaction, the use of genetic biomarkers in clinical research has been greatly accelerated. With the numerous possible applications brought on by these cutting-edge technologies, we have set out to develop many different DNA based panels to support pharmacogenomic needs in the context of the clinical environment. The actual worldwide interest for personalized medicine has increased significantly since the development of new DNA-based technologies but, up to now, only a few clinically approved DNA-based assays are available and used for specific applications. In that context, along with the development of clinical grade pharmacogenomics assays, we have created a unique Canadian Clinical Centre environment dedicated to pharmacogenomics research. One of the goals of our Centre to is to set the standards for pharmacogenomics panel development and
operations. Our Centre is presently working to become recognized as supporting clinical research under GLP (good laboratory practice) standards and to become accredited by the College of American Pathologist (CAP and CLIA). Until we reach this accreditation, we are developing and validating all DNA-based assays following rigorous clinical guidelines in order to support pharmaceutical development projects or clinical trials, as well as biotechnology companies and hospital network projects.
Since using the traditional hemagglutination techniques to screen blood banking donors for compatible blood can be very problematic and sometimes impossible, and because, as described earlier, hemagglutination is the main technique used to type the worldwide blood reserve. As part of my thesis research, we wanted to develop a clinical grade genetic panel that could improve on the efficiency and cost of the hemagglutination assay and that would support the creation of a minor blood group antigens electronic database for donors from Héma-Québec. Using knowledge of DNA-based panel development previously acquired at the Pharmacogenomics Centre, we plan to create a unique pharmacogenomics panel of 11 DNA markers that could infer the phenotypes of 22 of most clinically-relevant minor blood group antigens using a medium-high-throughput technology. The development process will consist of a development phase followed by a clinical validation phase. Once the validation phase is completed and accepted by Héma-Québec, we will develop a set of clinical laboratory standard operational procedures (SOPs) that will permit the integration of the pharmacogenomics minor blood group antigen genotyping panel into Héma-Québec’s clinical processes. We will then conduct a proof of concept project to evaluate how the use of this genotyping panel and the creation of a database of molecularly profiled donors can improve Héma-Québec’s operations. The proof of concept study will consist of the screening of 22,000 patients in order to create the first North America blood bank electronic register for minor blood antigens.
The molecular profiling data in the database will be used to:
• Help assign appropriate donors to patients requiring frequent blood transfusions
• Identify afetus at risk for HDN
• Detect weakly expressed antigens (e.g., Fyb with the FyX phenotype); where the patient is unlikely to make antibodies to transfused antigen-positive RBCs
• Replace antibody hemagglutination assays that are weak or not available, • Distinguish an alloantibody from an autoantibody
• Identify molecular basis of unusual serologic results, especially Rh variants • Permit large scale screening of antigen-negative donors to create an
inventory of donors whose RBCs lack a high-prevalence antigen • Detect genes that encode weak antigens
MATERIALS AND METHODS
1. Gene and marker selection
The nine genes and eleven markers presented in table 1 were selected by the clinical and the development departments of Héma-Québec (HQ). Briefly these variations were selected on the basis of the clinical requirements of regulatory agencies (Canadian, American as well as European) as well as the specific Quebec requirements regarding frequencies (above 5%) and relevance of these antigens in the population.
Table 1: Genes, markers and antigens details
This table describes the genotyping minor blood antigen panel content. For each antigen the table shows their public database IDs (related genomic marker), nucleotide variations and the downstream amino acid changes.
2. DNA sources
Panel Development: DNAs from 96 Caucasian, 96 African-American and 89 Asian unrelated healthy individuals were obtained from the Coriell Institute for Medical Research (Camden, NJ) following completion of the appropriate assurance and research statement forms. All samples were thawed at room temperature and 8.3µL (all original samples concentrations were around 300ng/µL) of all samples were transferred into three 96-well plates. The volumes were completed to 200µL
with PCR grade water to yield a final concentration of ~12.5ng/µL. FTA cards with blood were also received from Héma-Québec for testing the punching and DNA extraction techniques, as well as the genotyping conditions.
Panel Validation: Peripheral blood samples were collected from 618 randomized volunteers from the province of Québec after signature of an informed consent form approved by Héma-Québec’s Research Ethics Committee. Samples consisted of a blood drop applied on an FTA card. All samples were anonymized and the FTA cards were sent to Génome Québec in Montreal for genotyping. These samples were used for the genotyping blood antigen panel (GBAP) validation since a good proportion of these blood samples were also phenotyped at Héma-Québec for the typical minor blood group antigens using standard serology techniques.
3. DNA extraction from FTA cards
DNA was extracted from the FTA cards using the GENERATION DNA purification technology (Qiagen, Mississauga, ON). To test which FTA paper punch size generated the highest extracted DNA yield, 2mm, 3mm and 4mm punches were made using a Harris Uni-Core Puncher and distributed in a standard 96-well plate containing 1µL of PCR grade water whereas the 6mm punches were distributed in a deep well plate containing 1µL of PCR grade water. Three blank punches were generated between each sample to clean the puncher. During the validation steps only the 2mm punch size was used. To remove haemoglobin contained in the FTA card, 150 µL of Buffer 1 (DNA purification solution; G1-1000) was added to each well using a 12-channel pipette and then incubated at room temperature for 20 minutes. All samples were mixed three times using a 12-channel pipette with an up and down action and the coloured mixture was discarded. Two more washing cycles were performed with the Buffer 1 and Buffer 2 (DNA elution solution; G2-500). All remaining purification solution was completely removed. To extract DNA from the FTA card punch, 25 µL of Buffer 2 was added to each sample and incubated at 99⁰C for 15 minutes. After the incubation, the plates were pulse centrifuged and the entire contents of each well (without the FTA card) were transferred to a new 96-well plate.
The extracted DNAs were quantified with the Nanodrop system using 2 µL of undiluted mixture. The DNAs were also quantified using Picogreen (Invitrogen, Carlsbad, CA) diluted from 200X to 1X in TE buffer and the Varioskan (ThermoFisher, Waltham, MA) (Biotechniques, 1996).
3.1. Long PCR amplification on DNAs extracted from FTA cards
CYP2D6 (chromosome 22, positions 40853647 to 40855434) was amplified using PCR oligos 2D6_Prd7-F 5’ CTGGAATCCGGTGTCGAAGTGG 3’ and 2D6_Prd7-R 5’ CGGCCCTGACACTCCTTCTTG 3’ at 0.5 µM final concentration. The PCR master mix contained 1X PCR buffer, 1.5 mM MgCl2, 0.4 mM dNTPs, 5%
DMSO and 0.3 U/µL of Platinum Taq (Invitrogen, Carlsbad, CA). 2 µL of DNA extracted from FTA cards was mixed with 8 µL of the master mix and amplified following the initial denaturation at 95⁰C for 2 minutes then 2 cycles of 92⁰C x 1 min., 59⁰C x 1 min., 68⁰C x 6 min. and 35 cycles of 92⁰C x 30 sec., 59⁰C x 30 sec. and 68⁰C x 6 min. 5 µL of the PCR amplification buffer and 3 µL of the 1 kb ladder (Invitrogen, Carlsbad, CA) were mixed with 10 µL of PCR grade water and loaded on a 1% agarose gel for band analysis.
APOE (chromosome 19, positions 50100128 to 50101071) was amplified using PCR oligos rs449647-PCRU3 5’ GCATCATACTGTTCCCACCCCTC 3’ and rs440446_PCRL2 5’ CCGCTCCTCCTCTCCCCAAG 3’ at 0.45 µM final concentration. The PCR master mix contained 1X PCR buffer, 1.5 mM MgCl2, 0.1
mM dNTPs, 1X Qsolution and 0.06 U/µL of Qiagen HotStart Taq (Qiagen, Mississauga, ON). The amplification was obtained using 2 µL of DNA and 3 µL of master mix and amplified with the initial denaturation at 95⁰C for 15 minutes then 12 cylces of 95⁰C x 30 sec., 66⁰C x 45 sec. (-0.5⁰C/cycle), 72⁰C x 45 sec. and 30 cycles of 95⁰C x 30 sec., 60⁰C x 45 sec., and 72⁰C x 45 sec. 5 µL of the PCR amplification buffer and 3 µL of the 1 kb ladder (Invitrogen, Carlsbad, CA) were mixed with 10 µL of PCR grade water and loaded on a 1% agarose gel for band analysis.
4. Genotyping 4.1. Primer Design
DNA sequences flanking each SNP were tested for the presence of repeats or duplicated regions and masked if needed using the BLAT program (http://www.genome.ucsc.edu). All DNA sequences, except for c/C, e/E, M/N and s/S antigens, were formatted using the appropriate SNPstream and Sequenom oligonucleotide design software programs. For the first phase of development, the PCR and extension primers were designed using the Autoprimer (http://www.autoprimer.com) and Sequenom AssayDesign software for SNPstream and Sequenom technologies respectively. For the SNPstream technology, the program selects PCR primers that will generate products ranging between 80 and 200 bp and an optimized single base-pair extension primer 5’ to the SNP site and assembles them into panels of 12 SNPs of the same extension type (i.e. G/A or C/T extension mixes). Also, the Autoprimer program added a unique tag address of 20 bases at the 5’ of each extension oligo in order to make the hybridization possible onto the microarray SNPware plate (Bell et al. 2002). Similar to the Autoprimer program, the AssayDesign software designs PCR primers that will generate amplicons ranging from 80 to 200 bp. The software also suggests the appropriate single base-pair extensions ranging in size from 18 bp to 35bp in order to separate them from the extended SNPs according to their respective masses. The AssayDesign software also adds 10 extra bases (ACGTTGGATG) at the 5’end of the PCR oligo to increase the total mass above 10,000 Daltons. This brings the detected PCR oligo masses outside of the analyzed window (3500 to 9000 Daltons) in the mass spectrum. Both the autoprimer and AssayDesign software are dedicated to design only one oligo set per SNP at a time (one set meaning two PCR oligos and one extension primer). Since the minor blood group antigen genotyping panel design required assays for both DNA directions, the second extension primers were designed using a modified input file that directed the extension oligo design in the opposite direction of the initial set. The PCR and extension oligos of c/C, e/E, M/N and s/S antigens were manually designed to overcome genomic challenges and SNPstream platform
specific issues respectively. The output design was then submitted to blast analysis (http://www.ncbi.nlm.nih.gov/) and to inSilico PCR (http://www.genome.ucsc.edu) to ensure the uniqueness of all PCR oligos and expected amplicon sizes. Since all PCR oligos and extension primers need to work in a unique multiplex reaction, all oligo sequences were assayed for secondary structures and for possible self and inter-oligo priming issues using the software FastPCR (http://www.biocenter.helsinki.fi/bi/Programs/fastpcr.htm). In subsequent design rounds, modifications were made to the PCR and extension primer compositions to resolve genomic related problems, PCR amplification specificities, and lack of extension performance.
4.2. Multiplex PCR amplification
Twelve-plex PCR reactions were performed in 384-well plates (MJS BioLynx, Brockville, ON) in a 5 μL volume using 2 μL of ~12.5 ng/μL of Coriell Institute of Medical Research (Camden, NJ) DNAs and 2 μL of extracted DNA from the FTA cards. The remainder of the volume consisted of 75 μM dNTPs, 4.5 mM MgCl2,
0.5 U Hotstart DNA polymerase (Qiagen, Mississauga, ON), and the 24 PCR primers at a concentration varying from 50 nM to 100 nM each in 1 X PCR buffer (refer to tables 2 and 3 for PCR oligo details). Thermal cycling was performed using GeneAmp PCR system 9700 thermal cyclers (Applied Biosystems, Foster City, CA) with the following program: initial denaturation at 95°C for 15 min. followed by 45 cycles of 95°C for 30 sec., 55°C for 55 sec., and 72°C for 30 sec. After the last cycle, the reaction was held at 72°C for 7 min. Following multiplex PCR using SNPstream oligos and plates were centrifuged briefly and 3 μL of a mixture containing 0.67 U Exonuclease I (USB Corporation, Cleveland, OH) and 0.33 U Shrimp Alkaline Phosphatase (USB Corporation, Cleveland, OH) were added to each well. Following the multiplex PCR using Sequenom oligos, 2 µL of Sequenom Shrimp Alkaline Phosphatase mixture was added to each well. The plates were sealed and incubated for 30 min. at 37°C and at 95°C for 10 min. During the panel validation only the SNPstream and Sequenom PCR oligo mixes versions 2 and 1 were used (Table 2).
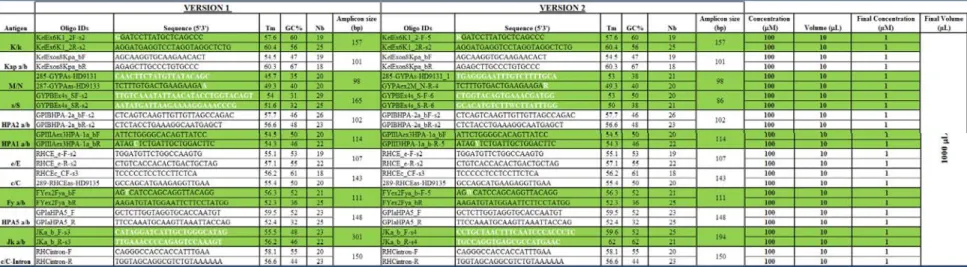
Table 2: SNPstream PCR oligos mix details
Version one, except for the antigens M/N, s/S, c/C, c/C-intron and e/E where they were manually designed, represents the automatic SNPstream PCR oligo output results obtained after the initial design phase using the Autoprimer software. The nucleotides highlighted in white for version 2 represent the manual changes applied on the initial design to increase the specificity and quality of the genotyping results. In both versions, the oligos were mixed together and volumes increased to 1.0 mL with PCR grade water to reach a PCR oligo mix final concentration of 1 µM .
Table 3: Sequenom PCR oligos mix details
Except for the antigens M/N, s/S, c/C, c/C-intron and e/E where manual designed was performed, the table represents the automatic Sequenom PCR oligo output results obtained after the initial design phase using the AssayDesign software. This version of the PCR oligo design was used to cross-compare and validates the genotyping results with the SNPstream panel. The oligos were mixed together and volumes were increased to 1.0 mL with PCR grade water to reach a PCR oligo mix final concentration of 1 µM.
4.3. Single-Base multiplex extension reaction and genotyping scan
SNPstream technology: Genotyping extension reactions and hybridizations to the SNPware 12-plex microarray plates were carried out as described by Bell et al., 2002. Briefly, the extension mixes were prepared in a 7 µL volume using 3.77 µL of SNPware extension mix diluents (Beckman Coulter, Fullerton, CA), 0.2 µL of the SNPware 12-Plex extension mixes GA and TC, containing two dideoxynuclotides labelled with either BODIPY-Fluorescein or TAMRA dye (Beckman Coulter, Fullerton, CA), 2.95 µL of PCR grade water, 0.017 µL of SNPware DNA polymerase (Beckman Coulter, Fullerton, CA) and 0.06 µL of GA and TC multiplex extension oligo mixes (refer to table 4). These mixes were added to each well of the previous multiplex PCR reactions. Thermal cycling was performed in GeneAmp PCR system 9700 thermal cyclers (Applied Biosystems, Forster City, CA) using the following program: initial denaturation at 96°C for 3 min. followed by 45 cycles of 94°C for 20 sec. and 40°C for 11 sec. The SNPware 12-plex microarray plates were conditioned three times with buffer 1 (1X of non-stringent) prepared as per the manufacturer recommendations, and partially dried using a vacuum system. 8 µL of hybridization mixture containing 7.56 µL of SNPware hybridization Solution and 0.44 µL of SNPware hybridization additive were added to each well of the extension reaction plates. After mixing up and down each samples ten times, 15 µL of mixture was transferred to the conditioned SNPware 12-plex microarray plate following the same sample-plate layout (A01 to A01...B01 to B01...). The transferred mixture was then uniformly distributed throughout all wells by gently tapping the corner of the microarray plate. The plates were then placed into a hybridization oven at 42⁰C for two hours in a humid container. After two hours, the microarray plates were washed out three times using ~20 µL of buffer 2 (1X of stringent buffer) prepared as per the manufacturer recommendation (Beckman Coulter, Fullerton, CA). The plates were dried out as much as possible with the vacuum system and then placed upside-down into the centrifuge for 5 min at 3000 RPM. The plates were read using the GenomeLab SNPstream Array Imager (Beckman Coulter, Fullerton, CA) and fluorescence intensity was measured with help of the SNPstream Imager software.
Intensity was plotted and genotypes were called by the GetGenos software. After visual inspection of the clusters, manual adjustments were made for some of the assays.
Sequenom technology: The extension mixes were prepared in 2 µL using 0.2 µL of iPlex buffer 10X (Sequenom, La Jolla, CA), 0.2 µL iPlex terminator mix containing four dideoxynuclotides modified with a unique mass component (Sequenom, La Jolla, CA), 0.76 µL of PCR grade water, 0.041 µL of iPlex DNA polymerase (Sequenom, La Jolla, CA) and finally 0.804 µL of multiplex extension oligos mixes (refer to table 5). Both 2 µL extension mixes were added to each well of the previous multiplex PCR reactions. Thermal cycling was performed in GeneAmp PCR system 9700 thermal cyclers (Applied Biosystems, Foster City, CA) using the following program: initial denaturation at 94°C for 30 sec. followed by 200 cycles of 94°C for 5 sec., 52°C for 5 sec., and 80°C for 5 sec. followed by a final extension of 3 min. at 72°C. 15 µL of PCR grade water and 6 mg of chelating resin were added to each well of the extension reaction plates. The plates were sealed, incubated for 15 min. by rotation at room temperature and spun down. The plates were then placed onto the nanodispenser deck (Sequenom, La Jolla, CA) and ~ 15 nL of the extension reactions and calibrator were spotted on the SpectroChip (Sequenom, La Jolla, CA). The chips were read using the Sequenom MassArray Maldi-TOF system (Sequenom, La Jolla, CA) and the different extended mass intensities were measured with the help of the Sequenom MassArray Imager software. Intensities were plotted and genotypes were called by the SequenomTyper software. After visual inspection of the clusters, manual adjustments were made for some of the assays.
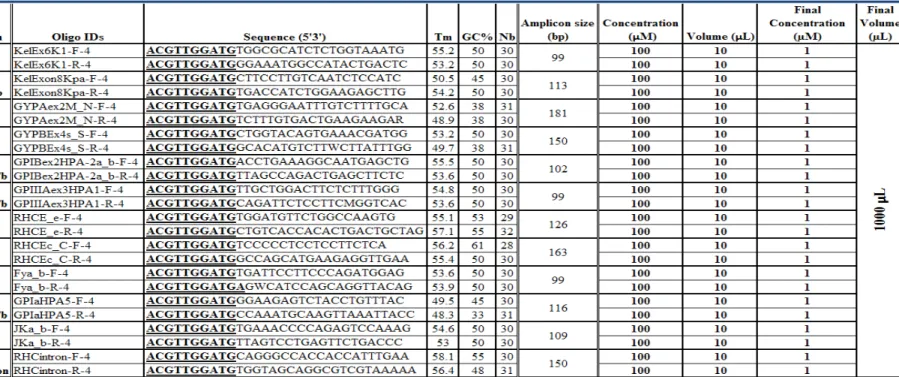
Table 4: SNPstream GA and TC Extension oligo version details
For version one, except for the antigens M/N, s/S, c/C, c/C-intron and e/E where the oligos were manually designed, the extension oligos were designed using the automatic Autoprimer software. The oligos nucleotides highlighted in white represent the manual changes applied on the initial design to increase the specificity and quality of the genotyping results. In both versions, the extension oligos for both ”GA and CT” reactions were mixed together with PCR grade water in two separate tubes in a final volume of 1.0 mL to reach extension oligo mixes of 5 and 10 µM final concentrations, respectively.
Table 5: Sequenom Forward-Reverse Extension oligos details
Except for the antigens M/N, s/S, c/C, c/C-intron and e/E where manual designs were obtained, the table represents the automatic Sequenom Extension oligo output results obtained after the initial design phase using the AssayDesign software. This version of the PCR oligo design was used to cross-compare the genotyping results with the SNPstream panel. The extension oligos of “F and R” were mixed together with PCR grade water in two separate tubes to a final volume of 1.0 mL.