NBER WORKING PAPER SERIES
WORKERS' EMPLOYMENT RATES AND PENSION REFORMS IN FRANCE: THE ROLE OF IMPLICIT LABOR TAXATION
Didier Blanchet Antoine Bozio Simon Rabaté Muriel Roger Working Paper 25733 http://www.nber.org/papers/w25733
NATIONAL BUREAU OF ECONOMIC RESEARCH 1050 Massachusetts Avenue
Cambridge, MA 02138 April 2019
The views expressed herein are those of the authors and do not necessarily reflect the views of the National Bureau of Economic Research.
NBER working papers are circulated for discussion and comment purposes. They have not been peer-reviewed or been subject to the review by the NBER Board of Directors that accompanies official NBER publications.
© 2019 by Didier Blanchet, Antoine Bozio, Simon Rabaté, and Muriel Roger. All rights reserved. Short sections of text, not to exceed two paragraphs, may be quoted without explicit permission provided that full credit, including © notice, is given to the source.
Workers' Employment Rates and Pension Reforms in France: the Role of Implicit Labor Taxation Didier Blanchet, Antoine Bozio, Simon Rabaté, and Muriel Roger
NBER Working Paper No. 25733 April 2019
JEL No. H55
ABSTRACT
Over the last fifteen years, France has experienced a reversal of older workers’ labor force participation and employment rates. Changes in health, life expectancy or education levels over the period are trend variables and thus cannot explain this “U-shaped” time profile. Pension reforms and associated changes in monetary incentives to retire are a more plausible explanation. Their impact is measured by the implicit tax rate on working longer, which combines induced changes in the level of benefits and the fact of foregoing one year of these benefits. We also account for changes in the relative importance of alternative pathways to normal retirement. Pension reforms and access to these alternative pathways have moved in ways that can account for a significant part of the “U-shaped” pattern of older workers labor force participation.
Didier Blanchet INSEE 88 Avenue Verdier 92541 MONTROUGE CEDEX FRANCE didier.blanchet@insee.fr Antoine Bozio
Paris School of Economics 48 Bd Jourdan
75014 Paris France
antoine.bozio@ipp.eu
Simon Rabaté
Paris School of Economics
48 boulevard Jourdan Ecole d'économie de Paris 75014 Paris, France simon.rabate@ipp.eu Muriel Roger
CES - Université Paris 1 Panthéon Sorbonne 106-112 boulevard de l'Hôpital
75013 Paris France
2 I. INTRODUCTION
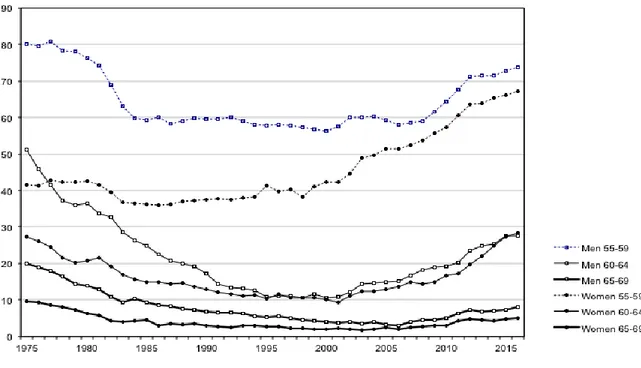
France has experienced a clear reversal of older workers’ labor force participation (LFP) and employment rates over the last 15 years. These two rates had continuously declined in the 1970s and the 1980s for the 60-64 age group, bringing employment rates at a low 10% for both genders. A similar drop took place for men in the 55-59 age group, more concentrated in time but very substantial: their employment rate lost 20 percentage points within only a few years around 1980. Women in this 55-59 age group have been the only exception to this general decline, due to the offsetting effect of increasing lifetime labor force attachment between successive cohorts. For all other groups, the trend toward earlier exits has reversed since the mid-2000s. We are now back to the levels of the 1970s for men in the 55-59 age group and the labor force participation rate has almost doubled again for men and women in the 60-64 age group. It is now a little over 20%.
Figure 1: Senior employment rates, by gender and five-year age groups
Source: French Labor Force Survey
Both the initial decline and the subsequent U-turn have been addressed by a substantial body of literature. Blanchet and Pelé (1999) had emphasized the high level of implicit taxation of labor beyond the age of 60 that characterized the French pension system in the early 1990s. Subsequent reforms have tried to remove most of this implicit taxation, but
3
they also modified other parameters of the retirement decision, both on the supply and demand sides of the labor market: stronger requirements for reaching the pivotal age at which a “full rate” pension is obtained, lower replacement rates offered at this age, lower indexation prospects after entry into retirement, stricter control on access to early retirement routes as well as reduced possibilities for firms to terminate normal labor contracts at the full rate age. Faced with the need of evaluating the long run impact of these reforms, several projection tools have been developed : most of them are dynamic microsimulation models, and they offer more or less sophisticated endogenizations of retirement behavior at the micro level, either under the assumption of departures centered around the full rate, or using some more structural assumptions in the spirit of Stock and Wise (1990) (Mahieu and Sedillot, 2000; Mahieu and Blanchet, 2004). Bachelet et al. (2011) compare messages delivered by these different ex ante modelling approaches on reforms implemented until 2010. In parallel, with reforms beginning to produce their first observable effects, ex post econometric evaluations start being available, generally exploiting discontinuities generated by the reforms, as in Bozio (2011) or Benallah (2011) for private sector workers after the 2003 reform, Baraton et al. (2011) for the impact of the same reform on teachers in the public education sector, Rabaté and Rochut (2016) or Dubois and Koubi (2017) for the impact of the 2010 reform, and finally Rabaté (2016) for a more specific focus on changes that have affected mandatory retirement. To this literature can be also related empirical explorations of the so-called “horizon effect” by Hairault et al. (2006), i.e. the idea that changes in ages at access to retirement do not only affect retirement stricto sensu but also general labor market behavior ahead of this retirement age. The message that emerges from all this literature is that of a relative convergence between ex post and ex ante evaluations: pension reforms and associated changes in financial incentives seem to affect retirement behavior in a way that is roughly consistent with assumptions postulated by ex ante projection models, even if some uncertainty remains about how far retirement ages can be expected to go on increasing over the next decades. The present paper is an addition to this literature. It essentially consists in an actualization of messages on implicit labor taxation that had been set forth by Blanchet and Pelé (1999): how did this implicit taxation change from the mid 1980s to the current period, and is this change in line with the U-shaped profile of employment rates that was shown on figure 1? The indicator is a pure financial indicator. It does not account of all other components that may affect individual decisions to retire: health, working conditions, etc. It thus provides a partial understanding of the retirement process, a point upon which we will reinsist in our final conclusion.
The paper will be organized as follows. Section II will first detail the main changes that affected French pension legislation since the mid 80’s. Section III will focus on the main methodological choices that have been retained for the study. Section IV will present results for the case of private sector workers: this will be done in two steps, first a focus on
4
incentive properties of the normal pension system, then an examination of additional incentives provided by other routes. Section V will then offer a brief examination of how incentives have changed for people working in the public sector. Section VII will conclude.
II. THE CONTEXT: A BRIEF OVERVIEW OF THE FRENCH SYSTEM AND ITS REFORMS
We document in this section the numerous reforms that have affected pension arrangements and other schemes, like early retirement or unemployment benefits, in France, over the last decades
II.1. Pension reforms
Before presenting how pension rules and their reforms have shaped retirement behavior, a few words are required on the general organization of the French pension system. The core of this pension system is the Régime général (general regime) providing a first pillar pension to all wage earners from the private sector. This pension scheme covers wages up to the social security ceiling, whose level is roughly equivalent to the mean wage. The general principle of this general regime is to deliver a pension that is proportional to the number Nrg of years of contribution to the regime and to a reference wage Wref which is an
average of wages received during the D best years of one’s career, after truncation to a ceiling, the “social security ceiling”, roughly equivalent to the average wage level.
This system entitles workers at most with a replacement rate equal to 50% of their reference wage. People who get this level are considered to have the so-called “full rate”. This replacement rate thus remains rather low, and all the more so for people whose careers have ended well above the social security ceiling. Two complementary schemes provide additional pensions that raise replacement rates above this 50% or less ratio, respectively the AGIRC (Association Générale des Institutions de Retraite des Cadres), dedicated to upper-skilled wage earners, and the ARRCO (Association des Régimes de Retraite Complémentaires) for all other categories of private sector wage earners. These two schemes share a common principle: the pension they deliver is not based on the length of people’s careers but on the number of points that they have accumulated all over these careers through their contributions. The two basic parameters are therefore the purchasing price of these points, which determines how many points are bought a given year with contributions, and the service value of these points which determines the amount of pension that one derives from one’s cumulated account of points.
5
An equivalent two pillar structure exists for self-employed people, with first pillar pensions fully aligned on rules of the general regime, and complementary pensions provided by a multiplicity of different regimes.
The last main segment of the French system is the one that applies to public sector employees, who benefit from a single pillar pension covering all their wages, without any reference to the social security ceiling, but excluding bonuses. As it is the case in the general regime, the pension is proportional to the length of people’s career, but the reference wage is not an average of past wages, it is equal to people’s last wages or, more precisely, the wage they had over the last six months of their careers. These rules apply to the three categories of civil servants that exist in France: those employed by the central State, those employed by local authorities, and those working in the public health sector. Similar rules also apply to people who are not civil servants but work in large public or formerly public firms who have generally kept separate specific regimes (régimes spéciaux). A distinct feature of all these schemes is also the fact of allowing retirement much before 60, at 55 and sometimes still less for some specific subcategories of workers such as members of armed forces, policemen, railway conductors...
We shall focus here on the reforms of the general regime and of the public sector pension scheme as their rules structure pension entitlements for a large majority of the population. The major reforms took place in 1983, 1993, 2003, 2010 and 2014 and are described in table 1.
Until the 1980s, all pension reforms in France aimed at increasing benefit levels and favoring early retirement. Then, starting in the 1990s, the French pension system underwent a series of new reforms going in the opposite direction, reducing benefits or increasing ages at benefit claiming.
The last significant reform increasing generosity is the one that occurred in 1983. This reform is known as having lowered the normal retirement age (NRA) from 65 to 60. It however did so in a way that deserves precise explanations. Before 1983, the normal retirement age for private sector employees was 65. Retiring earlier was possible, as the early retirement age (ERA) was already equal to 60, but with a very strong penalty lowering the replacement rate by 5% percentage point per year of anticipation, i.e. for instance a 10% reduction of one’s pension level if retiring at 64 rather than 65, and a replacement rate of 25% only if retiring at 60 instead of 65. The novelty of the 1983 reform has been to withdraw this penalty, but not in a fully unconditional way: a length-of-career condition was introduced, this condition being to have reached at least 37.5 years of contribution. Given that most male workers were fulfilling this condition (but not all female workers), it de facto offered to them full-rate benefits at the ERA, hence closing the practical gap between the early and normal retirement ages. Yet the two notions remained distinct, and people not reaching the 37.5 years condition remained exposed to the 10% penalty per year missing to reach either this condition or the age of 65. In other words, the reform did not
6
consist in fully lowering the NRA to 60. It did so only for one part of the population, with the side consequence of having complexified the structure of French pension rules, where three rather than two pivotal ages now coexist: the ERA, still equal to 60, an “SEA” (Statutory eligibility age) of 65 systematically entitling to a full rate pension whatever the length of one’s career, and the intermediate FRA (Full rate age) which is no more an age stricto sensu as it basically corresponds to a length-of-career condition.
The 1993 reform started reverting the trend toward more generous pensions. It did so for private sector workers only, in two ways. The first instrument has been the reduction of pension levels at the full rate: instead of being computed on the 10 best years of one’s career as it used to be for people born until 1933, the average of past earnings that enters the benefit formula started being progressively computed over a longer period, up to 25 years for people born 1948 or after. This change has been coupled with the application of a less generous revalorization rule for these past earnings, reevaluation according to past wage growth being replaced by reevaluation based on past inflation only. The second instrument has been a strengthening of the conditions required to get the full pension: it has been progressively increased from 37.5 to 40 years by one quarter each year from cohort 1933 to cohort 1943, with the expected effect of re-increasing the number of people unable to get a full rate pension at the ERA, hence reopening the gap between the ERA and the FRA.
The 2003 reform extended the 1993 reform in several directions. First in the direction of public sector employees. For them, the condition for a full rate pension had remained at its pre-1993 value of 37.5 years of contribution, and they only incurred a small penalty for retiring before this full rate, the one automatically resulting from the proportionality between the pension level and the number of years of contribution. As a first step, the 2003 reform changed this length-of-career condition for these public sector employees, raising it to 40 years, and it introduced a penalty of -5% per missing year of contribution. The penalty applying to private sector employees was symmetrically aligned on this new value of 5% as its initial level of 10% was much stronger than requested for actuarial neutrality. The condition for obtaining the full-rate was then made more stringent for both categories of workers: starting 2008, it has been increased from 40 to 41.5 years and the reform introduced a mechanism linking further increases of this parameter to changes in life expectancy. Symmetrically to the move toward actuarial and homogenous penalization of early exits, the reform also introduced a new bonus for years of postponement beyond the full rate, initially equal to 3% and then further increased to 5% per year of postponement.
7 Table 1: Main rules in the general regime and public sector employees, before
and after reforms
General regime Public sector employees
Before the 1993 reform
1993
reform 2003 reform 2010 reform 2014 reform
Before the 2003 reform 2003 reform 2010 and 2014 refoms First age at which retirement is possible 60 No change Increased to 62 years between cohorts 1951 and 1956 No change 55 or 60 years, depending on categories No change Similar to the general regime Full rate condition 60 or more with at least N*=37.5 years of contribution, or 65 without any condition on Ntot Duration condition raised from 37.5 years to 40 years (in 2003) Duration condition raised to 41 (between 2008 and 2012), and to be increa- sed to 41.75 years in 2020, then indexed on life expectancy. No change on the duration condition. Shift to 67 or the unconditional
full rate age
Duration condition raised to 43 (for cohort 1973) 37.5 years Duration condition raised to 41 (in 2008), then moving as in the general regime Pension level at the full rate
If N= 37.5, 50% of the average of wages, truncated to the SS ceiling, over the 10 best years of one’s career. If N<37.5, this amount is prorated. The period over which past wages are averaged is increased from 10 to 25 years (by one year per year
between cohorts 1933
and 1948).
No change 75% of the last
wage No change Penalty for retirement before the NRA Prorating effect plus a reduction of 10% for each missing year No change Additional reduction reduced to 5% per missing year
No change Only the
prorating effect Prorating effect plus a reduction of 5% for each missing year Bonification for retirement after the NRA
None No change 3% for each year of post-ponement, increased to 5% in 2005 No change None 3% for each year of postponement, increased to 5% in 2005
8
The 2003 reform also led to revise one important aspect of the French employment legislation, otherwise the implementation of bonuses for postponing beyond the full rate would have remained purely theoretical. Until the 2003 reform, the full rate age corresponded to the normal end of the contract between the employer and the employee. A separation occurring before this age at the initiative of the employer was a lay-off, with associated obligations for the employer: need of an administrative authorization, payment of dismissal indemnities, risk of contestation of this dismissal in professional courts. No such obligation existed once the full rate attained: the employer could legally request the employee to claim for his pension benefits, without any further obligations vis-à-vis this employee. The FRA therefore corresponded to a de facto mandatory retirement age, not in the sense that it was illegal to work beyond that age, but in the sense that most wage earners in the private sector had no real choice to work later than this age. The 2003 reform suppressed this disposition of the French employment legislation, reintroducing a clear distinction between the FRA and the mandatory retirement age. The latter was first fixed to 65, then raised to 70 in 2009.
Last and opposite to the general trend toward later retirement, the 2003 reform opened new derogatory possibilities for early retirement through the pension scheme itself (and not through separate early retirement schemes), under the label of “carrières longues”, but limited to a very targeted population: workers who had started working (and contributing) very early, at ages 14, 15 or 16. These workers were offered the possibility to retire with the full-rate as soon as 56, 57 or 58, depending on additional conditions on contribution length.
This 2003 reform had however still left aside some specific categories of public sector employees, those of large public firms benefiting from “special schemes” (railways, public transportation, gas and electricity...). These schemes have been aligned on common rules in 2007 (contribution length, penalty for early retirement, etc.) even if pay compensation had to be offered to soothe opposition to this change.
The 2010 reform then affected all categories of workers, both from the public and private sector. It consisted in an increase in the ERA and in the SEA. Put in other words, it shifted the age bracket within which people are expected to choose their retirement age, from 60-65 to 62-67. For public sector workers who still benefited from different reference ages (i.e. policemen, prison officers or nurses), the increase was similar, with the ERA shifted from 55 to 57 and the SEA from 60 to 62.
In 2014, a last pension reform was introduced, which strengthened again the condition for full-rate benefits, increased from 41.5 years to 43 years. At the same time, the “carriers longues” rule was extended to include workers having started working before age 20, allowing some of them to also retire before at 60, before the new ERA of 62.
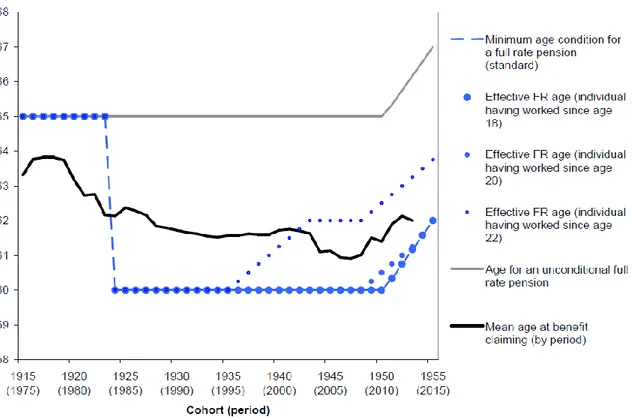
Figure 2 tries to summarize the most salient of all these changes with time series profiles of representative eligibility or effective retirement ages for private sector employees. The
9
age required for getting an “unconditional” full rate pension has been equal to 65 over most of the period and has been increased to 67 years by the 2010 reform. Ages for accessing the full rate have had an evolution that depends upon the N of years of contribution, here converted into a condition upon age at entry into the labor force, assuming uninterrupted careers afterwards, with three values for this age at entry : 18, 20 and 22. We see here the potential for an explanation of the “U” shaped profile of labor force participation over time, with a drop of this age from 65 to 60 for all these three cases in 1983, then a reincrease due to the succession of reforms, initially affecting people having started working relatively late, but spreading to the other cases at the end of the period, due in particular to the increase to 62 of the minimum age. The last line in black on the graph shows how effective retirement behavior have resulted from a mix of these changing conditions and also of other derogatory rules not reported on the graph. For instance, before 1984, the effective age at benefit claiming was already much lower than 65 as several possibilities existed to leave with a full rate before this age. Then, over the recent period, the incentive effect of the 2003, 2010 and 2014 reform has been dampened by the derogatory possibilities offered by the “long career” system.
10 II.2. Other schemes: early retirement schemes, unemployment, disability
To understand the trends in older workers’ labor market participation, the description of the normal retirement pathway must be completed by a description of the possibilities offered by other exit routes. Three main pathways can be distinguished: (a) early retirement schemes (“préretraites”) i.e. state-sponsored schemes offering transitory benefits before access to normal retirement, (b) unemployment insurance and (c) the invalidity/disability route.
Since this latter route is relatively marginal in the French case, we limit ourselves to a very brief description of its characteristics. Before the ERA, the pension d’invalidité is for individuals with a disability rate over 2/3. Workers can also be on long-term sickness leaves. After the ERA, people may be eligible to the pension d’inaptitude for a disability rate over ½. These people are treated as full rate pensioners even if they do not fulfill conditions for the full rate. No significant reform of this system took place during the period under study.
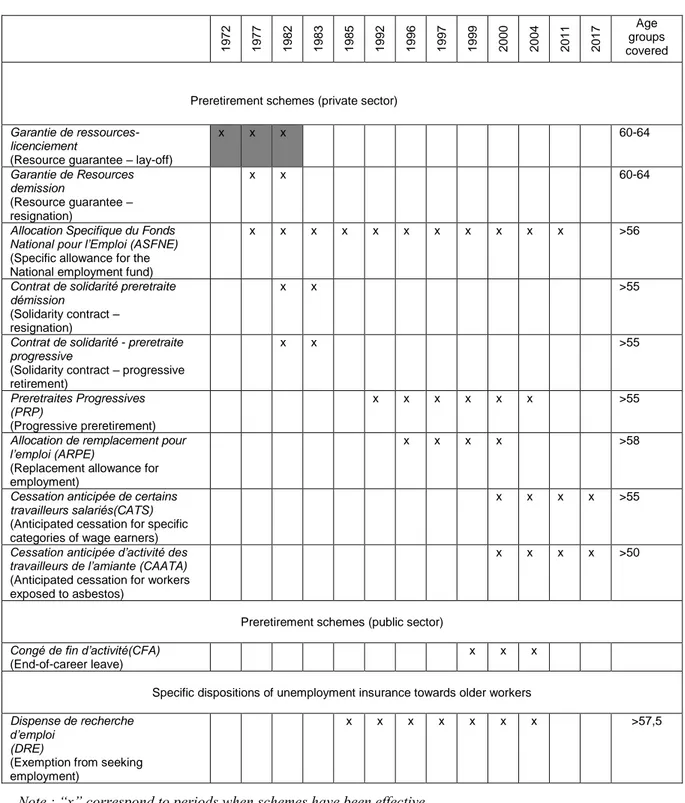
Early retirement schemes and unemployment insurance have played a more important role during the period under review. Their main features over the last decades are given in Table 2. This table shows that early retirement schemes were developed first, initially targeted toward the 60-64 age group and very specific sectors, under the name of garantie de ressources. The first of these early retirement schemes were introduced in the early 1970s. During this first stage, early retirement was considered as exceptional. However, in the face of declining labor demand and rising unemployment, the program was extended on a larger scale. The garantie de ressources initially limited to lay-offs in 1972 was extended in 1977 to people having voluntarily left their job (“Garantie de Ressources Démission”, GRD). The replacement rate was 70% of the previous gross wage, thus higher than a full rate pension on the regime general (not considering complementary schemes).
At the same period was created the Allocation Spécifique du Fonds National pour l’Emploi (ASFNE), whose eligibility was extended in the 80’s to wage earners older than 55, altogether with the creation of the CSPRD (“Contrat de Solidarité préretraite démission”), a scheme that offered a replacement rate of 70% to wage earners with more than 10 years of contribution who had resigned, hence similar to the GRD. This CSPRD scheme remained however relatively short lived, closed in 1983, this being also the case for the associated “Contrat de solidarité préretraite progressive”, a scheme allowing “part time preretirement”. In the meantime, the normal retirement age had been decreased to 60 in 1983, and, with this decrease, early retirement schemes were planned to lose importance. Yet this took place only progressively. The Garantie de Ressources was gradually suppressed and the ASFNE was first restricted to wage earners older than 57 in 1994, before being definitely suppressed only in 2011.
11
Table 2: Main characteristics of anticipated retirement schemes developed since 1972.
1972 1977 1982 1983 1985 1992 1996 1997 1999 2000 2004 2011 2017
Age groups covered
Preretirement schemes (private sector)
Garantie de ressources-licenciement
(Resource guarantee – lay-off)
x x x 60-64 Garantie de Resources demission (Resource guarantee – resignation) x x 60-64
Allocation Specifique du Fonds National pour l’Emploi (ASFNE)
(Specific allowance for the National employment fund)
x x x x x x x x x x x >56
Contrat de solidarité preretraite démission
(Solidarity contract – resignation)
x x >55
Contrat de solidarité - preretraite progressive
(Solidarity contract – progressive retirement) x x >55 Preretraites Progressives (PRP) (Progressive preretirement) x x x x x x >55
Allocation de remplacement pour l’emploi (ARPE)
(Replacement allowance for employment)
x x x x >58
Cessation anticipée de certains travailleurs salariés(CATS)
(Anticipated cessation for specific categories of wage earners)
x x x x >55
Cessation anticipée d’activité des travailleurs de l’amiante (CAATA)
(Anticipated cessation for workers exposed to asbestos)
x x x x >50
Preretirement schemes (public sector)
Congé de fin d’activité(CFA)
(End-of-career leave)
x x x
Specific dispositions of unemployment insurance towards older workers
Dispense de recherche d’emploi
(DRE)
(Exemption from seeking employment)
x x x x x x x >57,5
Note : “x” correspond to periods when schemes have been effective. Source: updated from Burricand and Roth, 2000
12
Some new alternative schemes were created in compensation, but more specifically targeted: the Allocation de remplacement pour l’emploi (ARPE) and the Congé de fin d’activité (CFA) schemes created in the mid-1990s were targeted to wage earners older than 58, respectively in the private and the public sector. Employers using the ARPE had to replace early retirees by younger workers under age 26. Both were then suppressed in 2003 and replaced by two new and still more focused schemes, the CATS and the CAATA, the first one targeted to workers who had had especially hard work conditions (at least 15 years on assembly line or with night work), and the CAATA scheme for workers exposed to asbestos.
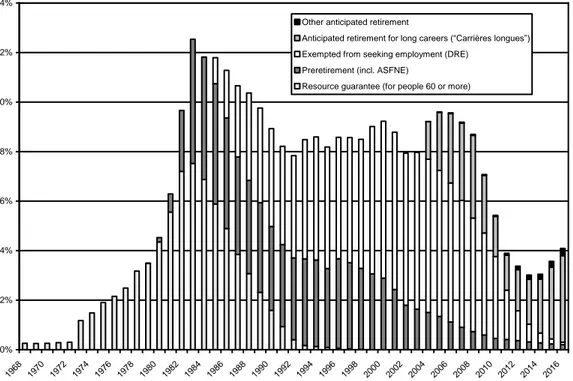
The resulting expansion and contraction of numbers in pre-retirement for the 60-64 and 55-59 age groups can be observed in Figure 3. The total stock of people benefiting from this Garantie de ressources grew up rapidly from 1974 to 1983, where it amounted to about 7% of the 55-64 population and this growth explains the strong decline in employment rates between ages 60 and 64 that was shown in Figure 1. This also explains why the introduction of retirement at age 60, in 1983, did not show up in this Figure 1 in the form of a sudden drop of employment rates in the 60-64 age bracket: to a large extent, this reform essentially consisted in a transformation of pre-retired people into “normal” retirees. The stock of these Garanties de ressources then mechanically declined during the first half of the 1980s.
Figure 3: Population in pre-retirement schemes (in % of total 55-64 population)
Source: DARES, Tableau de bord de l’activité des seniors et des politiques d’emploi (2017)
0% 2% 4% 6% 8% 10% 12% 14% 1968 1970 1972 1974 1976 1978 1980 1982 1984 1986 1988 1990 1992 1994 1996 1998 2000 2002 2004 2006 2008 2010 2012 2014 2016
Other anticipated retirement
Anticipated retirement for long careers (“Carrières longues”) Exempted from seeking employment (DRE)
Preretirement (incl. ASFNE)
13
This drop in the Garantie de resources was initially compensated by the expansion of the ASFNE and of other schemes applying to people in the 55-59 age bracket. But this expansion stopped in the mid-1990s, and these schemes have now almost disappeared, leaving room in turn to two other routes, also represented on Figure 3. The first one is the unemployment insurance route. This essentially took place through the creation of the DRE (“Dispense de recherche d’emploi”) that was introduced in 1984. In the 1990s, DREs became numerically more important than early-retirees. The system consists in exempting unemployed people from active job search past a certain age, 55 at its creation. There were many changes, mostly decreases, in the eligibility age between 1984 and 2009 before a gradual increase to reach 60 in 2011. The DRE program was suppressed in 2012. The DRE did not give additional unemployment benefits; yet, combined with the possibility to keep full unemployment benefits without any degressivity until being entitled to a full rate pension, DRE have de facto acted as an early retirement scheme.
What ultimately took over after the suppression of the DREs has been the development of the Carrières longues system already described earlier which lies somewhat in between early retirement and normal retirement: it is part of the normal retirement system, but with very strong selectivity rules targeted to people having started contribution very early. To sum up, the development of specific rules for older unemployed people in the national system of unemployment insurance and in early retirement scheme seems to explain a large part of the decline in employment rates in the 55-59 age brackets that occurred during the early 80s. It was then followed by a period combining tighter regulation of these routes, sometimes compensated by the creation of new ones, but generally more focused. Until the early 2000s, the impact of all these policies has just been to maintain a relative status quo in terms of numbers of beneficiaries. All this period corresponds to the bottom part of the U-shaped profile of labor force participation for men aged 55 to 59 that was shown on figure 1. The situation reversed much more significantly during the 2000s. First with the progressive extinction of early retirement schemes of which only two very limited forms still subsist, second with the extinction of the DREs, definitely suppressed in 2011, with a stock of beneficiaries progressively declining to zero. The resulting downward trend has been for some time compensated by the development of the Carrières longues system, but this has not been enough to offset the other changes.
III. KEY COMPONENTS OF THE BENEFIT CALCULATOR
After this first inventory of how social security rules have changed in France since the early 1980s, the rest of the paper will be devoted to translating these rules into the common formalism of financial incentives to retire, to allow comparison with other countries. Several measures of these incentives to retire have been proposed in the literature. We
14
focus here on the so-called « tax rate » that implicitly applies to wages if one decides to postpone retirement by one year: it computes by how much discounted Social security wealth (SSW) is reduced or eventually increased when choosing to work one year longer, expressed in percentage of the current wage, social security wealth being defined as the discounted sum of pension benefits over one’s expected retirement period. This indicator is a pure financial indicator. It does not account of all other components that may be determinant for individual choice to retire: health, working conditions, etc.
Computing these tax rates requires several conventional choices and inputs. Conventional choices are necessary to define what kind of decision is going to be modelled, and for whom. Inputs will consist in data necessary to feed the pension simulator, essentially career profiles, but also survival probabilities for the computation of cumulated benefits and weights to be applied to the various exit routes.
III.1. Basic conventional choices
Retirement behavior has two dimensions that ideally deserve separate modelling: one is benefit claiming, the other is exit from employment. The two decisions fully coincide for people directly moving from their last paid job into full retirement. In practice, benefit claiming can occur after or before this exit from the labor force. In France however, despite increasing possibilities to combine paid activity with the perception of pension benefits, working after having claimed for one’s benefits remains a relatively marginal phenomenon that will not be addressed here. On the other hand, the end of people’s paid careers very often occurs well before their access to normal retirement. In 2012, only two people over three were still employed when claiming for their pension benefits (Govillot, 2013). This discrepancy generally results from temporary transitions through one of the various alternative early routes that have been described above: early retirement benefits, unemployment insurance benefits or disability benefits.
To deal with these alternative routes, we model the fact of definitely leaving the labor force, whatever the chosen route k, rather than the fact of claiming for normal pension benefits. At a given age a and for a given route k, two cases will have to be considered.
The first one is when this route is already opened at age a. In this case, the computation is straightforward, the SSW accrual combines the negative effect of foregoing one year of benefits -a “perception duration effect”-, and the fact that, in case of postponement, the level of this benefit is likely to be higher –a “benefit level effect”. In the plausible case where the first effect dominates, the route under consideration will create an incentive to withdraw: in other terms, to this route is associated an implicit taxation of labor.
15
But we have also to compute the incentive properties of routes that are not yet opened to the individual. Let’s consider for instance an individual who has not reached the ERA associated to the normal retirement system. For this person, leaving the labor force with the plan to benefit later from this normal route is an option: the choice is between doing so at the current age a and wait until the ERA to claim for SS benefits, or work one more year, generally implying higher entitlements but for a retirement period that will also start at the ERA, i.e. of exactly the same length. As a result, we expect to measure for this person a positive incentive to remain at work, or equivalently a negative implicit taxation of labor (a subsidy). After that, if this person is still at work when reaching the ERA, we will turn again at this age to a computation that will combine the negative effect of receiving the benefit for one year less, and the increment to the level of the benefit resulting from a longer career.
This convention for computing incentives before the eligibility age ignores what is certainly the strongest determinant of staying at work until the ERA for those who do not benefit from any other early retirement possibility: the loss of wage incomes and the fact of having to wait until the ERA without any resources. Ignoring this dimension is the consequence of focusing only on the SSW side of the problem. But this convention at least provides us with implicit tax rates at all ages for all potential routes, both those already available and those that will be available only later.
Having computed the SSW for each pathway, what remains to be done is to weight these incentives. We do it conventionally using the observed shares of all these routes in global yearly exit flows, even though these probabilities are likely to be endogenous: these probabilities are equilibrium values combining the degree to which these routes are accessible to workers and their choices to make use of these routes
The next conventional choice for simulations is to define to whom these computations will be applied. We distinguish three skill levels, corresponding to low medium and high levels of education and consider private and public sector workers. Computations will be performed separately for men and women, but without any distinction between single and married persons: it is only personal pensions that are simulated here. Survivor’s pensions in France follow complicated rules, with some of them means tested (those delivered by the regime général) and others not, leading to important threshold effects according to the ratio between wages earned by both spouses. The rules did not undergo significant changes during the period under review; it relativizes the need to have them modelled for explaining behavioral changes. Of course, there could have existed a time-varying interaction between these rules and the narrowing of the wage and career gap between men and women, but
16
these potential interactions are a priori far too complex to be usefully retraced by a limited set of typical cases.
III.2. Earnings histories
Retrospective data on wages is a major component for computations. In France, micro data on wages are available either from the Labor force survey (LFS) or from administrative sources such as the Declarations annuelles de données sociales. We favor the first data source despite a smaller sample size and the lower accuracy of self-reported wage levels as the LFS provides information on the education level, our variable of social stratification. Based on this data set, three variants have been tested for earnings profiles.
- Common synthetic profiles. These profiles use age patterns observed in three countries (Germany, Italy and the US), normalized to 1 at age 50 for each skill and sex group, and converted in national equivalents through multiplication by country and time specific wage levels at this age of 50. Here, the role of the French LFS is only to provide the wage levels observed at each period and at age 50 to rescale these common synthetic profiles to a level corresponding to the French situation. These common synthetic profiles will be used in the baseline simulations presented in section IV.
- Country-specific but time independent profiles. We use profiles by age estimated in 2016 using the LFS data and then, as for common synthetic profiles, we rescale them to the observed levels, at each period, at age 50.
- Country and time specific profiles. The profiles are fully derived each year form successive labour force surveys, differentiated according to gender and education levels.
These three sets of profiles are presented by gender and education levels in figures 4 and 5. In the three cases, the method applies only from 1982, first year for which wage data are available in the LFS. Wage levels are also required for earlier periods. For instance, people retiring at 65 in 1980 had started their careers up to 50 years before, i.e. in 1930. Up to 1945 back projection is possible based on average wages provided by National Accounts. For periods that are still more remote, a conventional evolution of 2% per year is applied, with limited practical incidence as the reference wage uses, to be computed, on only a short subperiod of these peoples’ careers, generally located in the middle or second half of the careers.
17 Figure 4: Wage profiles, men.
Common Synthetic profiles
Country-specific but time-independent profiles
18 Figure 5: Wage profiles, women.
Common Synthetic profiles
Country-specific but time-independent profiles
19
Differences appear between the common synthetic profiles and the French profiles, mostly for high school graduates. For the synthetic profile, the increase is steep at the beginning of the period and the wage evolution is quite flat from 30 to the end of the career. We note a small decrease at the end for the men in the lower education group. As far as French profiles are concerned, the increase is smaller at younger ages, but wage profiles are rising during the whole career.
III.3 Survival probabilities and pathways
Concerning survival probabilities, as for wages, we have one “common” specification shared by all countries, used for our baseline’s simulation.
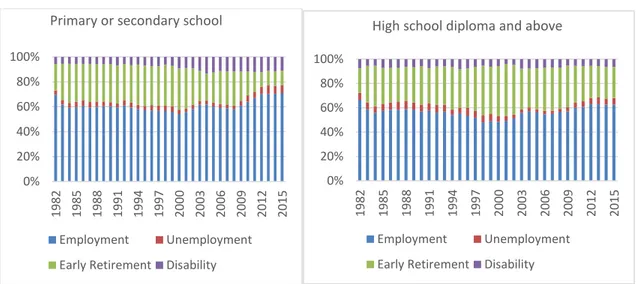
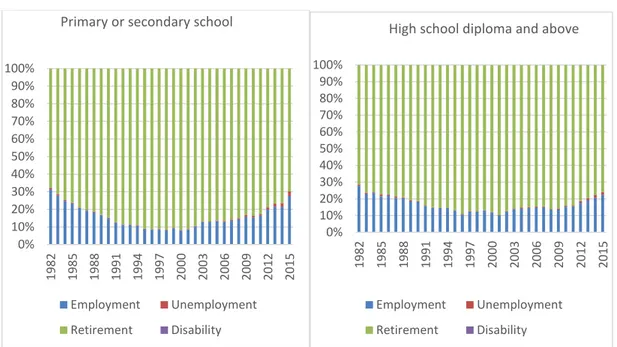
For alternative pathways, we regroup them into the four main categories described in section II: normal retirement, early retirement, unemployment and invalidity. Information on access to these pathways by gender and education is provided mostly by the French LFS completed by the SIP survey (Santé et Itinéraire Professionnel, i.e. Health and Labor Market history) for disability.1 Due to the small share for some exit routes for high educated people, we compute the weights only for two education groups, considering as a whole high school diploma and above. Relative weights are presented in appendix A. For men and women aged between 55 and 59 we observe a decrease in the probability to be either in early retirement, unemployment or disability over the period. The probability to experiment these pathways is always lower for the higher educated. Note that for women with only primary or secondary school levels, the employment rate, compared to other pathways, is quite low. We have excluded women out of the labor force for family or personal reason and rescaled the probabilities to 1.
Above 59, the employment rate is quite low for every group. Probabilities of unemployment or disability being very low, we observe the same pattern as the in figure 1 for employment and the complementary pattern for retirement.
1This second survey provides current and retrospective information on health and labor market status for 14
000 individuals aged 20 to 74 in 2010. All successive spells in labor market histories and all major health events in individual’s lives are reported. We select a subsample of spells corresponding to the states experienced by the individuals of the sample when aged from 55 to 60 years old and consider the information relative to disability or sickness leave.
20 III.4. Computing incentives, net of taxation and other contributions
With all these elements in hand, it is possible to move to the computation of benefits. More precisely, for a given pathway k and an individual i observed at time t and age R, we compute the sequence of future benefits between ages R and T if she retires at R, Bk,t,a(R,i)
for a=R to T, and then sum them up with discounting and weighting by survival probabilities at each age, to get the associated social security wealth SSWk,t(R,i), hence
the accrual representing by how much this SSW increases (or decreases) in case of postponement by one year. As explained above, if R is lower than the eligibility age for the considered pathway, SSW will cumulate benefits only starting from this eligibility age. The associated accrual writes down:
ACCRk,t(R,i)=SSWk,t+1(R+1,i)-SSWk,t(R,i)
Hence the tax rate
ITAXk,t(R,i) = -ACCk,t(R,i)/Yt+1,i
where Yt+1,i is the wage that this individual will earn next year in case of postponement.
Concerning detailed calculation of pension benefits, they are done according to successive legislations using the code imbedded in the French PensIPP microsimulation model. This computation takes into account taxes or other contributions to which both wages and pensions are submitted, in order to compute a net replacement rate. The general principle of taxation of public pensions in France is that Social Security contributions are fully deductible from income tax, but pension benefits are subject to tax when received. French income tax is based on joint taxation, whereby all incomes earned by a tax unit are added and divided by the number of parts, the number of units composing the tax unit, i.e., 1 for each adult, and 0.5 for each child. In addition to the income tax, pensions can be taxed by other social security contributions, like health care contributions or general flat tax contributions like the Contribution sociale généralisée (CSG) and the Contribution au remboursement de la dette sociale (CRDS). These latter contributions have been increasing since the early 1990s and have led to a reduction in the ratio of gross pension and net pension benefits.
Given the nature of the simulations based here on average earnings at the individual level, we have abstained to model precisely the rules of the joint income tax and preferred to approximate the average change in the taxation of pension by simulating all the other taxes – which have changed most across time. Hence, we compute health care contributions, CSG and CRDS, to obtain net pensions for our different earnings profiles. The change over time in taxation is marked, going from 0% in 1980 to 7.4% in 2015.
21 IV. WAGE EARNERS IN THE PRIVATE SECTOR
IV.1. Incentives provided by the normal retirement route
We start the presentation of the results by focusing on incentives provided by the central route, normal retirement. Even if incentives are formally computed also for ages below the normal ERA, we focus here on the 60-64 age bracket for which they are the most significant. Accruals and associated tax rates for men and women are presented for the three education levels. Level 1 corresponds to primary or secondary school and individuals are assumed to have started working at 16; level 2 is for high school graduates with an entry in the labor market at 20 and level 3 corresponds to individuals having diploma above high school and beginning to work at 25.
The first set of results are based on the common synthetic profiles presented in section III.2.2 Profiles on Figure 6 are qualitatively similar for men and women and will be commented in global terms. We consider indeed women with uninterrupted careers whose paths differ from those of men only in terms of wage levels, not in terms of years of contributions, and it is this latter parameter which is the main determinant of replacement rates.
Profiles for men or women of level 1 read as follows. For these individuals, before the 1983 reform, the retirement route was already opened at 60, but the full rate age was equal to 65, with a strong penalty for earlier departures, of 10% per year of anticipation, higher than requested by actuarial neutrality. This resulted in a strong positive accrual and, formally, a “subsidy” to working at these ages, i.e. a negative tax rate. For these individuals, the 1983 reform fully reversed the pattern. Having started working early, they became entitled to a full rate pension as soon as 60 and, in the absence of any bonus for postponement beyond the full rate age, the only impact of postponing beyond 60 was a negative perception duration effect, i.e. the fact of benefiting from one’s benefits one year less, hence a negative accrual of the same order of magnitude at all ages and an associated positive tax rate, of about 70%, roughly equal by construction to the replacement level. This is the situation that was described in Blanchet and Pelé (1999). It remained so until the 2003 reform that introduced the bonus for postponement beyond the FR age, bringing both the accrual and the tax rate closer to zero but not entirely.
2 Results using the alternative profiles are available upon request, but do not lead to
22 Figure 6: Incentives provided by the normal pension route, 60 to 64
Men level 1 Women level 1
23 Figure 6 (cont) : Incentives provided by the normal pension route, 60 to 64
Men level 3 Women level 3
The situation of zero taxation has been fully achieved only by the 2010 reform, for ages 60 and 61, but not by having brought benefits more in line with the principle of actuarial neutrality. The mechanism has been different and stems from the convention used to compute the tax incentive for people who are below the eligibility age. Let’s consider the case of an individual for whom the minimum age has been shifted to 61. For this individual, leaving the labor force at 60 and claiming for benefits at 61 generates the same stream of future benefits as leaving the labor force at 61. The perception of benefits will start at 61 in both cases. The only impact of working longer should be to accumulate higher entitlements but this impact is marginal as this individual will benefit anyway from the full rate at age 61, having had a sufficiently long career, and because years accumulated in excess of the full rate condition but before 61 are not productive: only the additional years of work beyond the FRA will generate additional entitlements. All this leads to the quasi neutrality of pensions rules at age 60 seen through the lenses of this tax rate indicator, as depicted by the grey line. The same holds true at age 61(red line) for individuals retiring a few years later for whom the minimum age has been shifted to 62.
Of course, this does not mean that the 2010 reform has led to a system that is entirely neutral for retirement behavior at ages 60 and 61, quite the contrary: we know indeed that this reform has led to substantial changes in retirement behavior in the 60-62 age group (Dubois and Koubi, 2017), but this effect is not captured by the tax rate as computed here. The channel has rather been the drop to zero of the replacement rate offered at these ages.
24
What if we shift to the level 2 individuals having started working at age 20? The story is roughly similar, except for the absolute level of the accruals –proportional to past wages and also affected by a higher life expectancy- and also for a much stronger upward movement of the accrual at age 60 at the very end of the period, due to a superposition of the effects of the 2003 and 2010 reforms. As for level 1, the effect of the 2010 reform is to suppress the duration effect of leaving employment at 61 rather than 60. But the 1993 reform adds to this a strong bonus effect as the career length for this individual is now 41 years, no more attained at 60. For this individual, the additional year of work at 60 is therefore not lost in terms of the level of benefits, it avoids a significant penalty when retiring at 61. The combination of the two elements generates a strong subsidy to working at 60, close to the one that existed before 1983.
What at last with the case of the type 3 individual, having started working at only 25? The interpretation of results is less straightforward. The beginning of the story is again the same as for the type 1 individual: a full rate age equal to 65, a strong penalty if leaving before. The absolute level of the accrual is again higher because this individual has higher earnings and is globally entitled to higher pensions with a higher life expectancy. The value of the implicit “subvention rate” is somewhat smaller as pensions, albeit higher in absolute terms, are smaller in proportion to labor income. Yet, globally, patterns are very similar between these two individuals before the 1983 reform. This reform did not strongly affect his incentive to retire at 60 or 61 since, due to his late entry into the labor market, he had to wait until 62.5 to get a full rate pension. It is beyond this age that the initial subsidy is turned into a taxation. But this taxation rapidly shifted to a subsidy again as a consequence of the 1993 reform that rapidly increases the age at which this individual is able to reach the full rate, this effect spreading progressively up to the higher end of the 60-64 age bracket, the move from a taxation to a subsidy being dampened somewhat by the 2003 reform that has reduced the magnitude of the penalty incurred for retiring before the full rate. For this individual, the 2010 reform also had the effect of reinforcing the subsidization of work at ages of 60 and then of 61, but in a way that is less marked than it was for the type 1 and type 2 individuals, due to the subsidization that already existed, for this worker, before this 2010 reform.
IV.2. Alternative routes
All in all, even if the tax rate does not cover all the channels through which reforms have tried to encourage later retirement, the picture is globally in line with the “U” shaped employment pattern that we are expected to explain. Employment rates for the 60-64 have been low when the taxation of labor in this age group was high, during the second half of the 1980 and the 1990, and the turning point more or less coincides with a decline of these tax rates, even if the exact timing of this decline has not been uniform at all ages and for
25
all types of workers. What if we move to the 55-59 age bracket and extend the analysis to other routes?
As mentioned above, it is four routes that are taken into account, in a stylized way. An individual aged between 55 and 59 can choose to leave employment with four options:
• either through the unemployment route or through an early retirement scheme, in these two cases with an eligibility age of 56 and a replacement rate of 60%, • through disability, with an eligibility age of 55 and a replacement rate also equal to
60%,
• or only with the perspective of benefiting later on of a normal pension at the age of 60 before the 2010 reform, then raised to 61 and 62, with the pension offered as these respective ages, but without any other forms of benefits until this age. Incentives associated to each of these routes are computed as for the normal route. For the first three routes, SSW is computed as the discounted sum of associated benefits until the full rate retirement age, continued with normal pension benefits beyond this age. The problem is that these routes are not options available to everyone : benefiting from the disability route is conditional upon suffering from health problems attested by special regulatory commissions, benefiting from an early retirement scheme generally resulted from the application to one’s firm of a “social plan” negotiated between this firm and public authorities, benefiting from unemployment insurance benefits required having been laid-off by one’s employer, which here again is not a free choice made by the employee. The way to account for these limitations is to weight incentives by some probabilities of having access to these routes. It is ex ante probabilities that should have been ideally used, with ex post probabilities resulting both from these ex ante values and from the choice made by individuals to benefit or not from these routes, in response to associated expected benefits. But ex ante probabilities are not observable, and ex post values are used in lieu, despite the endogeneity problem it creates. These probabilities are those that were presented above on figure 4.
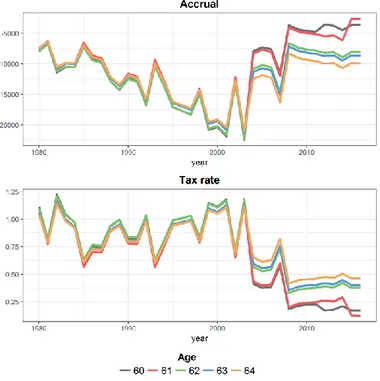
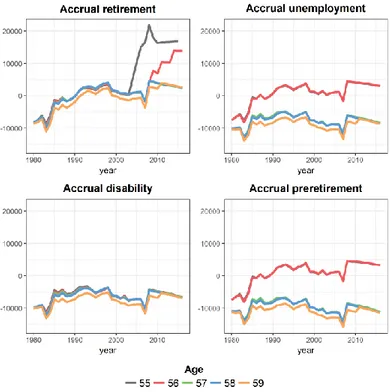
Figure 7 and 8 show the results. They give the profiles of accruals from 55 to 59 for each route taken separately, and their associated aggregate tax rate. Results are given for men only as gender has little influence on results when considering people with continuous careers (results for women are given in Appendix B), and they are given only for the two extreme cases of type 1 and type 3 workers.
26 Figure 7: Accruals 55-59 by pathway and aggregate tax rate (men, educ level 1)
27 Figure 8 : Accruals 55-59 by pathway and aggregate tax rate (men, educ level 3)
28
By construction accruals for the three routes other than normal retirement have relatively simple structures that do not significantly depend upon the category of workers. For the disability route, there is a relatively flat accrual which is about the same irrespective of age. The same applies to unemployment insurance and early retirement benefits, but only starting from 56. At 55, the accrual is close to zero as the expected stream of benefits is the same whether one works one year more before accessing the considered route or whether one immediately stops working and has to wait one full year without resources before entering into the route under consideration. One should note incidentally that such an eventuality is not very realistic, as benefiting from an early retirement benefit or from unemployment insurance must necessarily follow a period of employment. It cannot be deferred to a later period, contrarily to claiming for one’s pension, which can be done at or after the minimum pension age whatever one’s current status on the labor market.
Anyway, the main message from figures 7 and 8 is that it is essentially incentives associated to the normal route that are able to make the difference, however distant the perspective of a simple normal retirement can be in this 55-59 age bracket. For the type 1 individual, the general message is that of a zero accrual –no perception duration effect and no bonus effect. The reason is that, at the beginning of the period, the individual has accumulated a sufficient number of years of contributions to benefit from a full rate pension at 60, whatever his participation profile between 55 and 59. It is only at the end of the period that access to a full rate pension at 60 starts being dependent upon this participation profile, once the individual starts being hit by the progressive impact of the 1993 and 2003 reforms. For the type 3 individual, on the opposite, it is immediately that the individual has an incentive not to stop at 55 or later, since additional years of work are systematically productive in terms of access to the full rate at 60. This incentive paradoxically disappears at the end of the period, but this is due to the fact that, at this point, the level of the pension at the minimum age is no more determined by the length of career condition, but only by the distance to the Statutory eligibility age: this individual will suffer the same penalty irrespective of how he worked between 55 and 59.
Due to both the dominance of the normal route and the fact that it is this route that displays variable characteristics over time, the features of this route basically determine the profile of the aggregate tax rate displayed on the bottom of figures 7 and 8.
IV.3. Synthesis
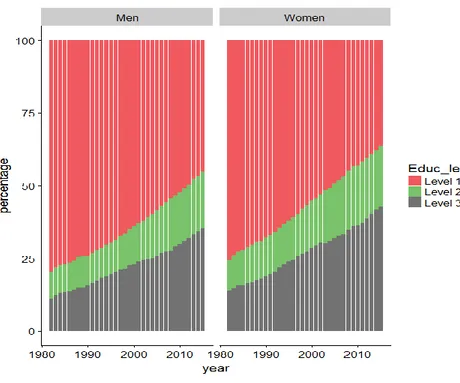
To summarize previous results, we then further aggregate tax rates over five-year age groups and education levels, using the shares of each education level given on figure 9. We now reintroduce both men and women in the analysis, and directly plot observed
29
employment rates in the two aggregate age groups as functions of these tax rates. The expected correlation is negative: a higher average tax rate is expected to lead to lower employment levels.
Figure 9: Share of education level, by year and gender
Source: French Labor Force Survey
Figures 10 and 11 confirm the presence of such a negative correlation, albeit with some irregularities, probably stemming from the fact that, as mentioned above, tax rates only capture one component of the incentive to stay in the labor force, those resulting from deviations from marginal actuarial neutrality, i.e. the fact of having a social security wealth that varies with the age at exit from the labor force. This is not enough to characterize the way pension rules affect retirement decision. Two distinct systems may be both perfectly neutral, but with one offering low replacement rates and the other high ones: the former will clearly generate later departures than the second one.
30 Figure 10: Relationship between tax rate and labor force participation (men)
Ages 55-59 Ages 60-64
Figure 11 : Relationship between tax rate and labor force participation (women)
31
The reform process in France also changed this parameter. The move closer to actuarial neutrality around the normal retirement age has been the distinctive feature of the 2003 reform but, in itself, it was not expected to be a major driving force for increasing retirement ages. Everything else equal, it even opened the possibility to leave earlier that before, by reducing the penalty for departures before the full rate in the private sector which, until 2003, were more penalized that requested by actuarial neutrality. It is also and maybe mainly through shifts in FRA conditions that reforms have been the most effective in modifying retirement behavior.
V. WAGE EARNERS IN THE PUBLIC SECTOR
This last section moves on with some results concerning retirement incentives for public sector workers. Here the analysis will be limited to incentives in the 60-64 age group. Some specific categories of public sector employees are entitled to retirement at much earlier ages, for instance people belonging to armed forces, policemen or railway conductors. Such was also the case at the beginning of the period for primary school teachers. But these specific categories will be here left aside. For other wage earners in the public sector, the minimum age has followed the same rules as in the private sector, i.e. 60 until the 2010 reform, then moved up to 61 and then 62. And, for these people, except for the invalidity route that will be neglected here, direct transition from employment to retirement is the general rule without the need of alternative transition routes, as these workers are not exposed to the risk of losing their jobs.
Other differences with private sector employees have been presented above and we briefly recall the main ones. Already before the 1983 reform, these public sector employees only incurred a small penalty for retiring before the full rate age, at 65. This remained true after this reform, with the new full rate age determined by the alternative condition on age or number of years of contribution and, as for private sector employees, no additional benefit delivered in case of postponement beyond that age. The other difference with private sector employees, until 2003, was the length of career condition kept equal to 37.5 years. It is only in 2003 that rules started to evolve for public sector employees, with an almost complete convergence with the private sector: the condition on the number of years raised to 40, then evolving in line for both sectors, the introduction of a penalty for retiring before the full rate, and the introduction of a bonification for retiring after. The 2010 reform, at last, impacted the minimum age in the same terms in both sectors.
Figures 13 to 15 present the accruals for the same three “typical” workers. Results are presented for men only, being here again similar for both genders. For type 1 and type 2 workers, the tax rate is close to 100% at all ages until 2003. These people are entitled to the full rate as soon as 60, without any bonification if retiring later, so that the “length of
32
perception” effect dominates: foregoing one full year of benefits is equivalent to a taxation at a rate that is roughly equivalent to the net replacement rate.
Figure 13: Accruals 60-64, public sector (men, educ level 1)
33 Figure 15: Accruals 60-64 , public sector (men, educ level 3)
The situation is different for the type 3 individual. This person had to wait until 62.5 to get his or her full rate pension. Despite the fact that no penalty existed on the “annuity rate”, working at 60 and 61 is productive in terms of retirement benefits due to the simple proportionality between the level of the pension and the number of years of contribution, hence a lower tax rate at these two ages all over the period.
The 2003 reform affected incentives in relatively similar ways for the three levels, progressively bringing tax rates close to zero. The 2010 reform finally produced similar effects to those already commented for workers in the private sector. It left the taxation rate close to zero at 60 and 61 for case 1: after the reform, additional years of work between 60 and 62 are not productive in terms of pension benefit and working or not working between 60 and 62 is also neutral for the length of perception, which will start at 62 in all cases. For the type 2 worker, we have the same neutrality with respect to the length of the perception period but, now, years worked between 60 and 62 do have an impact on the level of benefits: this person reaches the age of 60 with a number of years of contribution lower than the one needed get the full rate at 62, hence with a motivation to accumulate some more years of contribution.
The type 3 worker is not affected. Due to his or her very late entry on the labor market, the penalty when retiring at 62 will be based on the distance to the statutory eligibility age of
34
67, rather than on the distance to the number of years requested for the full rate. This penalty is therefore independent upon labor market behavior at age 60 and 61.
VI. CONCLUSION
What is to be retained from this presentation? It has focused on monetary incentives to retire or not to retire, and only on one of these monetary incentives, the so-called “tax rate” which had already been the focus of the first volume of the NBER ISS project in 1999. This tax rate measures by how much the expected flow of benefits changes in case of working one more year, as a result of two opposite effects: a negative “length of perception” effect, since postponing generally implies foregoing one full year of benefits, and a positive “benefit level” effect, since postponing generally leads to a higher benefit level. Actuarial neutrality is reached when both effects cancel out. Examination of this indicator in the 1990s had emphasized the high level of this tax rate for France, at least for workers reaching the full rate as soon as 60. The essential explanation for this high tax rate was the fact that, under rules that existed at that time, postponement beyond the full rate did not lead to any increase in the pension level. This was an assumed consequence of the 1983 reform according to which the full rate age had to be considered as a social norm in terms of retirement, beyond which working did not have to be encouraged and even had to be discouraged, with the idea that this policy could improve accession to the labor market for younger cohorts (Ben Salem et al., 2010).
Removing this implicit taxation has been one of the components of the reforms that have followed, more particularly the 2003 reform that has reintroduced bonuses for years worked beyond the full rate, and simultaneously adjusted the penalty for retiring earlier than the full rate. This penalty has been reduced in the private sector where it was higher than requested for actuarial neutrality and reinforced in the public sector where it was previously almost nonexistent. The main message from this paper is that this 2003 reform was successful in removing a large part of this taxation effect, yet with a lot of exceptions stemming from the complexity of the French pension rules which include a lot of non-linearities or threshold effects (Briard and Mahfouz, 2011). In particular, additional years worked before the minimum age are not systematically productive in terms of additional entitlements, and, once reached this minimum age, the penalty does not systematically depend upon the number of years of contribution: for people with very short careers, it is the distance to the maximum retirement age that is the determinant of the penalty. The subtlety of these interactions between the “length of career” and “age” effects remains an important feature of the French pension system.