HAL Id: hal-01987290
https://hal.archives-ouvertes.fr/hal-01987290
Submitted on 21 Jan 2019HAL is a multi-disciplinary open access
archive for the deposit and dissemination of sci-entific research documents, whether they are pub-lished or not. The documents may come from teaching and research institutions in France or abroad, or from public or private research centers.
L’archive ouverte pluridisciplinaire HAL, est destinée au dépôt et à la diffusion de documents scientifiques de niveau recherche, publiés ou non, émanant des établissements d’enseignement et de recherche français ou étrangers, des laboratoires publics ou privés.
Tracking Ionic Rearrangements and Interpreting
Dynamic Volumetric Changes in Two-Dimensional Metal
Carbide Supercapacitors: A Molecular Dynamics
Simulation Study
Kui Xu, Zifeng Lin, Céline Merlet, Pierre-Louis Taberna, Ling Miao, Jianjun
Jiang, Patrice Simon
To cite this version:
Kui Xu, Zifeng Lin, Céline Merlet, Pierre-Louis Taberna, Ling Miao, et al.. Tracking Ionic Rearrange-ments and Interpreting Dynamic Volumetric Changes in Two-Dimensional Metal Carbide Supercapac-itors: A Molecular Dynamics Simulation Study. ChemSusChem, ChemPubSoc Europe/Wiley, 2017, 11 (12), pp.1892-1899. �hal-01987290�
1
Tracking Ionic Rearrangements and Interpreting
Dynamic Volumetric Changes in
Two-Dimensional Metal Carbides Supercapacitors: A
Molecular Dynamics Simulation Study
Kui Xu, [a, b, c] Dr. Zifeng Lin, [a, c] Dr. Céline Merlet, [a, c] Dr. Pierre-Louis Taberna, [a, c] Prof. Ling Miao, [b] Prof. Jianjun Jiang, *[b] Prof. Patrice Simon, *[a, c]
[a] Kui Xu, Dr. Zifeng Lin, Dr. Céline Merlet, Dr. Pierre-Louis Taberna, Prof. Patrice Simon
Université Paul Sabatier Toulouse III, CIRIMAT UMR CNRS 5085, 118 route de Narbonne, 31062 Toulouse, France
E-mail: [email protected]
[b] Kui Xu, Prof. Ling Miao, Prof. Jianjun Jiang
School of Optical and Electronic Information, Huazhong University of Science and Technology, Wuhan, Hubei 430074, People’s Republic of China
E-mail:[email protected]
[c] Kui Xu, Dr. Zifeng Lin, Dr. Céline Merlet, Dr. Pierre-Louis Taberna, Prof. Patrice Simon
Réseau sur le Stockage Electrochimique de l’Energie (RS2E), FR CNRS 3459, 33 rue Saint Leu, 80039 Amiens, France
Supporting Information and the ORCID identification number(s) for the author(s) of this article can be found under:
2
Abstract: We present a molecular dynamics simulation study achieved on
two-dimensional (2D) Ti3C2Tx MXenes in an [EMIM]+[TFSI]- ionic liquid electrolyte. Our
simulations reproduce the different patterns of volumetric change observed experimentally for both the negative and positive electrodes. The analysis of ionic fluxes and structure rearrangements in the 2D material provide an atomic scale insight into the charge and discharge processes in the layer pore and confirm the existence of two different charge storage mechanisms at the negative and positive electrodes. The ionic number variation and the structure rearrangement contribute to the dynamic volumetric changes of both electrodes: negative electrode expansion and positive electrode contraction.
Introduction
Nowadays, there is a rising demand for reliable and safe energy storage technologies, such as for (hybrid) electrical vehicles, portable electronic devices, and smart grids. Thus, high performance electrochemical energy storage devices are needed. An increasing number of materials-driven research aims at boosting the energy, power density and cycle life of rechargeable batteries, or at increasing the energy density of electrochemical capacitors.[1] The discovery of two-dimensional (2D) layered materials as host structures for ion intercalation reactions has focused tremendous attention during the past decade[2].
These 2D nanomaterials, which include graphene, transition metal oxides, transition metal
3 promising performances as electrode materials for rechargeable batteries and supercapacitors.[4]
2D nanomaterials possess a high specific surface area; they store the energy by a fast ion intercalation/deintercalation mechanism between the layers without phase transformation, thus providing intercalation pseudocapacitance[5]. This mechanism comes with rapid expansion and contraction of the multi-layer 2D materials.[6] Unlike the rigid 3D structures, the flexible nature of the 2D materials,[7] which is free to expand and contract, favors a fast ion transportation inside the 2D interlayer spacing that makes these materials suitable for high power applications.
One of the key challenges in exploiting the full potential of these 2D materials is to understand the charge storage mechanism occurring inside the 2D slits during the electrochemical process. While a lot of efforts have been made to understand the relation between the morphology/architecture and the electrochemical performance of 2D nanomaterials using conventional electrochemical techniques (voltammetry, galvanostatic, electrochemical impedance spectroscopy, etc.),[4a] less attention has been paid to the in situ dynamic behavior during the electrochemical process. Since there are still many technological difficulties to do a direct quantification of the species population and dynamic at the molecular scale, it is challenging to probe ion dynamics in working electrodes.
4 Recently, some in situ characterization techniques were developed to tackle this problem. Griffin et al. directly quantified the populations of anions and cations[8] and observed the ion dynamics[9] inside a system resembling a 2D material - a microporous carbon electrode. To this end, they used in situ Nuclear Magnetic Resonance (NMR) spectroscopy combined with electrochemical quartz crystal microbalance (EQCM) gravimetry. Their results show different charge storage mechanisms for the positive and negative electrodes. For the system they studied, a tetraethylphosphonium tetrafluoroborate / acetonitrile electrolyte in contact with activated carbon electrodes, they observed that under negative polarization, the charge is stored by counter-ion (cation) adsorption, whereas for positive polarization, an ion exchange mechanism dominates. Furthermore, Tsai et al. and Levi et al. reported the sensitive probing of dynamic composition changes in porous carbon electrode under charging by gravimetric analysis using EQCM.[10]
MXenes are 2D materials firstly reported by Naguib et al..[11] MXenes show 2D morphology,[12] ion intercalation capacity,[5a, 5b] metallic conductivity and tunable surface terminations[13] that make them promising for energy storage[4b] and other applications
including electrochemical capacitors,[14] Li-ion batteries[15] and actuators[6a, 16]. In previous studies, we investigated the intercalation and deintercalation of [EMIM]+ cations and/or [TSFI]- anions in the MXene Ti3C2Tx electrode and observed the volumetric dynamic changes associated by in situ X-ray diffraction.[6b] Later Jäckel et al. further explored the swelling/contraction of the same Ti3C2Tx MXene in contact with different ionic liquids
5 during electrochemical cycling using both electrochemical dilatometry and in situ X-ray diffraction measurements.[16] These two studies evidenced a volume expansion at the negative polarization and a contraction at the positive electrode during constant current charge. However, the mechanism at the origin of the charge storage in these neat ionic liquids is still unclear.
In this paper, we propose an atomistic interpretation of the volumetric change by tracking the ionic rearrangement in Ti3C2Tx MXene using Molecular Dynamics (MD) simulations. MD simulations play an important role in understanding the dynamics of charging in nanoporous supercapacitor electrodes.[17] We develop a flexible simulation system with multi-layered MXene electrodes immersed into a neat ionic liquid electrolyte. In contrast to previous studies[18], the MXene electrode layers are set movable during the simulation process. We are thus able to track the evolution of some characteristic quantities, such as the displacement of the MXene layers, the change of the in-pore ion numbers and the electric double layer (EDL) structures inside the nanopore as a function of time.
Results and Discussion
A snapshot of the simulation system is shown in Figure 1. Two four-layers Ti3C2Tx
electrodes were immersed in an [EMIM]+[TFSI]- ionic liquid electrolyte. The Ti3C2Tx
MXene electrodes and the [EMIM]+[TFSI]- ionic liquid electrolyte were selected according to our previous work.[6b] The Ti3C2Tx MXene layers were decorated with three different
6
Ti3C2O2, Ti3C2F2) were used to investigate the effect of these different functional groups.
The multilayered Ti3C2Tx with an initial interlayer spacing of 1.0 nm, were set flexible;
each Ti3C2Tx layer could move independently as a rigid body during the simulation. The
ionic liquid ions uniformly surrounding the outer surface of the electrode spontaneously intercalated into the interlayer spacing during the equilibration run without any external polarization.
Figure 1. Snapshot of the simulation system obtained using the VMD software[20]. The
system consists in a negative electrode (four layers of Ti3C2Tx on the left), a positive electrode (four layers of Ti3C2Tx on the right), and a pure ionic liquid ([EMIM][TFSI]) surrounding the electrodes. The color spectrum, with blue as the lowest electrostatic potential value and red as the highest, is employed to convey the varying intensities of the electrostatic potential values. The silvery wavy surfaces surrounding the Ti3C2Tx layers
represent the electrostatic isopotential surfaces of -2 V (negative electrode) and +2 V
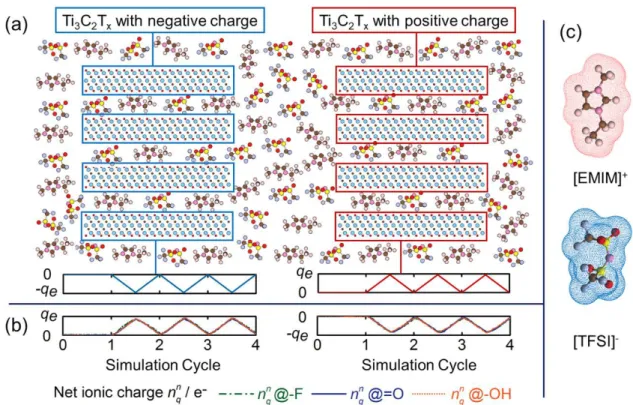
7 The simulations began with a no external polarization equilibrium run. After the simulated systems reached equilibrium, a galvanostatic charge/discharge process was simulated. The variation mode of the extra charge on the negative and positive electrodes as a function of the simulation time is represented in Figure 2(a). When charging, the left
Ti3C2Tx electrode was progressively charged with a constant negative extra charge, - 𝛥𝛥𝑞𝑞𝑒𝑒,
until reached the maximum charged value -qe, while the right Ti3C2Tx electrode was
charged with an equivalent constant positive extra charge, 𝛥𝛥𝑞𝑞𝑒𝑒. The electrical neutrality is thus maintained in the whole system during the simulation.
Figure 2. (a) Schematic of the variation of the extra charge amount on the Ti3C2Tx layer
8 of the net ionic charge 𝑛𝑛𝑞𝑞𝑖𝑖𝑖𝑖−𝑝𝑝𝑝𝑝𝑝𝑝𝑒𝑒 in the pores of both the negative electrode and the positive electrode with different functional groups (-F, =O, -OH) during the neutral cycle (0 - 1 cycle) and galvanostatic charge/discharge cycles (1 - 4 cycles). (c) Schematic of the atomic structure of [EMIM]+ and [TFSI]- ions and their occupied volume.
Upon charging, the electrostatic potential of the left Ti3C2Tx electrode decreases, while
the electrostatic potential of the right Ti3C2Tx electrode increases; a potential drop is
observed between the two electrodes, coming from the electrolyte ionic resistance. The electrostatic potential difference drives the ions mobility and rearrangement inside/outside the pore. The electrostatic potential map of the modeled system at the maximum charged state, as a result of rearrangements of the electrolyte ions, is calculated using the PME plugin of VMD[21] and represented in Figure 1. The nearly 0 V potential zone (white color
zone of the potential map) is reached in the middle region between the two electrodes, thus proving that the electrostatic equilibrium is reached in the simulation system when charged. The electrostatic isopotential surfaces with values of -2 V and 2 V are shown, surrounding the negative Ti3C2Tx surface and the positive Ti3C2Tx surface, respectively. The ~4 V
potential drop observed between the two electrodes is in line with experimental values.[6b]
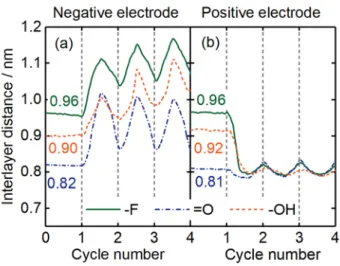
Electrode volumetric dynamic. The change of the interlayer distance between the
Ti3C2Tx layers, which directly reflects the variation of electrode volume, is simulated first.
Figure 3 shows the average interlayer distances between the Ti3C2Tx layers at both
9 the galvanostatic charge/discharge cycles (cycle 1 to cycle 4). During the equilibration cycle at the OCV, the Ti3C2Tx interlayer distances slightly deviate from their initial values
and reach new stable values. Due to the different van der Waals (vdW) and coulombic interactions between the ions and the electrode surface, the in-pore ions form different stable layered structures to reach minimum energy states inside the pore. The different functional groups thus lead to different interlayer distances. The new stable average interlayer distances are ~0.96 nm, ~0.82 nm and ~0.91 nm for Ti3C2F2, Ti3C2O2 and Ti3C2OH2 electrodes, respectively.
Figure 3. Evolution of the average interlayer distances between the Ti3C2Tx layers of both
negative and positive electrode during the neutral cycle (0 - 1 cycle) and galvanostatic charge/discharge cycles (1 - 4 cycles). A 9 galvanostatic charge/discharge cycles’ simulation result is shown in Figure S3 in supporting information.
The interlayer distance follows opposite trends during the charge/discharge cycles, depending on the electrode polarity. During charging, Figure 3 shows a reversible,
10 continuous expansion of the Ti3C2Tx interlayer distance at the negative electrode while a reversible, continuous contraction is observed at the positive electrode. At the negative electrode side, the interlayer distance reaches its maximum value at the fully charged state and continuously decreases during discharge. The minimum value of the interlayer distance after the first discharge is slightly different from the initial one (about 5% larger). At the positive electrode, the opposite trend is observed: the interlayer distance drops down to a minimum value at the fully charged state, and then slightly increases upon discharge. The new neutral state values of Ti3C2Tx with different functional groups deviate a lot from their initial values at OCV, and are similar to each other. The dynamic qualitative changes of the interlayer distance at both negative and positive electrodes are consistent with our previous in situ XRD experimental observations.[6b] Finally, Figure 3 shows that there is an irreversible increase (decrease) of about 10% of the interlayer spacing at the first cycle at the negative (positive) electrode.
Furthermore, while the nature of the functional groups present on the Ti3C2Tx surface does not affect the general trend, it has an impact on the amplitude of the interlayer distance change. After the first cycle, the amplitude of the change upon cycling is smaller at the positive electrode (about +/- 0.03 nm) than that observed at the negative electrode (about +/-1 nm). In addition, the variation of the interlayer distances during the charge/discharge does not depend on the nature of the surface group at the positive electrode, differently from the negative side. This difference may come from the ion structure arrangement inside
11 the pore; this will be discussed below. The average expansion rates normalized to the equilibrium distance measured at OCV are 9.0 % - 17.0 % with different functional groups at the negative electrode, while the contraction rates are only 2.5 % - 5.0 % at the positive electrode. The calculated changes agree well with in situ XRD Tracking and Chronoamperometric Dilatometry Measurements with the Ti3C2Tx MXene: a maximum expansion of 9% at -1.0 V and a maximum contraction of 1% at +0.5 V were observed.[16]
Change of ion population in the electrodes. To further clarify the charge storage
mechanisms responsible for the volumetric change of the Ti3C2Tx electrodes, the evolution of the net ionic charge 𝑛𝑛𝑞𝑞𝑖𝑖𝑖𝑖−𝑝𝑝𝑝𝑝𝑝𝑝𝑒𝑒 (calculated using 𝑛𝑛𝑞𝑞𝑖𝑖𝑖𝑖−𝑝𝑝𝑝𝑝𝑝𝑝𝑒𝑒 = 𝑛𝑛+𝑖𝑖𝑖𝑖−𝑝𝑝𝑝𝑝𝑝𝑝𝑒𝑒 - 𝑛𝑛−𝑖𝑖𝑖𝑖−𝑝𝑝𝑝𝑝𝑝𝑝𝑒𝑒, where 𝑛𝑛+𝑖𝑖𝑖𝑖−𝑝𝑝𝑝𝑝𝑝𝑝𝑒𝑒 and 𝑛𝑛−𝑖𝑖𝑖𝑖−𝑝𝑝𝑝𝑝𝑝𝑝𝑒𝑒 are the in-pore numbers of [EMIM]+ and [TFSI]- respectively) and in-pore [EMIM]+ and [TFSI]- ion populations are calculated and shown in Figure 2(b) and
Figure 4, respectively. The net ionic charge balances most of the injected charges in the
electrode in real time, at both electrodes (~93.5% in negative and ~90.3% in positive electrode). The nature of the functional groups does not significantly impact the charge compensation, the in-pore net ionic charge being nearly the same with different functional groups. It can be concluded that the extra electrostatic interaction dominates the ion transfer, rather than the coulombic and vdW interactions resulting from the presence of surface functional groups.
The change in the in-pore net ionic charge results from the counter-ion and co-ion intercalation / deintercalation between the Ti3C2Tx layers. In the negative electrode, there
12 is an obvious increase (decrease) of the number of counter-ion [EMIM]+ and a slight decrease (increase) of the co-ions [TFSI]- during charge (discharge) process. It can be concluded that the extra charge on the electrode is mainly compensated by the counter-ion intercalation. On the other hand, the positive electrode exhibits a slightly higher extent of co-ion deintercalation than the counter-ion intercalation during charge, leading to an ion exchange - or swapping - mechanism. Interestingly, these simulation patterns at both negative and positive electrodes are similar to the ones observed by in situ NMR in microporous carbon pores in the range -1.5 V to +1.5 V. [8]
Figure 4. Evolution of the [EMIM]+ and [TFSI]- ion populations inside the pores for both
the negative and positive electrodes during the neutral cycle (0 - 1 cycle) and the galvanostatic charge/discharge cycles (1 - 4 cycles).
Considering the change of in-pore co-ion number 𝛥𝛥𝑛𝑛𝑐𝑐𝑝𝑝−𝑖𝑖𝑝𝑝𝑖𝑖𝑖𝑖𝑖𝑖−𝑝𝑝𝑝𝑝𝑝𝑝𝑒𝑒 and counter-ion number 𝛥𝛥𝑛𝑛𝑐𝑐𝑝𝑝𝑐𝑐𝑖𝑖𝑐𝑐𝑒𝑒𝑝𝑝−𝑖𝑖𝑝𝑝𝑖𝑖𝑖𝑖𝑖𝑖−𝑝𝑝𝑝𝑝𝑝𝑝𝑒𝑒 calculated from the simulation trajectories, various charge storage mechanisms are possible. We have followed the approach suggested in previous works to
13 classify these mechanisms into three categories: I. counter-ion intercalation: the charging process is entirely driven by the adsorption of counter-ion into the pore (𝛥𝛥𝑞𝑞𝑒𝑒 = 𝛥𝛥𝑛𝑛𝑐𝑐𝑝𝑝𝑐𝑐𝑖𝑖𝑐𝑐𝑒𝑒𝑝𝑝−𝑖𝑖𝑝𝑝𝑖𝑖𝑖𝑖𝑖𝑖−𝑝𝑝𝑝𝑝𝑝𝑝𝑒𝑒 ); II. ion deintercalation: the charging is driven by the desorption of co-ions (𝛥𝛥𝑞𝑞𝑒𝑒 = −𝛥𝛥𝑛𝑛𝑐𝑐𝑝𝑝−𝑖𝑖𝑝𝑝𝑖𝑖𝑖𝑖𝑖𝑖−𝑝𝑝𝑝𝑝𝑝𝑝𝑒𝑒); III. co-ion/counter-ion exchange: charge be balanced by the counter-ion adsorption and co-ion desorption simultaneously (𝛥𝛥𝑞𝑞𝑒𝑒 = 𝛥𝛥𝑛𝑛𝑐𝑐𝑝𝑝𝑐𝑐𝑖𝑖𝑐𝑐𝑒𝑒𝑝𝑝−𝑖𝑖𝑝𝑝𝑖𝑖𝑖𝑖𝑖𝑖−𝑝𝑝𝑝𝑝𝑝𝑝𝑒𝑒 − 𝛥𝛥𝑛𝑛𝑐𝑐𝑝𝑝−𝑖𝑖𝑝𝑝𝑖𝑖𝑖𝑖𝑖𝑖−𝑝𝑝𝑝𝑝𝑝𝑝𝑒𝑒). [22] A charging may involve a combination of the different mechanisms in practice. Based on this, we evaluate the proportion of each mechanism at the negative electrode and positive electrode and represent it in Figure 5. In the negative electrode, we calculate that the extra electrode charge qe is mainly compensated by counter-ion intercalation (68.7 % up to 94.7 %), and only 6.3 % - 31.3 % of the qe is compensated by co-ion/counter-ion exchange. In the positive pore, the co-ion/counter-ion exchange mechanism plays a dominant role (55.2 % - 87.9 %) in compensating extra electrode charge, and the remaining extra charge (12.1 % - 44.8 %) is compensated by co-ion deintercalation mechanism.
14
Figure 5. Proportion of each storage mechanism (counter-ion intercalation, co-ion
deintercalation and co-ion/counter-ion exchange) at the negative and positive electrodes, when the system is fully charged.
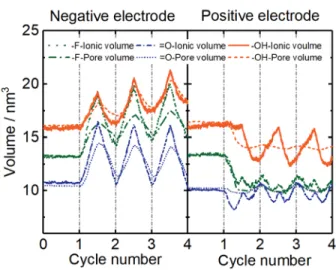
The change of in-pore ion numbers directly affects the in-pore electrolyte volumes, due to the near-incompressibility of the ionic liquids. Assuming a constant occupied volume for the [EMIM]+ and [TFSI]- ions (see Figure 2(c)), noted as 𝑣𝑣+𝑖𝑖 = 0.194 nm3 and 𝑣𝑣−𝑖𝑖 = 0.239 nm3, respectively, the in-pore ionic volume 𝑣𝑣ionic𝑖𝑖𝑖𝑖−𝑝𝑝𝑝𝑝𝑝𝑝𝑒𝑒 can be calculated using equation (1):
𝑣𝑣𝑖𝑖𝑝𝑝𝑖𝑖𝑖𝑖𝑐𝑐𝑖𝑖𝑖𝑖−𝑝𝑝𝑝𝑝𝑝𝑝𝑒𝑒 = 𝑛𝑛+𝑖𝑖𝑖𝑖−𝑝𝑝𝑝𝑝𝑝𝑝𝑒𝑒× 𝑣𝑣+𝑖𝑖 + 𝑛𝑛−𝑖𝑖𝑖𝑖−𝑝𝑝𝑝𝑝𝑝𝑝𝑒𝑒× 𝑣𝑣−𝑖𝑖, (1) and the total ion number 𝑛𝑛𝑇𝑇𝑖𝑖𝑖𝑖−𝑝𝑝𝑝𝑝𝑝𝑝𝑒𝑒 is calculated using equation (2):
𝑛𝑛𝑇𝑇𝑖𝑖𝑖𝑖−𝑝𝑝𝑝𝑝𝑝𝑝𝑒𝑒 = 𝑛𝑛+𝑖𝑖𝑖𝑖−𝑝𝑝𝑝𝑝𝑝𝑝𝑒𝑒 + 𝑛𝑛−𝑖𝑖𝑖𝑖−𝑝𝑝𝑝𝑝𝑝𝑝𝑒𝑒, (2) The calculated in-pore ionic volume change of both electrodes is shown in Figure 6, a similar trend is obtained for the evolution of the total ion number 𝑛𝑛𝑇𝑇𝑖𝑖𝑖𝑖−𝑝𝑝𝑝𝑝𝑝𝑝𝑒𝑒 (see Figure S4 in supporting information). The change of the in-pore ionic volume during charge /
15 discharge cycles, is consistent with the variation of the extra charge on the electrode. The volume change is mainly driven by the counter-ion [EMIM]+ population change, independently of the surface groups present at the surface of the MXene layers. In the positive electrode, the in-pore ionic volume change is more complex to interpret. During charge, below ~50% state of charge, a co-ion deintercalation mechanism mainly occurs (see Figure 4) in -F and =O containing pores; as a result, the total-ion number and ionic volume decrease. Beyond ~50% state of charge, the instantaneous intercalation rate of counter-ion [TFSI]- is faster than the instantaneous deintercalation rate of [EMIM]+, resulting in an increase of the total-ion number and ionic volume. For the -OH containing surface groups, the ion swapping mechanism (about 88% ion exchange) leads to a constant ion number and ionic volume change during the first charge. Then, the co-ion deintercalation and counter-ion intercalation is consistent with a volume expansion / contraction during charge / discharge processes. Note that beyond 50% state of discharge, the co-ion population goes below that present at the OCV, resulting in a constant - or slight decrease - of the ionic volume.
The change of in-pore ionic volume and the pore volume between the Ti3C2Tx layers present a similar trend in both neutral state and charge/discharge process. However, some deviations can be seen, especially at the positive electrode. These deviations imply that while the ionic volume variation caused by the ion intercalation/deintercalation in the
16 MXene electrode dominates the pore/electrode volume variation, other steric effects caused by ionic rearrangement and reorientation cannot be neglected.
Figure 6. Change of electrode pore volume (dashed line) and in-pore ionic volume (solid
line) in both negative and positive electrode pores during the OCV period (0 -1 cycle) and galvanostatic charge/discharge cycles (1 - 4 cycles).
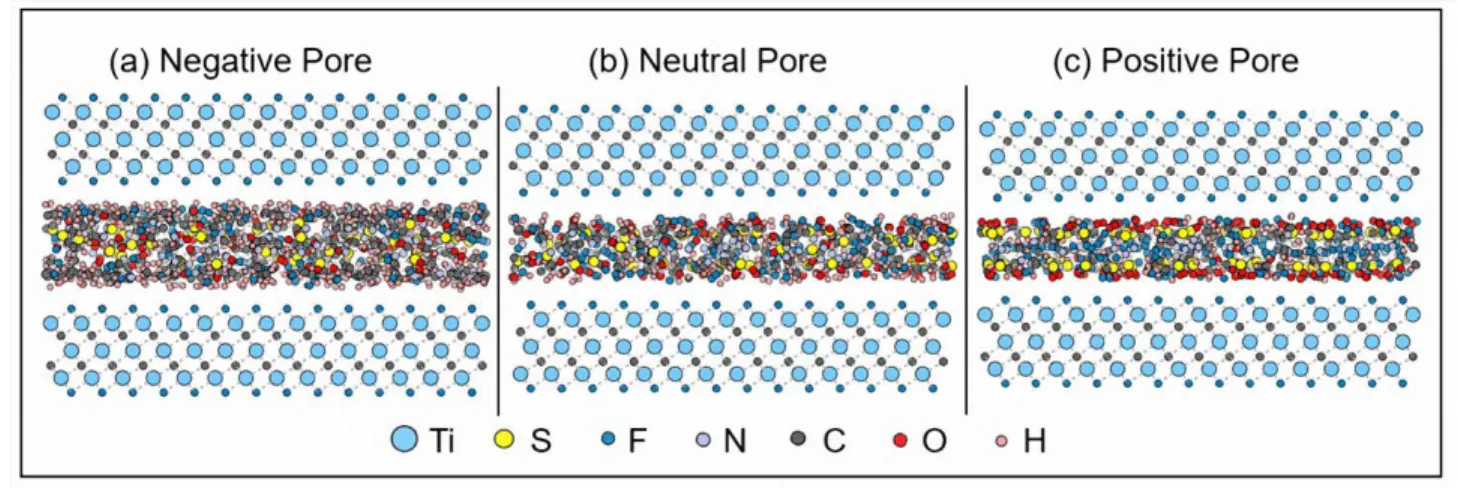
Ion arrangement in MXene pores. Beyond the ionic intercalation / deintercalation
mechanism occurring during the charge/discharge process, ions arrangement affects the volumetric dynamic of the electrode. Under the action of the electrostatic force, the polar [EMIM]+ and [TFSI]- molecules will rotate in order to screen the external electric field. Snapshots of the ionic arrangements inside one of the MXene (here Ti3C2F2) electrode pores at different charged states: negatively charged, neutral and positively charged are shown in Figure 7. It can be clearly observed that in the negative pore, the hydrogen atoms are attracted by the negative surface and prefer to stay near the electrode surface, while in the positive pore the oxygen atoms prefer to locate close to the electrode surface. When the
17 electrode is back to the neutral state, the ionic arrangements return to a uniform random arrangement.
Figure 7. Snapshots of the ionic arrangements inside one of the Ti3C2F2 electrode pores at
different charged state: (a) negatively charged, (b) neutral, (c) positively charged, respectively.
In order to quantitatively analyze the ionic arrangements inside the MXene electrode, the (number) density distributions of [EMIM]+ and [TFSI]- perpendicular to the Ti3C2Tx layer were examined. Figure 8 represents the change of the [EMIM]+ and [TFSI]- organization and the charge density distributions in both negative and positive pores under polarization as the simulation proceeds. The ionic distribution undergoes a dynamic reorganization under the external electric field, which favors the screening of the electrostatic interactions. In the negative pore, the [EMIM]+ density distribution changes from only one peak in the middle of the pore at OCV to three peaks as the ionic number and interlayer distance change during the charge/discharge process, in agreement with a counter-ion intercalation charge
18 storage mechanism. At the same time, the co-ion [TFSI]- density in the negative electrode decreases, moves away from the charged electrode surface, and accumulates in the middle of the interlayer spacing. In the positive pore, the density distribution of the [TFSI]- counter-ion changes from one peak at OCV to two peaks near the electrode surface. The intensity of the peak varies with the amount of extra charge during charge/discharge process, but the peak position does not shift. The peak intensity of the co-ion [EMIM]+ increases and decreases upon cycling, in agreement with an ion exchange mechanism.
19
Figure 8. Evolution of [EMIM]+, [TFSI]- density profiles and charge density profiles inside
the negative electrode pore ((a), (b), (c)) and positive electrode pore ((d), (e), (f)) of Ti3C2F2 electrode during neutral e (0 - 1 cycle) and charge/discharge process e (1 - 4 cycle), as an example.
20 In summary, we have studied the charge storage mechanism in Ti3C2Tx MXene electrodes in contact with a neat [EMIM]+[TFSI]- electrolyte, using molecular dynamics simulations. We used parallel MXene layers with different surface groups, and applied constant charges on these layers to model charging and discharging. Our molecular simulations reproduce the volume changes of both the negative and positive electrodes observed experimentally. By tracking the ionic number and structural rearrangements inside the pores, we showed that different charge storage mechanisms occur at the negative electrode and at the positive electrode. In the negative electrode, the charge storage is mainly achieved by a counter-ion intercalation process, while an ion-exchange (co-ion deintercalation and counter-ion intercalation) process is observed at the positive electrode. As a result, the total in-pore ion number increases in the negative electrode and decreases in the positive electrode during the charge process. The ionic number variation correlates well with the dynamic volume changes observed experimentally: a volume expansion is seen on the negative electrode side while there is a contraction on the positive electrode side.
The as-obtained atomistic perspective into the volumetric dynamic and charge storage mechanism of 2D layered nanomaterials can help us design strategies for long lifetime electrodes – with limited – or even inexistent - volumetric change. This would allow for supercapacitor or actuator applications with controllable deformation. We could select the appropriate electrolyte ions – in order to reduce the deformation. Ions with similar dynamic
21 and geometric properties or bi-cationic/anionic electrolytes may be possible strategies to achieve these aims. Considering the limited parameters employed in this modelling work, we can expect that the electrode deformation mechanism might vary if a more realistic electrode structure, the movement pattern of the electrode and more complex ion-surface interactions (employing a polarizable force field for the ions for example) are fully taken into account. Also, limited by the chemical nature of the MXenes electrodes (consisting of different atoms: C, O, H, F and Ti) and the fact that the electrodes can move, we did not employ the constant potential method here. Previous works have given a detailed comparison between the constant potential method and the constant charge method and found that these two methods yield essentially similar EDL structures, while some deviations for the ion concentrations in the pores were observed.[23] The system studied then was an aqueous electrolyte (2.0 M NaCl electrolyte) in contact with graphene nanopores. The deviations observed in this case may be mitigated by the large amount of ions present in the pure ionic liquid investigated here. Strategies to include the constant potential method in simulations of MXenes will be investigated in the future. Nonetheless, our approach provides significant insights into the microscopic processes occurring during charge and discharge and provides a method to probe different electrolytes in MXene based supercapacitor systems. We hope that the promising interest on control and utilization of this electrode deformation effect will invite more systematic experimental validations and further theoretical exploration.
22
Computational Methods
All MD simulations are performed using the LAMMPS software.[24] The NVT ensemble with a target temperature of 450K is utilized in the simulations. The Verlet leapfrog algorithm with a time step of 1 fs is utilized to integrate Newton's equation of motion. The long-range electrostatic interactions are calculated via the particle-particle particle-mesh Ewald scheme. The OPLS-AA force field,[25] whose validity has been verified in previous studies,[26] is employed to determine the interactions between the atoms and molecules. A cutoff radius for the van der Waals interactions is set to 1.0 nm. The force field parameters and simulation model are summarized in the supporting information.
During the galvanostatic charge/discharge process, each simulation cycle contained a 0.15 ns charging period and 0.15 ns discharging period. While these simulation times may seem short, we have checked on some selected systems that four times longer simulations (0.6 ns charging and 0.6 ns discharging) give the same results. We believe that this is due to the small length of the pores (compared to experiments) and to the relatively high temperature used in the simulations (450K) which leads to fast diffusion of the ions. The charge current density was set to 200 kA/cm2. In order to acquire reliable statistics, three galvanostatic charge/discharge cycles are achieved in one simulation, and each simulation case is repeated three times with independent initial configurations. A more detailed discussion of the simulation process and the validity of the simulation system can be found in our previous study.[17f]
23
Acknowledgments
Kui Xu is supported by China Scholarship Council. This research work is supported by National Natural Science Foundation of China (Grant No. 51302097 & No. 51571096).
Keywords: Supercapacitors, Two-dimensional materials, Molecular dynamics, Slit
Nanopore, Ionic liquid.
References
[1] D. P. Dubal, O. Ayyad, V. Ruiz, P. Gomez-Romero, Chem. Soc. Rev. 2015, 44, 1777-1790.
[2] F. Bonaccorso, L. Colombo, G. Yu, M. Stoller, V. Tozzini, A. C. Ferrari, R. S. Ruoff, V. Pellegrini, Science 2015, 347, 1246501.
[3] G. Zhang, H. Liu, J. Qu, J. Li, Energy Environ. Sci. 2016, 9, 1190-1209. [4] a) B. Mendoza-Sanchez, Y. Gogotsi, Adv. Mater. 2016, 28, 6104-6135; b) B.
Anasori, M. R. Lukatskaya, Y. Gogotsi, Nat. Rev. Mater. 2017, 2, 16098. [5] a) M. R. Lukatskaya, O. Mashtalir, C. E. Ren, Y. Dall'Agnese, P. Rozier, P. L.
Taberna, M. Naguib, P. Simon, M. W. Barsoum, Y. Gogotsi, Science 2013, 341, 1502-1505; b) O. Mashtalir, M. Naguib, V. N. Mochalin, Y. Dall'Agnese, M. Heon, M. W. Barsoum, Y. Gogotsi, Nat. Commun. 2013, 4, 1716; c) M. Acerce, D. Voiry, M. Chhowalla, Nat. Nanotechnol. 2015, 10, 313-318.
[6] a) J. Come, J. M. Black, M. R. Lukatskaya, M. Naguib, M. Beidaghi, A. J. Rondinone, S. V. Kalinin, D. J. Wesolowski, Y. Gogotsi, N. Balke, Nano Energy
2015, 17, 27-35; b) Z. Lin, P. Rozier, B. Duployer, P.-L. Taberna, B. Anasori, Y.
Gogotsi, P. Simon, Electrochem. Commun. 2016, 72, 50-53.
[7] M. Ghidiu, M. R. Lukatskaya, M. Q. Zhao, Y. Gogotsi, M. W. Barsoum, Nature
2014, 516, 78-81.
[8] J. M. Griffin, A. C. Forse, W. Y. Tsai, P. L. Taberna, P. Simon, C. P. Grey, Nat.
Mater. 2015, 14, 812-819.
[9] Alexander C. Forse, John M. Griffin, C. Merlet, J. Carretero-Gonzalez, A.-Rahman O. Raji, Nicole M. Trease, Clare P. Grey, Nat. Energy 2017, 2, 16216. [10] a) W. Y. Tsai, P. L. Taberna, P. Simon, J. Am. Chem. Soc. 2014, 136, 8722-8728;
b) M. D. Levi, M. R. Lukatskaya, S. Sigalov, M. Beidaghi, N. Shpigel, L. Daikhin, D. Aurbach, M. W. Barsoum, Y. Gogotsi, Adv. Energy Mater. 2015, 5,
24 1400815; c) M. D. Levi, L. Daikhin, D. Aurbach, V. Presser, Electrochem.
Commun. 2016, 67, 16-21.
[11] M. Naguib, V. N. Mochalin, M. W. Barsoum, Y. Gogotsi, Adv. Mater. 2013. [12] M. Naguib, O. Mashtalir, J. Carle, V. Presser, J. Lu, L. Hultman, Y. Gogotsi, M.
W. Barsoum, ACS Nano 2012, 6, 1322-1331.
[13] a) X. Wang, X. Shen, Y. Gao, Z. Wang, R. Yu, L. Chen, J. Am. Chem. Soc. 2015,
137, 2715-2721; b) J. Wen, X. Zhang, H. Gao, Phys. Chem. Chem. Phys. 2017, 19, 9509-9518; c) H.-W. Wang, M. Naguib, K. Page, D. J. Wesolowski, Y.
Gogotsi, Chem. Mater. 2016, 28, 349-359.
[14] a) Z. Lin, D. Barbara, P.-L. Taberna, K. L. Van Aken, B. Anasori, Y. Gogotsi, P. Simon, J. Power Sources 2016, 326, 575-579; b) Y. Dall’Agnese, P. Rozier, P.-L. Taberna, Y. Gogotsi, P. Simon, J. Power Sources 2016, 306, 510-515.
[15] a) O. Mashtalir, M. R. Lukatskaya, M. Q. Zhao, M. W. Barsoum, Y. Gogotsi,
Adv. Mater. 2015, 27, 3501-3506; b) M. Naguib, J. Halim, J. Lu, K. M. Cook, L.
Hultman, Y. Gogotsi, M. W. Barsoum, J. Am. Chem. Soc. 2013, 135, 15966-15969.
[16] N. Jackel, B. Kruner, K. L. Van Aken, M. Alhabeb, B. Anasori, F. Kaasik, Y. Gogotsi, V. Presser, ACS Appl. Mater. Interfaces 2016, 8, 32089-32093.
[17] a) C. Pean, C. Merlet, B. Rotenberg, P. A. Madden, P. L. Taberna, B. Daffos, M. Salanne, P. Simon, ACS Nano 2014, 8, 1576-1583; b) C. Merlet, B. Rotenberg, P. A. Madden, P. L. Taberna, P. Simon, Y. Gogotsi, M. Salanne, Nat. Mater. 2012,
11, 306-310; c) C. Merlet, C. Pean, B. Rotenberg, P. A. Madden, B. Daffos, P. L.
Taberna, P. Simon, M. Salanne, Nat. Commun. 2013, 4, 2701; d) C. Pean, B. Rotenberg, P. Simon, M. Salanne, Electrochim. Acta 2016, 206, 504-512; e) V. Ivanistsev, K. Kirchner, T. Kirchner, M. V. Fedorov, J Phys Condens Matter
2015, 27, 102101; f) K. Xu, X. Ji, B. Zhang, C. Chen, Y. Ruan, L. Miao, J. Jiang,
Electrochim. Acta 2016, 196, 75-83.
[18] a) J. Vatamanu, D. Bedrov, J. Phys. Chem. Lett. 2015, 6, 3594-3609; b) R. Burt, G. Birkett, X. S. Zhao, Phys. Chem. Chem. Phys. 2014, 16, 6519-6538; c) D. Bedrov, J. Vatamanu, Z. Hu, J. Non-Cryst. Solids 2015, 407, 339-348; d) K. Xu, X. Ji, C. Chen, H. Wan, L. Miao, J. Jiang, Electrochim. Acta 2015, 166, 142-149; e) S. R. Varanasi, S. K. Bhatia, J. Phys. Chem. C 2015, 119, 17573-17584; f) G. Ori, C. Massobrio, A. Pradel, M. Ribes, B. Coasne, Langmuir 2015, 31, 6742-6751.
[19] a) M. A. Hope, A. C. Forse, K. J. Griffith, M. R. Lukatskaya, M. Ghidiu, Y. Gogotsi, C. P. Grey, Phys. Chem. Chem. Phys. 2016, 18, 5099-5102; b) J. Halim, K. M. Cook, M. Naguib, P. Eklund, Y. Gogotsi, J. Rosen, M. W. Barsoum, Appl.
Surf. Sci. 2016, 362, 406-417.
25 [21] A. Aksimentiev, K. Schulten, Biophys. J. 2005, 88, 3745-3761.
[22] A. C. Forse, C. Merlet, J. M. Griffin, C. P. Grey, J. Am. Chem. Soc. 2016, 138, 5731-5744.
[23] J. Yang, Z. Bo, H. Yang, H. Qi, J. Kong, J. Yan, K. Cen, ChemElectroChem
2017, 4, 2486.
[24] S. Plimpton, J. Comput. Phys. 1995, 117, 1-19.
[25] W. L. Jorgensen, D. S. Maxwell, J. Tirado-Rives, J. Am. Chem. Soc. 1996, 118, 11225-11236.
[26] a) E. Paek, A. J. Pak, G. S. Hwang, J. Electrochem. Soc. 2012, 160, A1-A10; b) E. Paek, A. J. Pak, G. S. Hwang, J. Chem. Phys. 2015, 142, 024701.
26
FULL PAPER
Layered structure dynamic mechanism: Using a specific
molecular dynamic simulation system with multi-layered MXene electrodes immersed into an ionic liquid electrolyte, we reproduced the different patterns of volumetric changes observed experimentally and gave an atomic scale interpreting to this dynamic change. The existence of two different charge storage mechanisms occurring at the negative and positive electrodes is also confirmed.
Kui Xu, Zifeng Lin, Céline Merlet, Pierre-Louis Taberna, Ling Miao, Jianjun Jiang,Patrice Simon
Page No. – Page No.
Tracking Ionic Rearrangements and Interpreting Dynamic Volumetric Changes in Two-Dimensional Metal Carbides Supercapacitors: A Molecular Dynamics Simulation Study
![Figure 1. Snapshot of the simulation system obtained using the VMD software [20] . The system consists in a negative electrode (four layers of Ti 3 C 2 T x on the left), a positive electrode (four layers of Ti 3 C 2 T x on the right), and a pure](https://thumb-eu.123doks.com/thumbv2/123doknet/11548630.296350/7.918.121.822.408.683/snapshot-simulation-obtained-software-consists-negative-electrode-electrode.webp)
![Figure 4. Evolution of the [EMIM] + and [TFSI] - ion populations inside the pores for both the negative and positive electrodes during the neutral cycle (0 - 1 cycle) and the galvanostatic charge/discharge cycles (1 - 4 cycles)](https://thumb-eu.123doks.com/thumbv2/123doknet/11548630.296350/13.918.289.627.512.779/figure-evolution-populations-negative-positive-electrodes-galvanostatic-discharge.webp)