HAL Id: hal-02881852
https://hal.archives-ouvertes.fr/hal-02881852
Submitted on 26 Jun 2020
HAL is a multi-disciplinary open access
archive for the deposit and dissemination of
sci-entific research documents, whether they are
pub-lished or not. The documents may come from
teaching and research institutions in France or
abroad, or from public or private research centers.
L’archive ouverte pluridisciplinaire HAL, est
destinée au dépôt et à la diffusion de documents
scientifiques de niveau recherche, publiés ou non,
émanant des établissements d’enseignement et de
recherche français ou étrangers, des laboratoires
publics ou privés.
Microstructure dependent fatigue life prediction for
short fibers reinforced composites: Application to sheet
molding compounds
M.A. Laribi, Sahbi Tamboura, Joseph Fitoussi, Mohammadali Shirinbayan,
R.Tie Bi, Abbas Tcharkhtchi, H. Ben Dali
To cite this version:
M.A. Laribi, Sahbi Tamboura, Joseph Fitoussi, Mohammadali Shirinbayan, R.Tie Bi, et al..
Mi-crostructure dependent fatigue life prediction for short fibers reinforced composites: Application
to sheet molding compounds.
International Journal of Fatigue, Elsevier, 2020, 138, pp.105731.
Microstructure dependent fatigue life prediction for short
fibers reinforced
composites: Application to sheet molding compounds
M.A. Laribi
a,b,⁎, S. Tamboura
c, J. Fitoussi
b, M. Shirinbayan
b, R.Tie Bi
d, A. Tcharkhtchi
b,
H. Ben Dali
caInstitut Clément Ader ICA, CNRS UMR 5312, 3, Rue Caroline Aigle, 31400 Toulouse, France bArts et Metiers Institute of Technology, CNAM, PIMM, HESAM University, F-75013 Paris, France cEcole Nationale d’Ingénieurs de Sousse, LMS, Pôle technologique, Route de Ceinture, 4054 Sousse Tunisie dZero Emission, FAURECIA CLEAN MOBILITY, Bois sur Prés, 25550 Bavans, France
A R T I C L E I N F O
Keywords:
Fiber reinforced composite modeling Damage-mechanics
Micro-mechanics Fatigue life prediction
A B S T R A C T
Because of the high variability of SMC microstructure due to materialflow during thermoforming, fatigue life prediction in real automotive structure represents a huge challenge. In this paper, we present a two-step mi-crostructure selection involving an original ultrasonic method which is briefly presented. Then, on the basis of four selected microstructure configurations, an accurate experimental damage analysis is performed including both monotonic and cyclic loading. The high microstructure dependence of the obtained Whöler curves is de-monstrated. Moreover, an experimental link between monotonic damage and fatigue life is emphasized. Then, a new fatigue life prediction methodology based on the later is proposed. This methodology also uses a micro-mechanical damage model in which a local damage criterion is involved for monotonic loading damage pre-diction. A very good agreement between experimental and predicted Whöler curves is demonstrated for all studied microstructures and three working temperatures. Finally, the model allows building a microstructure dependent Whöler curve abacus which may be very useful for SMC structures design.
1. Introduction
The use of composite materials is strongly conditioned by the ability of manufacturers or subcontractors to design automotive structures under various complex loading such as fatigue or crash. However, in real automotive parts, composite microstructures are always de-termined by the shaping process which always involves strong material flow during molding. Consequently, real structure parts inevitably contain multiple microstructures extremely variable from one location to another. In the case of SMC composites, semi-product sheets are manufactured by dispersing long bundles (usually 25 mm) of chopped fibers (commonly glass fibers or carbon fibers) on a bath of thermoset resin (commonly polyester resin, vinyl ester or epoxy resin). After a storage period while it matures, the material is cut into charges which are placed on specific areas of the mold depending on the required shape. Compression molding at high temperatures (usually around 160 °C) allows the charge tofill the mold by flowing. Once fully cured, the finished product is then removed from the mold. Therefore, the
specific placement of the SMC semi-product and material flow during hot pressure molding will determine the spatial distribution of the microstructure in the composite structure. An illustration of the latter variability is given[1]where microstructure measurement results are obtained from an original ultrasonic technique (briefly presented in paragraph 2.2.1). For comparative purposes, it can be shown that mi-crostructure scattering observed in SMC structures is far greater than that observed in the case of a thermoplastic matrix composite structure obtained by injection molding[2,3]. To a lesser extent, this variability is also observed within a plate processed for the purposes of the study (seeFig. 2).
In addition, it is well known that the mechanical properties of short fiber reinforced composites are highly dependent on microstructure
[4,5]. The latter must be considered as a major input to behavior laws and limit criterion (failure or damage) used infinite elements calcula-tion for structure design [6,7]. All the parameters used in the latter constitute the “material card” which determines the mechanical re-sponse including the threshold and kinetic of damage and failure. Given
⁎Corresponding author.
E-mail addresses:Mohamed-Amine.Laribi@ensam.eu,mohamed-amine.laribi@iut.tlse3.fr(M.A. Laribi),sahbi.tamboure@gmail.com(S. Tamboura),
joseph.fitoussi@ensam.eu(J. Fitoussi),mohammadali.shirinbayan@ensam.eu(M. Shirinbayan),bob.valor-ext@faurecia.com(R.T. Bi),
abbas.tcharkhtchi@ensam.eu(A. Tcharkhtchi),hachmi.bdaly@gmail.com(H.B. Dali).
the extreme microstructure variability in SMC parts, it should be ne-cessary, in absolute terms, to develop one material card per zone. In the case of fatigue loading, it supposes costly and time consuming experi-mental campaigns.
In order to address this difficulty, micromechanical modeling can be a suitable tool.
Several authors have proposed different micromechanical models including damage at the local scale. In Short Fiber Reinforced Composites (SFRC), fiber-matrix interface debonding is frequently presented as the predominant local damage mechanism [8]. Matrix micro-cracking can also participate in composite degradation and sometimesfiber breaking and pseudo-delamination [9,10,11]. There-fore, a damaged state can be described as a matrix in which are dis-tributed reinforcements and micro-cracks. When microstructure and local damage state are known, it is possible to use homogenization technique to compute step by step macroscopic response of the con-sidered composite[12,13]untilfinal failure. Several micromechanical models introducefiber–matrix interface[12]and matrix micro-cracks through local damage criteria put in competition. Sometimes, fiber breakage can also be taken into account[9]but is generally presented as a secondary local damage mechanism in SFRC. These local criteria are given in a statistical form in order to take into account the local variations of the microstructure[12,13,14,15]. They also can be strain rate dependent in order to take into account the effect of high speed loading [1,16,17,18]. The different populations of micro-cracks are introduced in the form of zero stiffness heterogeneities [19]. Some approaches propose models taking into account the progressive de-bonding of the interface[14,15,20]. Despringre & al.[21]have recently proposed to take into account the effect of fiber-matrix debonding through a decrease in the load transfer rate at the interface. Earlier, interface damage effect had been described by replacing a debonded fiber by an equivalent volume of matrix[14,15,22]. Jendli[12] con-siders that interface debonding effect is well described by both partial reductions of thefiber volume fraction and introduction of zero stiffness heterogeneity. To the same objective, Fitoussi & al.[14]proposed the
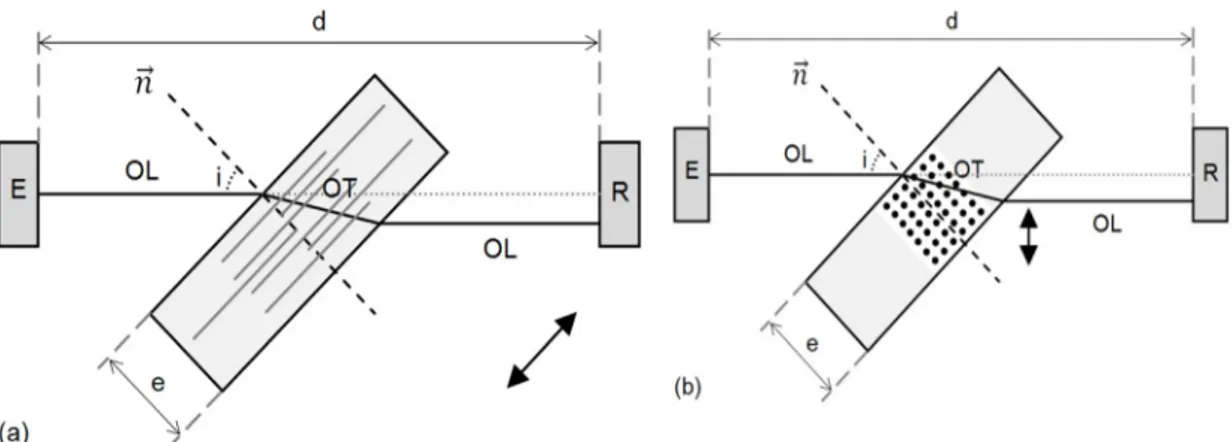
Fig. 1. Methodology of determination of thefiber orientation (a) High VOTmax(b) Low.VOTmax
Fig. 2. Ultrasonic test for a HO SMC Plate.
Table 1
Average values of the birefringence factor measured for the three selected microstructures.
Microstructure HO RO TG60°
K% 7.5 ± 1 3.5 ± 0.5 5.6 ± 0.8
Fig. 3. Tensile test for the selected specimens.
Fig. 4. Mechanical characterization procedure; preliminary loading-unloading-elastic reloading and fatigue.
concept of an equivalent anisotropic damage inhomogeneity.
It must be noticed that it is also possible to introduce local damage by using continuum damage mechanics at the local scale[23–26]. Two or four order damage tensors allow progressive weakening of the ma-trix, thefibers and the interface. Macroscopic behavior is then obtained by homogenization.
Generally based on the Mori and Tanaka approach [27], genization is performed in one or several steps. Two steps homo-genization is used in order to take into account the effect of specific damage mechanisms at one phase scale such as in the work of Desru-maux & al.[28]in which a first homogenization is performed at the matrix scale by introducing zero stiffness heterogeneities. Fibers are then introduced into an equivalent homogenized damaged matrix and fiber-matrix interface debonding is taken into account during the second step homogenization. In the case of SMC composites in which fibers are introduced in the form of bundles, Jendli & al.[12]choose to performed homogenization at the bundle scale. Then, homogenized damaged bundles are introduced in the matrix by a second homo-genization. In a similar way, Doghri & al.[26]introduced the concept of pseudo-grain regions which always contain only one family of het-erogeneity. In a second step macroscopic behavior is obtained by Mori and Tanaka homogenization considering each pseudo-grain as one phase.
SFRC fatigue damage and fatigue life prediction are some of the most critical subjects in automotive structure design. As in the case of monotonic loading, fatigue damage can also be described by local da-mage criteria or local dada-mage laws[29,30]which parameters depend on the number of imposed cycles. Despringre & al.[21]have recently proposed a micromechanical model of fatigue behavior of short glass fiber reinforced polyamide (PAGF30) based on the Mori and Tanaka approach. The authors proposed several local damage laws describing fiber-matrix debonding, matrix micro-cracking and fiber breakage. These local damages laws act simultaneously to describe the evolution of damage at the microscopic scale during fatigue loading. Mori and Tanaka homogenization scheme allows determining the macroscopic response of the composite. The principal interest of this kind of ap-proach lays in its strong physical content which allows taking into ac-count explicitly the microstructure variations due to damage. However, the use of these models, when implemented in industrialfinite element tools, implies time consuming numerical procedures which restrict the practical applicability of this approach in the case of fatigue loading.
Another specific difficulty of fatigue life characterization and pre-diction lays in the long and costly experimental campaigns involved in fatigue characterization. Marco and al. used thermal measurement during self-heating and analyzed heat energy to predict Whöler curves
[31]. This method provides good results in the case of polymers and
rubbers [32]. In the case of composites, changing microstructure characteristics such asfiber or matrix nature or reinforcement spatial distribution imposes a new characterization. In order to avoid this problem, Jain & al.[30,33], propose a methodology based on a master Wöhler curve established using specimen presenting a specific known microstructure. The authors used this master curve together with a Mori and Tanaka based micromechanical model including plasticity and damage in order to predict the Wöhler curve of each new targeted microstructure. This approach builds on an experimental observation which leads to the assumption that, for similar number of cycles to failure, the loss of stiffness curves for different microstructures can be considered as equivalent. However, experimental evidence shows that this assumption is not verified in the case of thermoset based compo-sites such as SMC.
However, Laribi & al.[29]have recently developed a fast fatigue life prediction of shortfiber reinforced composites using a hybrid damage approach. The authors applied with success this new methodology to a standard SMC composite. This methodology is built on the existence of a link between damage developed under monotonic loading and that developed under cyclic loading. This link is emphasized by an equation of state relating local damage state to macroscopic damage state. The local damage is described by a global damage rate while macroscopic damage is characterized by the loss of stiffness. This equation of state is identified using the micromechanical model developed by Jendli & al.
[12]and is generalized to the case of cyclic loading. The fatigue da-mage model is described by six parameters. Five parameters can rapidly be identified by the simulation of a simple tensile test and/or by loading-unloading tensile tests. The model was validated for different microstructures. However, the parameter describing the macroscopic damage kinetic must be evaluated experimentally for each new mi-crostructure. Therefore, in order to avoid this limitation, it is necessary to develop a complementary methodology which can be able to predict SN curves as a function of the microstructure. Therefore, the aim of this paper is to extend the applicability of Laribi’s approach. The present approach is also inspired by the Jain’s master curve approach[30].
After the presentation of SMC microstructure and two experimental microstructure selection methodologies used in this study, this paper emphasizes an important experimental result showing the existing link between monotonic loading damage and fatigue life. This relation, appearing to be independent of microstructure, is used together with micromechanical simulations of monotonic loading (tensile), to estab-lish Whöler curves for any other targeted microstructure. The model is finally used to study fatigue life sensitivity to the distribution of or-ientation.
2. Material and microstructures 2.1. Standard SMC composites
The studied material is a Sheet Molding Compound composite (SMC) used in automotive industry. It consists of an unsaturated polyester matrix reinforced by 28% weight content of glassfibers and
37% of Calcium carbonate (CaCO3) particles. Fibers are presented in the form of bundles of fibers with constant length (L = 25 mm). Approximately, each bundle contains 250 glassfibers of about 15 µm diameter. Before compression molding, the bundles are randomly or-iented in the plane of the non-reticulate SMC sheet. For the need of the study, three types of microstructure have been provided by Faurecia Automotive. Two of them are presented in the form of plates. The third one is extracted from a real automotive SMC part. During plate’s ela-boration, it is possible to control the average distribution offiber or-ientation by placing the non-reticulate SMC sheets in specific area of the mold. High Oriented (HO) plates and Randomly Oriented (RO) plates have been elaborated. HO plates have been obtained by placing the non-cured SMC only in half of the surface of a rectangular mold (120 × 250 mm2). Due to the thermo-compression process,fibers tend to be oriented parallel to the Mold Flow Direction. RO plates were obtained byfilling 80% of the mold surface. SMC sheets have been placed in the middle of the mold in order to limit materialflow. These plates are obtained under an average temperature of 165 °C and a pressure of 60 Bars. Reticulation time is less than two minutes. The third used microstructure corresponds to specimens extracted from the PSA 3008 tailgate in a specific location dedicated to quality control during production.
2.2. Microstructure selection
SMC composites mechanical behavior is known to present high dispersion. In a early study of Fitoussi & al.[34]has distinguished two types of mechanical scattering in SMC composites. In this study, we focus on scattering coming from microstructure variations due to a local variations of the volume fraction and distribution of orientation of fi-bers. These local variations bring to a local stresses variations which finally lead to macroscopic variation of damage threshold and kinetic. Under fatigue loading, damage behavior and fatigue life are generally more sensitive to these local variations [35]. Therefore, it is offirst importance to select specimens presenting different well identified microstructures in order to validate the proposed approach. To this aim, we propose two rapid assessment methodologies. Thefirst one is based on ultrasonic measurements while the second use damage analysis. 2.2.1. Ultrasonic method for rapid microstructure selection
Several studies have shown that ultrasonic techniques are an easy and efficient methods to identify the fibers orientation through the shear wave velocity evolution. Indeed, the use of an original ultrasonic was recently illustrated by Shirinbayan & al.[1]and Meftah & al.[2]. Two probes, transmitting (E) and receiving (R), are immersed into a waterflank at a fixed distance d. The sample is placed with an angle i (angle on incidence) of about 45° between the two probes in order to generate a shear waves. These waves propagate through the specimen width in a direction which is determined by the Snell-Descartes law. Consequently, one can define two limit cases: Longitudinal fibers or-ientation (OL) (Fig. 1(a)) and Transverse fibers orientation (OT) (Fig. 1(b)). When thefibers are oriented at 0°, they are contained in the shear plane and they offer a high section to shear (Fig. 1a). Conse-quently, the measured shear wave velocity value,VOT, will be maximal.
On the other hand, whenfibers are oriented perpendicularly to this plan, the sheared section is reduced to a minimum and defines a lower value of velocity (Fig. 1b).
Thus, by a simple rotation from 0° to 360° around the normal axis of the plane of the sample (→n inFig. 1),VOT evolution can be plotted in
order to evaluate thefibers orientation distribution. An acoustical bi-refringence coefficient, K%, related to the fiber orientation rate can be defined as: = − < > K% V V V OTmax OTmin OT (1)
where<VOT>is the average ofVOTvalues. The ultrasonic analysis was
Fig. 6. Relation between monotonicfirst loss of stiffness and fatigue life at different temperatures.
performed on specimens extracted from both SMC plates and SMC tailgate part.
2.2.2. Application
As an illustration, theFig. 2presents the ultrasonic results obtained on a high oriented SMC plate. One can observe a global orientation of thefibers in the mold flow direction. However, a relatively high scat-tering is emphasized (birefringence factor varying from 2 to 8.5). Moreover, to reduce the variability of the mechanical tests results, two equivalent microstructures zones have been selected. These zones are mentioned in white dotted lines in theFig. 2. In these selected zones, specimens present the higher birefringence value and a global or-ientation at 0° versus the moldflow direction.
The same kinds of results are obtained with specimens extracted on RO plates and on different specimens extracted from the same location of PSA 3008 tailgates. Note that in the last cited case a pre-ferential direction at 60° was emphasized with a good repeatability. Thereafter, this specific microstructure is noted TG60°.Table 1 sum-marizes these results.
2.2.3. Selection validation by damage analysis
In this study, quasi static and fatigue characterizations of the SMC behavior have been performed on a MTS 830 hydraulic machine. Tensile and fatigue samples were extracted from HO and RO plates. In the case of HO configurations, specimens were cut in two chosen or-ientations: in theflow direction 0°) and perpendicularly to it (HO-90°).
In this paragraph are presented the experimental tests and their respective protocols. Then, we present a selection method based on damage analysis and dedicated to verifying that the microstructures of the selected fatigue specimens are representative of one of the three identified microstructures (HO, RO and TG60°).
Several kinds of test have been performed:
a. Tensile tests until failure on the three typical microstructures: RO, HO (0° and 90°) and TG60° (see results inFig. 3). InFig. 3, one can verify that specimens presenting similar ultrasonic results show similar mechanical proprieties.
b. Tension-tension fatigue tests at several levels of maximum ap-plied stress. The operating frequency and stress ratio is f = 10 Hz and R = 0.1. One can define the loss of stiffness under fatigue loading:
( )
NE
E0 . For a better identification of E0and the residual stiffness after
thefirst cycle, E1, each performed fatigue test was preceded by a
quasi-static tensile loading–unloading-elastic reloading cycle. (see Fig. 4). Therefore, for each fatigue specimen, one can determine a value of the macroscopic damage parameter after afirst cycle: = −
=
( )
DN1 1 EE
N 1
0 .
Because the Young’s modulus is directly related to microstructure, this preliminary procedure allows verifying that each used fatigue specimen presents the appropriate microstructure. Indeed, the mea-sured values of DN1must be consistent with the average evolution of Dσ
determined by loading-unloading tensile tests until failure for the cor-responding microstructure. Otherwise, the specimen is not used in the fatigue campaign. SeeFig. 4where the preliminary values of DN1
mea-sured on the selected fatigue specimens at different maximum applied stress appear to be consistent with the evolution of Dσdetermined by
loading-unloading tensile test until failure.
Therefore, the selection of the three identified microstructure spe-cimens used in the fatigue campaign is performed by both ultrasonic measurements (birefringence factor) and thefirst loss of stiffness under cyclic loading (DN1). Such an approach enables a better control of the
microstructure and contributes to a strong reduction of scattering. In the following, we only present results obtained using the selected spe-cimens.
c. Loading-unloading tensile tests with progressive increase of the maximal load in order to determine the evolution of the loss of stiffness:
( )
σE
E0 where E is the actual Young’s modulus andE0is the non-damaged
composite Young’s modulus. Therefore, one can plot the evolution of the macroscopic damage parameter defined by Kachanov [36]:
= −
( )
Dσ 1
σ
E
E0 . See typical result in Fig. 5. Note that the proposed
methodology was applied for different temperatures (−30 °C, 23 °C and 80 °C) corresponding to classical automotive requirements.
Fig. 7. Micromechanical damage description. (From Jendli & al.[12]).
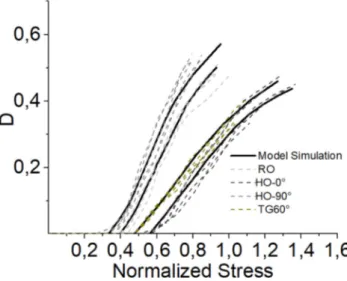
Fig. 8. Prediction of the macroscopic damage parameter evolution for di ffer-ents microstructures submitted to tensile loading.
3. Experimental link between monotonic loading damage and fatigue life
3.1. Intrinsic relationship between monotonicfirst damage and fatigue life Several authors have emphasized an existing link between mono-tonic behavior and fatigue life of composite materials[29,30,33]. Be-sides, some fatigue life predictive models are based on the residual monotonic strength[34,37]. This is due to the fact that, generally, the same damage mechanisms occur for both monotonic or fatigue loading. Except for very local effects such as strain localization around fiber-matrix interface [34,38], one can assume equivalent local damage states. Therefore, one can assume that a given local damaged micro-structure state, globally described by a certain content of micro-cracks, can be reached under several types of loading history (including monotonic, fatigue, creep, high strain rate or thermal loading). More-over, the local damage is directly related to macroscopic residual properties such as loss of stiffness. Indeed, Laribi & al.[29]have re-cently proposed an equation of state relating the local damage to macroscopic loss of stiffness. They demonstrated that this equation, established under monotonic loading, is also valid when adapted to cyclic loading. Therefore, one can postulate the existence of a unique multi-scale relation between local and macroscopic damage which is independent of the macroscopic loading history. When microscopic and macroscopic damage is expressed as relative values, this intrinsic re-lation is also independent of microstructure. In other words, we assume that two composite specimens submitted to an equivalent relative loss of stiffness by applying monotonic loading (for the first one) and fatigue loading (for the second one), will also develop an equivalent local da-mage rate.
Moreover, Laribi & al. [29] established that final failure occurs when a critical value of the local damage rate is reached. Indeed, one can consider that failure occurs when the residual resistant surface reaches a critical rate. Then, micro-cracks interconnect to form a macroscopic crack. Therefore, one can assert the existence of an
intrinsic link between damage and failure under monotonic loading and fatigue life. This relation can be emphasized by plotting the evolution of thefirst loss of stiffness (DN1) versus the number of cycle to failure (NR)
for each performed fatigue test (seeFig. 6where this intrinsic relation is emphasized for three working temperatures). As suggested above, this figure shows that this relation can be considered as an intrinsic re-lationship relatively independent of the microstructure as it can be observed inFig. 6. One can note that this intrinsic relation exists for all studied temperatures. This evolution can be traduced by the following expression:
= − ∗
DN1 1 C NrP (2)
where C and P, are material parameters which can be identified on the RO microstructure byfitting experimental results inFig. 6.
4. Micromechanical damage prediction 4.1. Micromechanical damage modeling
In this paragraph, we briefly remind the micromechanical model used for this work which is derived from Jendli & al.[12]in its adapted form by Laribi & al[29].
Fiber-matrix interface debonding is considered to be the pre-dominant local damage mechanism in SMC composites[14]. Thus, a local statistical interface damage criterion is proposed:
⎜⎜ ⎟ ⎜ ⎟⎟ = − ⎛ ⎝ ⎜−⎛ ⎝ ⎛ ⎝ ⎞ ⎠ + ⎛ ⎝ ⎞ ⎠ ⎞ ⎠ ⎞ ⎠ ⎟ σ σ τ τ Pr 1 exp 0 2 0 2 m (3) where Pris the interface failure probability, α and τ are the local
normal stress and shear stress at the interface calculated using Mori and Tanaka approach localization.α0,τ0and m are thefiber matrix
inter-face normal and shear strengths. m is a statistical parameter allowing to take into account local microstructure fluctuations. At each loading step, an interface failure probability is calculated for each fiber or-ientation family in order to determine the amount of created
micro-Mori and Tanaka damage
model for the Target microstructure
D
σ
N
RS-N curve for the
Target microstructure
S
D
SNR(D
S)
cracks. The effect of fiber–matrix debonding is then represented by both partial reduction of thefiber volume fraction, and introduction of zero stiffness heterogeneity (seeFig. 7).
Therefore, at each loading step, microstructure is defined by non-damagefibers, active fibers (including non-damaged fibers and a part of
damagedfiber) and micro-cracks whose volume fractions are respec-tively given by:
= − ∗ − fnND (1 P ) f r n n 1 ND
∑
= + = − fnact fnND k P . f i 1 n r i i 1 ND = − + − fnmc fn 1mc h. P . frn n 1ND (4)where k presents a reduction coefficient applied to fibers partially da-maged and h is the ratio between the volume of the introduced penny shape (representing interfacial micro-crack) and thefiber evaluated by geometric considerations. Subsequently, a homogenization procedure integrating matrix, reinforcements and micro cracks can be achieved using the Mori and Tanaka approach. Therefore, the evolution of the residual stiffness tensor of the composite during a monotonic tensile loading can be determined. Once the model parameters are identified (see[12]for the identification procedure), macroscopic damage evo-lution can easily be predicted in the case of monotonic tensile loading.
Fig. 8shows a comparison between prediction and experimental mea-surements.
5. Methodology of structure fatigue life prediction versus microstructure
5.1. From the reference microstructure for any other one
Once the micromechanical damage model identified and the (DN1,NR) curve established using the chosen reference microstructure,
one can propose the following numerical procedure in order to estab-lished SN curve for every other targeted microstructure (Note that the procedure is graphically illustrated inFig. 9):
Step 1: An experimental campaign is realized using selected speci-mens presenting a specifically chosen reference microstructure - ran-domly oriented if possible:
a. Loading-unloading tensile tests in order to establish the experi-mental (D, σ )Refcurve.
b. Fatigue tests until failure preceded by a loading–unloading re-loading quasi-static test are performed at different maximum am-plitude in order to establish the (DN1,NR)Refcurve.
Step 2: The identification of the local fiber–matrix interface failure criterion parameters is conducted using an inverse method on the basis of the (D, σ )Refexperimental curve as described in[12,29].
Step 3: A Targeted microstructure (Targ) is chosen. Monotonic tensile test is modeled until failure using the damage modelling based on the Mori and Tanaka approach: (D, σ )Targcurve is established for the targeted microstructure until a chosen macroscopic stress, σ = S.
Step 4: The macroscopic damage value DSreached for σ = S is read
on the modeled (D, σ )Targcurve.
Step 5: The corresponding number of cycle to failure, NR, is read on
the (DN1,NR) curve.
Step 6: Recording the couple of value (S,NR)
Step 7: Steps 1 to 6 are repeated for another chosen value of S as many times are needed to establish the SN curve of the targeted mi-crostructure.
Note that mathematically, once DSis determined by the Mori and
Tanaka based damage model, the number of cycle to failure for an applied macroscopic stress S can be calculated by:
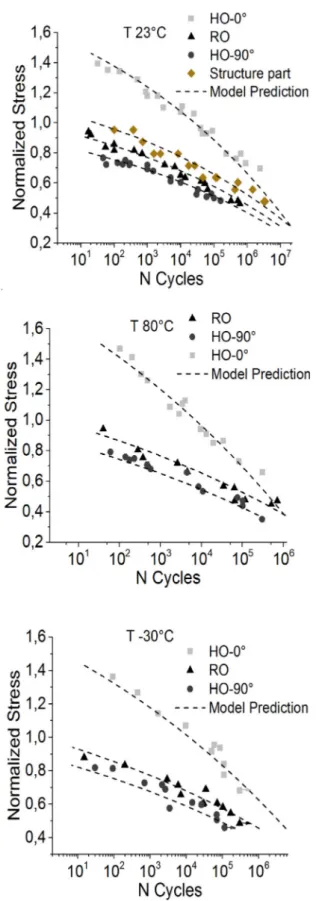
= ⎛ ⎝ − ⎞ ⎠ N D C 1 R S P 1 (5) Therefore, once the parameters, C and P, are determined for one reference microstructure (RO in our application) a simple monotonic tensile simulation enables deducing rapidly the SN curve for any other Fig. 10. Comparison between experiment and simulation results for different
targeted microstructure.
5.2. Application to SMC composites
Because it represents the average microstructure, RO SMC is chosen as reference material. Then, the micromechanical damage model parameters (α0, τ0 and m) are identified on the basis of the
experi-mental (D,α)ROcurves. Similarly, C and P parameters are identified on the (DN1,NR)ROcurves. Then, the numerical procedure described above
has been applied to the three SMC microstructures in study (RO, HO (0° and 90°) and TG60). Comparison between experimental results and modeling show very good agreement for all microstructure configura-tions (seeFig. 10).
6. Numerical study
Once the methodology validated, it is possible to determine the SN curve for several other SMC microstructures. Indeed, the use of the identified micromechanical model allows the influence of the dis-tribution offiber orientation on the Whöler curves to be studied nu-merically. One can propose the following orientation distribution function: = ∗ + ∗ − f f k n (1 M cos(2(θ θ))) θ P (6) where fθand f are the volume fraction of the fibers oriented at θ°
(versus a principal in-plane axis corresponding to the tensile direction) and the totalfiber volume fraction respectively. n is the number of orientation families used in the Mori and Tanaka approach, M is the orientation rate (related to the birefringence parameter) andθPis the
main orientation of thefibers (corresponding to the mold flow direc-tion). k is a normalizing parameter. This function has been shown to be representative for SMC composites. Indeed,fiber orientation distribu-tion is represented by two scalar parameters θ( ,P M)corresponding to the principle direction and randomness. In the case of SMC composites, materialflow during process remains limited because of the large size of the reinforcements. Indeed,fibers are presented in the form of 25 mm long bundles which implies high interactions between them and a limitation of the orientation variations. So that the variation of the scalar parameter M from 0 to 1 allows describing properly all real SMC orientation distribution through the proposed sinusoidal function. Note that the proposed methodology can be easily adapted to injected ma-terial for which the higher randomness should be described by the 2nd-order orientation tensor[39]which may be introduced in the Mori and Tanaka approach.Fig. 11shows obtained Whöler curves for different Fig. 11. Predicted Whöler curves according to thefiber orientation parameters (M, θP) and temperature.
microstructure parameters (M, θP) at different temperatures.
In-dependently of the temperature, a greater influence of the orientation rate M may be noted when thefibers are oriented in the tensile direc-tion (θP= 0°) and for the higher values of the applied maximum stress.
As expected, when thefibers are mainly oriented in the loading direc-tion, fatigue life increases with the orientation rate while it decreases when thefibers are oriented perpendicularly.
Therefore, the proposed methodology allows predicting the fatigue life for any microstructure. In a future paper, a Tsai-Wu criterion abacus built on the basis of the presented methodology will be presented and used to optimize the design of a real SMC structure.
7. Conclusion and perspectives
This paper proposes a fatigue life predictive model for SMC com-posites in which microstructure is an input data. Indeed, the high variations of the microstructure observed in real structures are due to materialflow during process. Therefore, in order to build an accurate experimental database, a two-step selection method involving an ori-ginal ultrasonic method and damage analysis is presented. A complete experimental damage analysis has been performed on several selected SMC’s microstructures. The high influence of SMC microstructure on fatigue life has been demonstrated. Moreover, an experimental link between monotonic loading damage and fatigue life has been empha-sized. It has been shown that this relation is independent of micro-structure. Therefore, a new fatigue life predictive approach based on this intrinsic relation and a micromechanical damage model has been built. This approach has been applied for four microstructure config-urations. Very good agreement between experimental and numerical results confirms the validity of this approach. Finally, a numerical study shows how the proposed methodology should be useful for structural design through the establishment of microstructure dependent Whöler curves abacus. Ideally, this abacus should be used in afinite element analysis coupled to process simulation allowing prediction of material flow during thermoforming of SMC composites.
Declaration of Competing Interest
The authors declare that they have no known competingfinancial interests or personal relationships that could have appeared to influ-ence the work reported in this paper.
References
[1] Shirinbayan M, Fitoussi J, Abbasnezhad N, Meraghni F, Surowiec B, Tcharkhtchi A. Mechanical characterization of a Low Density Sheet Molding Compound (LD-SMC): Multi-scale damage analysis and strain rate effect. Compos B 2017;131. [2] Meftah H, Tamboura S, Fitoussi J, Bendaly H, Tcharkhtchi A. Characterization of a
new fully recycled carbonfiber reinforced composite subjected to high strain rate tension. Appl Compos Mater 2018;25(3):507–26.
[3] Bernasconi A, Cosmi F, Dreossi D. Local anisotropy analysis of injection moulded fibre reinforced polymer composites. Compos Sci Technol 2008;68:2574–81. [4] A. Bernasconi, A. Bernasconi, E. Conrado P. Hine, An experimental investigation of
the combined influence of notch size and fiber orientation on the fatigue strength of a short glassfiber reinforced polyamide 6, August 2015 Polymer Testing 47, DOI: 10.1016/j.polymertesting.2015.08.002.
[5] Zuo P*, Benevides RC, Laribi MA, Fitoussi J, Shirinbayan M, Bakir F, Tcharkhtchi A. Multi-scale analysis of the effect of loading conditions on monotonic and fatigue behavior of a glassfiber reinforced polyphenylene sulfide (PPS) composite. Comp Part B Eng 2018;145:173–81.
[6] Jahwari Frooq Al, Naguib Hani E. Finite element creep prediction of polymeric voided composites with 3D statistical-based equivalent microstructure reconstruc-tion. Comp Part B99 2016.
[7] Ren Mingfa, Cong Jie, Wang Bo, Wang Lei. Extended multiscalefinite element method for large deflection analysis of thin-walled composite structures with complicated microstructure characteristics. Thin-Walled Struct 2018;130:273–85.
https://doi.org/10.1016/j.tws.2018.05.021.
[8] Tamboura S, Sidhom H, Baptiste D. Evaluation de la tenue en fatigue du composite SMC R42. Matériaux et Techniques 2001;3–4:3–11.
[9] Hour KY, Sehitoglu H. Damage development in a shortfiber composite. J Compos Mater 1993;27(8):782–805.
[10] Ning Zhihua, Liu Renhuai, Elhajjar Rani F. Fan Wang. Micro-modeling of thermal
properties in carbonfibers reinforced polymer composites with fiber breaks or delamination. Compos B 2017;114.https://doi.org/10.1016/j.compositesb.2017. 01.036. 247e255.
[11] Arif M, Saintier N, Meraghni F, Fitoussi J, Chemisky Y, et al. «Multiscale fatigue damage characterization in short glassfiber reinforced polyamide-66. Compos B Eng 2014;61:55–65.
[12] Jendli Z, Meraghni F, Fitoussi J, Baptiste D. Multi-scales modelling of dynamic behaviour for discontinuousfibre SMC composites. Compos Sci Technol 2009;69:97–103.
[13] Jendli Z, Meraghni F, Fitoussi J, Baptiste D. Micromechanical analysis of strain rate effect on damage evolution in sheet molding compound composites. Compos A Appl Sci Manuf 2004;35:779–85.
[14] Fitoussi J, Gua et G, Baptiste D. Determination of a tridimensionnal failure criterion at thefibre/matrix interface of an organic-matric/discontinuous reinforcements composite. Compos Sci Technol 1996;56:755–60.
[15] Meraghni F, Blakeman et C, Benzeggagh M. Effect of interfacial decohesion on stiffness reduction in a random discontinuous-fibre composite containing matrix microcracks. Compos Sci Technol 1996;56(115):541–55.
[16] Shirinbayan M, Fitoussi J, Meraghni F, Surowiec B, Bocquet M, Tcharkhtchi A. High strain rate visco-damageable behavior of Advanced Sheet Molding Compound (A-SMC) under tension. Compos B Eng 2015;82:30–41.
[17] Shirinbayan M, Fitoussi J, Bocquet M, Meraghni F, Surowiec B, Tcharkhtchi A. Multi-scale experimental investigation of the viscous nature of damage in Advanced Sheet Molding Compound (A-SMC) submitted to high strain rates. Compos Part B: Eng. 2016.
[18] Jendli Z, Fitoussi J, Meraghni F, Baptiste D. Anisotropic strain rate effects on the fibre–matrix interface decohesion in sheet moulding compound composites. Compos Sci Technol 2005;65(3–4):387–93.https://doi.org/10.1016/j.compscitech. 2004.09.027.
[19] Fitoussi J, Guo G, Baptiste D. A statistical micromechanical model of anisotropic damage for S.M.C. composites. Compos Sci Technol 1998;58(5):759–63. [20] Lee H. A computationnal approach to the investigation of impact damage evolution
in discontinously reinforcedfiber composite. Comput Mech 2001;127:504–12. [21] Despringre N, Chemisky Y, Bonnay K, Meraghni F. Micromechanical modeling of
damage and load transfer in particulate composites with partially debonded inter-face. Compos Struct 2016;155(1):77–88.https://doi.org/10.1016/j.compstruct. 2016.06.075.
[22] Guo G, Fitoussi J, Baptiste D. Modelling of damage behavior of a shortfiber re-inforced composite structure by thefinite element analysis using a micro-macro law. Int J Damage Mech 1997;6:278–99. 0803973233.
[23] Voyiadjis GZ, Taqieddin ZN, Kattan PI. Micromechanical approach to damage mechanics of composite materials with fabric tensors. Compos B Eng 2007;38(7-8):862–77.https://doi.org/10.1016/j.compositesb:2006.12.002.
[24] Voyiadjis GZ, Kattan PI. Mechanics of small damage infiber-reinforced composite materials. Compos Struct 2010;92:2187–93.https://doi.org/10.1016/j.compstruct. 2009.09.005.
[25] Maire JF, Chaboche JL. A new formulation of continuum damage mechanics (CDM) for composite materials. Aerosp Sci Technol 1997;4:241–51.https://doi.org/10. 1016/S1270-9638(97)90035-3.
[26] Kammoun S, Doghri I, Brassart L, Delannay L. Micromechanical modeling of the progressive failure in short glass-fiber reinforced thermoplastics - First Pseudo-Grain Damage model. Compos A Appl Sci Manuf 2015;73:166–75.https://doi.org/ 10.1016/j.compositesa.500 2015.02.017.
[27] Mori T, Tanaka K. Average stress in matrix and average elastic energy ofmaterials with misfitting inclusions. Acta Metall 1973;21:571–4.
[28] Desrumaux F, Meraghni F, Benzeggagh ML. Generalised Mori-Tanaka schemeto model anisotropic damage using numerical Eshelby tensor. J Compos Mater 2001;35:603–24.
[29] Laribi MA, Tamboura S, Fitoussi J, Tié Bi R, Tcharkhtchi A, Ben Dali H. Fast fatigue life prediction of shortfiber reinforced composites using a new hybrid damage approach: Application to SMC. Compos B Eng 2018;139:155–62.https://doi.org/ 10.1016/j.compositesb:2017.11.063.
[30] Jain Atul, Veas Jose M, Straesser Stefan, Van Paepegem Wim, Verpoest Ignaas, Lomov Stepan V. The Master SN curve approach– A hybrid multi-scale fatigue simulation of shortfiber reinforced composites. Compos Part A: Applied Sci Manufact 2016;91:510–8.https://doi.org/10.1016/j.compositesa:2015.11.038. [31] Marco Y, Masquelier I, Le Saux V, Charrier P. Fast prediction of the Wohler curve
from thermal measurements for a wide range of NR and SBR. Rubber Chem Technol September 2017;90(3):487–507.
[32] Marco Y, Huneau B, Masquelier I, Le Saux V, Charrier P. Prediction of fatigue properties of natural rubber based on the descriptions of the cracks population and of the dissipated energy. Polym Test 2017;59:67–74.
[33] Jain A, Van Paepegem W, Verpoest I, Lomov VS. A feasibility study of the Master SN curve approach for shortfiber reinforced composites. Int J Fatigue 2016;91:264–74. [34] Fitoussi J, Bocquet M, Meraghni F. Effect of the matrix behavior on the damage of ethylene–propylene glass fiber reinforced composite subjected to high strain rate tension. Compos B Eng 2013;45(1):1181–91.https://doi.org/10.1016/j. compositesb.2012.06.011.
[35] Degrieck J, Van Paepegem W. Fatigue damage modelling offibre-reinforced com-posite materials. Rev Appl Mech Rev 2001;54(4):279–300.
[36] Kachanov LM. On subcritical crack growth. Mech Res Commun 1976;3(1):51–4. [37] Sendeckyj G.P., 1991,‘Life Prediction for Resin-Matrix Composite Materials’, in
Composite Material Series, Vol. 4, 10. Amsterdam: Elsevier, pp. 431-483. [38] Shirinbayan M, Fitoussi J, Meraghni F, Surowiec B, Laribi M, Tcharkhtchi A.
Coupled effect of loading frequency and amplitude on the fatigue behavior of ad-vanced sheet molding compound (A- SMC). J Reinforced Plastics Compos (JRP) 2016.
[39] Advani Suresh G, Tucker III Charles L. The use of tensors to describe and predict fiber orientation in short fiber composites. J Rheol 1987;31(8):751–84.