HAL Id: tel-01079844
https://pastel.archives-ouvertes.fr/tel-01079844
Submitted on 3 Nov 2014HAL is a multi-disciplinary open access archive for the deposit and dissemination of sci-entific research documents, whether they are pub-lished or not. The documents may come from teaching and research institutions in France or abroad, or from public or private research centers.
L’archive ouverte pluridisciplinaire HAL, est destinée au dépôt et à la diffusion de documents scientifiques de niveau recherche, publiés ou non, émanant des établissements d’enseignement et de recherche français ou étrangers, des laboratoires publics ou privés.
Investing in energy use and production to mitigate and
to adapt to climate change
François Cohen
To cite this version:
François Cohen. Investing in energy use and production to mitigate and to adapt to climate change. Economics and Finance. Ecole Nationale Supérieure des Mines de Paris, 2014. English. �NNT : 2014ENMP0022�. �tel-01079844�
N°: 2009 ENAM XXXX
MINES ParisTech
Centre d’Economie Industrielle (CERNA) 60, Boulevard Saint-Michel – 75 006 Paris, FRANCE
THE SE
École doctorale n° 396 : Economie, Organisation, Société
présentée et soutenue publiquement par
François COHEN
le 26 septembre 2014Investir dans l’utilisation et la production d’énergie pour lutter
et s’adapter au changement climatique
Investing in energy use and production to mitigate
and to adapt to climate change
Doctorat ParisTech
T H È S E
pour obtenir le grade de docteur délivré par
l’École nationale supérieure des mines de Paris
Spécialité “ Economie et Finance ”
Directeur de thèse : Matthieu GLACHANT
T
H
È
S
E
JuryXavier Labandeira Professeur, Departamento de Economía Aplicada, Universidad de Vigo
Rapporteur
Claude Crampes Professeur, Institut d'Économie Industrielle, Toulouse School of Economics
Rapporteur
Olivier Chanel Directeur de recherche CNRS, Groupement de Recherche en
Économie Quantitative, Université d’Aix-Marseille Examinateur
Matthieu Glachant Professeur, CERNA, Mines ParisTech Examinateur
i
iii
Acknowledgments
This PhD dissertation has benefitted from the full support of many people whom I want to thank very much!
My PhD director, Matthieu Glachant, has provided me with plenty of ideas, comments, corrections and advice. It has been a great pleasure being his PhD student! I deeply thank him for granting me his full help and support during three very stimulating years.
Likewise, Magnus Söderberg, who has been involved in the two econometric projects integrated into this PhD dissertation, has given me hundreds of pieces of advice and I particularly thank him for his availability and sympathy.
Moreover, all this research would not have been possible without the Association Nationale
pour la Recherche Technologique who has believed in this project since the start and
provided the financial support that it needed.
I am also grateful to the Jury who has taken the time to examine this dissertation and provided me with very useful feedback.
Furthermore, I have been very well welcomed by all the members of CERNA and it has been a great pleasure working with them! I thank all the team of PhD candidates and Sesaria Ferreira.
The project managers, consultants, interns and administrative staff of BIO Intelligence Service deserve to be particularly thanked. It has been a great adventure working to improve the enforcement of domestic and EU environmental regulations. Above all, I thank Benoît Tinetti, Adrian Tan, Sylvain Sourisseau and Lorcan Lyons from whom I have learnt a lot.
I profoundly thank Professor Jean de Beir from the University of Evry for his active support.
I am very grateful to the UK Department for Food, Environment and Rural Affairs and the German company GfK as they allowed me to use the market data of Chapter 1.
iv
I also thank Fanny Fleuriot and the service Climat from the French Agency of Environment and Energy Management (ADEME) who have kindly accepted that I publish elements of the report entitled Bilan de l’évolution du parc électroménager français et évaluation bottom-up
des économies d’énergie depuis la labellisation énergétique des appareils.
Moreover, I want to express gratitude to Claire Barnett from AMEC and Niall Lawlor from Milieu, who have co-authored Chapter 3, along with Humberto Delgado Rosa, Thérèse Placek and Rosário Bento Pais from the Directorate-General for Climate Action of the European Commission who allowed me to publish it in the framework of my PhD.
I also thank Christine Lafrance and Philippe Ferreira from the Centre de Calcul et des
Systèmes d’Information of Mines ParisTech.
Moreover, my wonderful family and friends in France and Argentina have encouraged me to do this research and they helped me very much to go through all the stressful moments of uncertainty that are part of a PhD and a first work experience!
My wife has been my first supporter and I have asked her opinion many times. She furthermore had to be very patient when I had new ideas for my work in the middle of the night!
My mother and my father have been very supportive: they even went to purchase a new refrigerator! My grandmother has always been proud of my efforts and my work. My brother and my sister-in-law have been very kind and generous.
I have also received a lot of support and kindness from my Argentinean family and friends during all these years! I am deeply grateful to all of them.
I also thank the Bonneau family, who has seen me growing up and with whom I have shared very good moments!
I furthermore thank my friends from Paris, and especially Paula who has been very gentle and enthusiastic.
More generally, I thank all the people that collected and made data available from the American Housing Survey and at NOAA, along with the tens of thousands individuals who have spent hours filling survey forms between 1985 and 2011!
v
Preface
This PhD dissertation has been prepared in the framework of a Convention Industrielle de
Formation par la Recherche1 (CIFRE). The Convention was initiated by BIO Intelligence Service, a French private consultancy in environment, member of the Deloitte group. The consultancy hired me to undertake research in the ex ante assessment of environmental and energy policies. In the framework of the CIFRE, the consultancy and I have benefitted from the financial support of the Association Nationale pour la Recherche Technologique (ANRT) and we have asked Matthieu Glachant, from the Centre d’Economie Industrielle of Mines ParisTech, to supervise my work.
For BIO Intelligence Service, this research allowed improving its processes when assessing the ex ante impacts of energy and environmental policies for public authorities. As a research assistant for the company, I was offered the opportunity to acquire a good understanding of EU official processes and in-depth knowledge of the key environmental and energy issues of current political agenda. More concretely, I have worked on 16 socioeconomic studies and on most of the steps of any energy and environmental policy evaluation, from the consultation of stakeholders to the formulation of recommendations to monitor future policy enforcement.
The knowledge and skills capitalized at BIO Intelligence Service have been more than useful to formulate the research question covered with this PhD dissertation. Under the supervision of Matthieu Glachant and benefiting from Magnus Söderberg’s support, this PhD dissertation resorts to econometric methods to analyse market data and survey data with the objective of shedding light on consumer attitude towards energy efficiency. Furthermore, two of the chapters of this PhD dissertation were drafted as consultancy services delivered by BIO Intelligence Service to the French Agency of Environment and Energy Management (ADEME) and the Directorate-General for Climate Action of the European Commission (DG CLIMA).
1
vii
Table of contents
Introduction ... 1
Investing in Energy Efficiency for Climate Change Mitigation: the Case of Domestic Appliances... 2
The Impacts of Climate Change on Energy Investment Behaviour ... 6
PART I. Investing in Energy Efficiency for Climate Change Mitigation: the Case of Domestic Appliances ... 9
Chapter 1. The Impact of Energy Prices on Energy Efficiency: Evidence from the UK Refrigerator Market ... 9
Abstract... 9
Acknowledgements ... 10
Résumé du chapitre 1 en français ... 11
1. Introduction ... 13
2. Related literature ... 17
3. Conceptual framework ... 19
4. Data ... 28
5. Results ... 32
6. A simulation of electricity price increase... 35
7. Conclusion... 40
Chapter 2: Impacts and Monitoring of the EU Policy on the Energy Labelling of Domestic Appliances ... 41
Abstract... 41
Résumé du chapitre 2 en français ... 42
1. General presentation of the EU Energy Label ... 43
2. Expected effects of an energy label ... 44
3. The determinants of success ... 47
4. Maximizing the effectiveness of the energy label ... 52
5. Conclusion... 56
PART II. The Impacts of Climate Change on Energy Investment Behaviour ... 57
Chapter 3: Decision-Making in the Electricity Sector under Climate Uncertainty: a Literature Review... 57
Abstract... 57
Résumé du chapitre 3 en français ... 58
1. Introduction ... 59
2. The electricity sector in the EU ... 60
3. Climate change and the electricity sector ... 65
4. Drivers for investment in the electricity sector ... 75
5. Decision-making methods under uncertainty applicable to the electricity sector ... 78
6. Conclusion... 86
Chapter 4: Adaptation to Climate Change and US Residential Energy Use – Does Adaptation Reduce Greenhouse Gas Emissions? ... 87
Abstract... 87
Résumé du chapitre 4 en français ... 88
1. Introduction ... 89
2. Model ... 93
viii
4. Model results ... 112
5. Implications of model results for GHG emissions and US residential energy consumption ... 119 6. Conclusion ... 125 General conclusions ... 127 Bibliography ... 131 Introduction ... 131 Chapter 1 ... 132 Chapter 2 ... 135 Chapter 3 ... 136 Chapter 4 ... 138 Appendices ... 143
Appendix A: Complementary Tables of Chapter 1 ... 143
A1. Alternative choices for the nests ... 143
A2. Construction of the instruments for the sales equation ... 144
A3. Linear specification ... 146
A4. Implied discount rate ... 148
A5. Results using standard hedonic pricing method ... 149
A6. An alternative price equation ... 150
A7. Different assumptions for electricity prices ... 151
A8. Different assumptions for appliance lifetimes ... 152
A9. Electricity price expectations with the ARIMA model ... 153
Appendix B: Monitoring Indicators for the Energy Label ... 155
B1. Increasing awareness among consumers at the same time ... 155
B2. Matching displayed and real energy savings ... 157
B3. Visibility of the energy label ... 158
B4. Competitive and proactive markets ... 159
Appendix C: Complementary tables and figures of Chapter 4 ... 161
C1. Example of test specifications related to the inclusion of interaction parameters 161 C2. Example of linear regressions used to predict electricity and gas prices in the home improvement model ... 163
1
Introduction
The fifth report of the Intergovernmental Panel on Climate Change (IPCC, 2013) estimates that global mean surface temperature could be up to 4.8°C higher in 2081-2100 relative to 1896-2005 if greenhouse gas emissions (GHG) continue unabated. Climate change could not only have impacts on eco-systems, but also on all the matters of human activities, including food availability, human settlements, public health and water availability and quality along with industrial and economic activities.
This PhD dissertation aims to understand how energy-related investment decisions will contribute to climate change mitigation and adaptation, defined as all the adjustments “in natural or human systems in response to actual or expected climate stimuli or their effects, which moderates harm or exploits beneficial opportunities” (IPCC, 2001). It focuses principally on the residential sector, which represented the non-negligible share of 24.7% of final EU energy consumption (29% of electricity consumption) in 2011 (Eurostat, 2013) and in which the main decision makers are households whose investment behaviour arguably differs from that of corporations, a pattern that should influence policy design.
This PhD dissertation is divided into two parts and four papers. Although, the papers deal with related issues, each can be read on its own. Importantly, their nature is different. Two of them are research papers which seek to contribute to the economic literature on investment behaviour in energy activities. The other two are policy-oriented. They review the academic and policy literature in order to derive policy lessons for regulators.
The first part looks at energy efficiency investments as a way to mitigate climate change, taking domestic appliances as a case study. It is composed of two chapters. Chapter 1 is about consumer behaviour and the impact of energy prices on the energy efficiency of sold appliances whereas Chapter 2 is a policy paper dealing with the impacts and the implementation of the EU Energy Label. The second part of this PhD dissertation also includes two chapters and focuses on the impacts of climate change on energy investment behaviour. Chapter 3 is a policy-oriented review of the literature on climate vulnerability and adaptation to climate change of electricity supply. Chapter 4 looks at how homeowners adapt their dwellings to climate change using microdata from 1985-2011. We briefly present below each part of this PhD dissertation and our contribution to the existing literature.
2
Investing in Energy Efficiency for Climate Change
Mitigation: the Case of Domestic Appliances
Energy production and consumption are responsible for the great majority of worldwide GHG emissions. They are consequently the principal focus of mitigation policies. Energy efficiency is of particular importance as decarbonising energy production has certain limits. Existing energy infrastructures relying on fossil fuels cannot easily be swapped with renewable sources of energy due to high replacement costs. Moreover, the intermittency of renewable sources of energy (i.e. wind and solar) makes it difficult to raise their share in the energy mix without damaging energy security.
The focus of our study on domestic appliances may be justified on several grounds. First, domestic appliances are responsible for a large share of the energy consumed by households: 16% of the energy consumed in the residential sector and more than 60% of residential electricity consumption in 2009 (Enerdata, 2010).2 Moreover, the potential for energy efficiency improvements is high: for example, an energy efficient refrigerator can be five times less consuming as an energy inefficient one.3 There are various market failures that may hinder the diffusion of energy efficient domestic appliances. Finally, these products have benefitted from a large scale information-based policy since 1995: the EU Energy Label.
Numerous policies are being implemented in order to promote energy conservation. In the EU, the MURE database4 registers around 550 energy efficiency policies that have been or are currently implemented in the European Union, targeting households, transports, industry or the service sector. These policies all contribute to the objective set by the EU to reduce primary energy demand by 20% in 2020 as compared with a “no policy” scenario. In the US, the energy efficiency programs implemented at State level or municipal level is backed up by federal regulations and commitments. For instance, the National Energy Conservation Policy Act was implemented in 1978 and has frequently been updated.
2 Most of the energy consumed in the residential sector is used for space heating (67% in 2009). Apart from domestic appliances and lighting, the other uses are water heating (13%) and cooking (5%). 3 This ratio is based on the difference in energy efficiency rating between an “A+++” labelled refrigerator and a “D” rated appliance.
4
3
Evidence from the EU however suggests that these policy efforts may not be sufficient. A midway assessment has revealed that the EU was only to reach half of his objective of a 20% reduction in primary energy demand unless additional efforts are made (European Commission, 2011b). This calls for the reinforcement of existing instruments and/or the introduction of new ones. In October 2012, the European Commission adopted a new Directive on Energy Efficiency with provisions for both end-use sectors and energy supply (European Commission, 2012), requiring Member States to establish national energy efficiency schemes and to put more emphasis on increasing energy efficiency in buildings. In the case of domestic appliances, increasing their average energy efficiency could reduce substantially residential energy consumption because consumers have the choice between appliances with very different energy efficiency levels.
It is often argued that these policies should mitigate two market failures (Allcott and Greenstone, 2012): imperfect information on energy performance and cognitive constraints on one side; and negative externalities on the other.
Imperfect information arises because energy efficiency is not directly observable by the buyer at the time of purchase. As such, the lack of information on energy costs could hinder consumers’ evaluation of the energy costs of domestic appliances. Therefore, informing consumers about energy efficiency and energy savings constitutes a necessary step to market transformation. However, even when consumers can access information, it is often argued that they do not compute the expected and discounted energy savings of their energy efficiency investments in a perfectly rational manner. Other cognitive constraints would lead informed consumers to undervalue energy costs. The externality problem is more general: energy production and use generate health and environmental costs which needs to be properly internalized in energy prices.
The first paper of this PhD dissertation evaluates how energy efficiency of appliances is affected by energy prices. It tests if consumers’ purchases of energy efficient appliances under-react to an energy price increase, principally because they would be myopic. To do so, we perform an econometric analysis on sales data of the UK market for refrigerators between 2002 and 2007, at a time when the EU Energy Label was already a mature policy and consumers knew about the energy consumption of the products that they were buying.
Since the 1980s, many scholars and policy-makers have argued that an “energy efficiency gap” could exist (Jaffe and Stavins, 1994), meaning that privately profitable investments in
4
energy efficiency were not performed in practice by households and firms. The indication of an energy efficiency gap had been provided by various empirical estimations of implicit
discount rates, the rates consumers and firms would be applying when purchasing
energy-using products to weigh up future energy costs. Estimates reported for refrigerators ranged from 39% to 300% (Revelt and Train, 1998; Hwang et al., 1994; McRae, 1985; Meier and Whittier, 1983; Gately, 1980; Cole and Fuller, 1980); for air conditioners between 19% to 77% (Matsumoto, 2012; Train and Atherton, 1995; Hausman, 1979; Kooreman, 1995); and for water heaters between 67% and 84% (Hwang et al., 1994; Goett and McFadden, 1982).
Various reasons have been given to the energy efficiency gap in the case of appliances. The most frequently cited market failure is consumers’ lack of information about energy efficiency or consumptions leading them to undervalue energy costs. In this respect, Newell, Jaffe, and Stavins (1999) show that the provision of information to consumers has an impact on consumers’ sensibility to energy prices at the moment of purchasing room air conditioners and water heaters: informing consumers would therefore contribute to rationalize their choices towards more energy efficient products.
From a methodological perspective, the estimations of the implicit discount rate cited above have been made on a cross-section of products, by comparing their purchase price to their expected future energy costs while controlling for other observed product features. The major drawback of such estimations is that they cannot control for unobserved differences in the products that could be correlated with energy efficiency. Would there be such unobservables, the estimates of the implicit discount rates with such methods would be biased.
Panel data methods can control for time-invariant unobservables by construction. Allcott and Wozny (2011), Sallee, West, and Fan (2011) and Busse, Knittel, and Zettelmeyer (2012) have applied such methods on data from the automobile market and found that consumers’ myopia could be much smaller than previously estimated. However, all these contributions have been conducted on cars, which is a relatively complex good to analyse. In particular, consumers can adapt their gasoline consumption to prices and these authors must therefore rely on assumptions regarding consumer use of cars to properly evaluate the energy efficiency gap.
With our data and a panel data econometric method, we find that there is an energy efficiency gap, as consumers would underestimate energy costs by about 35%. However, like
5
in the studies on the automobile market, this energy efficiency gap is much smaller than what was previously estimated. The corresponding implicit discount rate that we find is around 8.7%.
Furthermore, we are able to quantify the impact of another mechanism that could widen the energy efficiency gap. Our econometric setting allows us to analyse both demand responses to energy price shocks and supply responses. We find that suppliers almost completely absorb energy price shocks by reducing more the price of energy inefficient appliances than the price of energy efficient ones. This asymmetric price response obviously reduces the consumer benefit of swapping for energy-efficient refrigerators. In the short run, almost all the energy savings from demand-side adjustments are compensated for. This is only in the long run that electricity price increases lead to energy savings as manufacturers progressively adapt to higher energy prices by launching new, more energy efficient products.
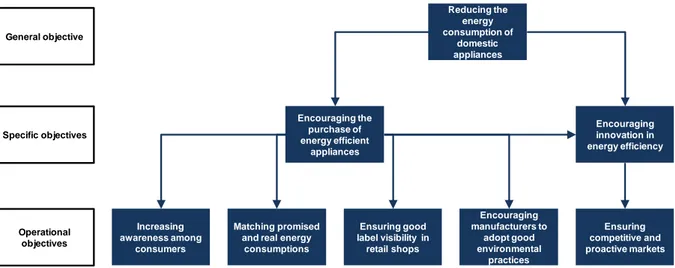
The second chapter of this PhD dissertation is a policy note that was part of a larger report for the French Agency of Environment and Energy Management. It looks at the main information-based policy that applies to domestic appliances in the EU: the EU energy label. Launched in 1995, the EU Energy Label makes compulsory the presentation of energy efficiency and energy use features on each appliance sold on the market. Whereas suppliers must provide a standardized energy label to dealers, the latter must put the label on a visible part of each appliance they sell. On the label, appliances have been ranked on a coloured scale from A+++ (very efficient) to G (very inefficient) making the identification of energy efficient appliances much simpler for consumers. The starting point of this chapter is that the EU Energy Label has become increasingly popular and today’s consumers can know about the energy efficiency of main appliances when purchasing a new one in the EU. However, our analysis suggests that the effectiveness of the EU energy label does not solely depend on popularity, but on a list of key factors of success, including primarily that promised energy savings on the labels correspond to real energy consumptions. We conclude with suggesting indicators for policy-makers to monitor the Energy Label, and encourage them to intensify the controls on the accuracy of the energy label with the effective energy consumption of sold appliances.
6
The Impacts of Climate Change on Energy
Investment Behaviour
Energy-related investments have more often been studied for their potential for climate change mitigation than for their relevance for adaptation. However, energy systems are sensitive to climate constraints and global warming may substantially affect local conditions of energy production and use. For example, the cooling of conventional and nuclear power plants may become problematic if river waters are warmer (IPCC, 2007). In the residential sector, energy is principally used for space heating and air-conditioning. Households will therefore necessarily adapt their energy consumption to any change in climate. The use of air-conditioning to adapt to excessive heat in summer would increase. In this context, energy consumption could rise in some regions due to global warming (for example electricity in California, as studied by Auffhammer and Aroonruengsawat, 2011).
Chapter 3 is a policy paper that investigates to what extent current investors take into account future climate change in their long-run investment decisions. Based on a review of the existing literature, we draw the list of the various parameters that will affect electricity transmission and generation before presenting the decision-making tools currently available that could be used by the electric sector in the perspective of adaptation to climate change. Our literature review suggests that decision-making tools are available to investors to properly account for climate change in their long-run investment decisions. Therefore, their effective use mostly depends on increasing investors’ awareness on the potential impact of climate change on the energy system.
Furthermore, we argue that a better understanding of consumer attitudes towards weatherization is particularly relevant to understand climate change adaptation and its impacts.
Chapter 4 is an academic paper which studies the effect of household adaptation to climate change on residential gas and electricity consumption. Our research is based on data from 14 waves of the American Housing Survey (1985-2011) that have been matched with temperature and precipitation data from the National Oceanographic and Atmospheric
7
Administration covering 159 areas in the US. We adopt a two-stage approach. In the first stage, we assess long run adaptations by analysing how sensitive household decisions to perform home improvements are in relation to climate change. In the second stage, we run econometric equations of individual electricity and gas consumptions in which we take into account the likely changes in housing resulting from climate change.
The results of the econometric analysis suggest that adaptation to climate change from households will shift demand from gas to electricity. This is likely to be due to the increased need for air-conditioning, but also to the reduced use of gas heaters. In a simulation of residential energy demand, we predict that overall energy demand should decrease by 1.9% in the US assuming a 1°F inland average temperature increase. However, because electricity is more carbon-intensive that gas, GHG emissions could increase slightly due to adaptation to climate change if current methods of generation were used to produce electricity. We therefore conclude that the shift from gas to electricity resulting from climate change in residential housing constitutes an additional motivation for reducing the carbon footprint of US electricity.
Compared to other sectors, agriculture and food supply in particular, adaptation in the residential sector has been much less studied. Deschênes and Greenstone (2011) and Auffhammer and Aroonruengsawat (2011) have shown that electricity demand should be rising in the US due to climate change. They claim that this would be due to an increased utilisation of air-conditioning in summer. However, these two studies focus on the correlation between changes in temperatures and changes in energy consumption, and therefore do not directly look at the adaptations of the housing stock (including air-conditioning) that may lead to higher electricity consumptions. Even though air-conditioning is likely to be the main reason that explain a surge in electricity use (Sailor and Pavlova, 2003), it is unclear if the increase in electricity demand would be caused by the installation of new conditioners or the more intensive use of the existing ones. Furthermore, air-conditioning is not the only adaptation measure available to households that could lead to an increase in electricity demand: consumer may also prefer to install electric heaters instead of gas heaters if temperatures increase. Their operating costs are higher but their installation is cheaper, so that they fit well in regions in which heating needs are moderate (Mansur, Mendelsohn and Morrison, 2008).
The main contribution of chapter 4 is exploring the reasons behind the relationship between climate and energy use. We control for three types of investments in housing (major heating
8
and air-conditioning equipment; energy integrity; and other home improvements) and distinguish between the changes in energy consumption imputable to changes in intensity in use and the ones imputable to adaptations of the housing stock. We find that the decrease in the use of gas would very likely be due to changes in the equipment installed whereas the more intensive use of already installed air-conditioners could drive electricity consumption upwards on its own. To our knowledge, Chapter 4 constitutes the first attempt to assess both long run adaptation and short run responses in terms of energy demand to evaluate the impact of household adaptation on energy use and GHG emissions from residential energy consumption.
In the end, the findings of the second part of this PhD dissertation are that increasing awareness about the potential impacts of climate change on the energy system is necessary for both suppliers and consumers of energy. In particular, various climate change adaptation strategies may exist, some putting more stress on the energy system (e.g. air-conditioning in the residential sector) than others (e.g. insulation). Our recommendation to policy-makers is that they encourage adaptations that can levy the burden that climate change will put on energy production and use, but also that they anticipate a higher demand for electricity and reduce the carbon footprint of its generation.
9
PART I. Investing in Energy Efficiency for
Climate Change Mitigation: the Case of
Domestic Appliances
Chapter 1. The Impact of Energy Prices on Energy
Efficiency: Evidence from the UK Refrigerator
Market
François Cohen, Matthieu Glachant, and Magnus Söderberg
Abstract
We use product-level panel data describing the UK refrigerator market from 2002 to 2007 to measure the impact of energy prices on energy use. The analysis deals with both demand-side and supply-demand-side adjustments occurring in the market when the electricity price increases. That is, the short term response of consumers who modify their purchase behavior; the mid-term response of manufacturers/retailers which revise their price, and the long-term response of manufacturers which change product characteristics. We find a modest long-term elasticity of -0.09. This is driven by two inefficiencies. First, consumers undervalue the savings from energy efficient refrigerators by 35%. This means a moderate consumer myopia as the implicit discount rate is 8.7%. Second, nearly two-third of the increase in energy costs (almost all the costs as perceived by consumers) is compensated for by suppliers through relatively larger price reductions of highly energy consuming products in the mid-term. This finding calls for moving attention in the energy efficiency debate to the pricing behavior of manufacturers of durables.
Keywords: Energy Efficiency, Consumer Myopia, Energy Prices. JEL Codes: D12, L68, Q41.
10
Acknowledgements
The authors thank the Department for Environment, Food and Rural Affairs (Defra) along with GfK Retail & Technology for providing the data necessary to this research. We are also indebted to Adrian Tan and Roger Salmons for their encouragements to perform academic research based on the results of the consultancy project “Impacts of Innovation on the Regulatory Costs of Energy-using Product Policy” carried out by the Policy Studies Institute and BIO Intelligence Service for Defra. We also thank William Pizer for his comments. Finally, we have benefited from seminar presentations at the International Workshop on Natural Resources, Environment, Urban Economics, International Trade and Industrial Organization in Saint Petersburg (2-4 October 2013), at the Paris Environmental and Energy Economics Seminar (19 December 2013) and at the World Congress of Environmental and Resource Economists (Istanbul, 28 June – 2 July 2014) and thank all the attendees for their comments.
11
Résumé du chapitre 1 en français
A partir de données de panel qui décrivent les produits vendus sur le marché des réfrigérateurs entre 2002 et 2007, nous mesurons l’impact des prix de l’électricité sur la consommation électrique des produits. Cette analyse prend en compte tant les ajustements de la demande que ceux de l’offre qui se produisent sur le marché lorsque les prix de l’électricité augmentent. Nous évaluons ainsi la réponse à court terme des consommateurs qui modifient leurs comportements d’achat ; la réponse à moyen terme des producteurs/revendeurs qui révisent leurs prix ; et la réponse à long terme des fabricants qui modifient les caractéristiques des produits vendus. Nous trouvons une élasticité modeste de -0.09 à long terme. Ce résultat est l’effet de deux défaillances. Premièrement, les consommateurs sous-estiment de 35% les économies d’énergie des réfrigérateurs efficaces sur le plan énergétique. Cela signifie qu’ils ont un comportement d’achat favorisant modérément le court terme, correspondant à un taux d’actualisation implicite de 8.7%. Parallèlement, un peu moins des deux-tiers des hausses des coûts d’utilisation des appareils (presque l’intégralité des coûts tels que perçus par les consommateurs) sont compensées par des réductions de prix plus importantes sur les produits les moins efficaces à moyen terme. Ce résultat encourage à prêter plus attention aux stratégies de prix des fabricants et des vendeurs de biens durables dans le cadre du débat sur l’amélioration de l’efficacité énergétique des produits utilisés par les consommateurs.
12
13
1. Introduction
In policy circles, it is common to believe that there exists an “energy efficiency gap” between the socially optimal level of energy consumption and observed consumption. At the international level, the International Energy Agency has been particularly active in disseminating this idea (see for instance, IEA, 2007, Ryan et al., 2011). Since a seminal paper by Hausman (1979) and the discussion of possible policy implications by Jaffe and Stavins (1994), it has also attracted considerable interest in the academic literature as shown in the recent survey by Gillinghan and Palmer (2014).
As explained by Allcott and Greenstone (2012), there are two potential reasons why public intervention can improve social welfare in this area. The first is the classical externality problem: the production and consumption of energy, in particular of fossil fuels, generate major environmental and health externalities which could be mitigated by policies promoting energy conservation. The second is due to imperfect information and other cognitive constraints that could lead economic agents to discard privately profitable investments that may limit energy use, in particular households and small businesses that have limited time and resources to evaluate infrequent decisions. Allcott and Greenstone (2012) refer to the latter type of failures as “investment inefficiencies”.5 They are particularly intriguing as they suggest the existence of win-win options entailing both economic and environmental benefits. In practice, energy efficiency choices fundamentally involve decisions that trade off an upfront cost – the purchase of an energy-efficient refrigerator, a fuel efficient car, the installation of insulation – and a stream of uncertain and future benefits induced by lower energy consumption. The choice is then inefficient if, in the eyes of an external observer, the decision maker gives non-optimal weight to the upfront cost relative to future energy costs. If the decision maker gives too high weight to the upfront cost, s/he is myopic or, expressed differently, the implicit discount rate used to calculate the net present value of the investment is too high.
The potential existence of investment inefficiencies has important policy implications (Allcott and Greenstone, 2012; Gillingham and Palmer, 2014; Verboven, 2002, Li et al., 2009). The most important one is that energy price increases induced by energy taxation and other instruments like emissions trading are likely to have limited impacts on residential
5 The nature of the underlying causes of investment inefficiencies is extensively discussed by Gillingham and Palmer (2014).
14
energy use if households underestimate the size of future energy costs. Accordingly, they constitute a major justification for numerous real-world policies that target the market of energy-using durables such as investment subsidies that encourage the purchase of water heaters and the installation of insulation in dwellings and regulatory standards mandating a minimal level of energy or environmental performances of new motor vehicles like the EURO norms in Europe or the US-equivalent CAFE standards, building energy codes... They also plead in favor of energy labeling to improve consumer information.
The starting point of the present paper is the observation that the academic literature on the energy efficiency gap mostly concentrates on consumer behavior as illustrated by the recent review by Allcott and Greenstone (2012) and Gillinghan and Palmer (2014)6. We believe, and we will actually show, that what occurs on the supply side of the markets of energy-using durables is equally important. Consider, for concreteness, the case of refrigerators which will be studied in this paper. An increase in energy price reduces consumer utility and thus induces a negative shock on demand in the refrigerator market. In that case, the theory of industrial organization predicts that suppliers (manufacturers and/or retailers) will adjust their prices. More precisely, as refrigerators are differentiated goods, the price of models with poor energy performance is expected to decrease, while that of energy-efficient models will decrease less or can even increase if the total demand for refrigerators is sufficiently inelastic. Importantly, the fact that this price response is asymmetric – producers subsidize inefficient models in relative terms – damages energy efficiency as it reduces consumer incentives to shift to efficient models. This is not the end of the story, though; producers will also modify their product offer by launching new energy efficient models and withdrawing inefficient ones. A full understanding of the impact of energy prices on energy use requires taking into account all these adjustments.
In this paper, we use product-level panel data describing the UK refrigerator market from 2002 to 2007 to measure the impact of energy prices on energy use of sold appliances. Our distinctive contribution is to analyze the entire sequence of adjustments. We thus provide answers to three questions: On the demand-side, how large are investment inefficiencies? On the supply side, how large are refrigerator price adjustments when the electricity price changes? And how large are adjustments of product offers? By answering these questions
6 A remarkable exception is a theoretical analysis by Fischer (2005) who stresses the importance of the supply side factors (including innovation) when designing policy to promote energy efficiency of household appliances.
15
and measuring the different impacts, we will also be able to assess the importance of investment inefficiencies relative to supply-side issues.
Methodologically, we develop a very simple discrete choice with differentiated quality à la Berry (1994) to describe demand and rely on first-difference panel data methods that allow us to control for time-invariant unobserved product attributes. We also control for product segmentation caused by product differentiation with a nested logit framework and address endogeneity concerns arising from refrigerators’ prices and quantities being simultaneously determined. Price and product offer adjustments responses are estimated using reduced-form equations which impose less restrictions on how competition operates in this market. More specifically, we use first differences to estimate the impact of electricity price shocks on retail prices. To estimate how product offer is influenced by electricity prices, we take advantage of the fact that we observe in the data when a given model enters the market and when it exits (in the case where this occurs over the study period 2002-2007). We then estimate a dynamic fixed effect probit model by using the method of Wooldridge (2005).
Refrigerators constitute a suitable case to explore these questions, in particular compared to motor vehicles which have recently been the subject of a lot of research on the impact of gasoline prices (e.g., Allcott and Wozny, 2014; Busse et al., 2013, Anderson et al., 2013). To start with, consumers cannot adjust energy consumption after purchase contrary to car drivers who choose how much they will drive.7 As a result, future energy consumption is exogenously determined by the characteristics of the product. This suppresses an important source of biases and of measurement errors. A second advantage is that there is no market for used cold appliances. This is obviously not the case for cars and empirical analysis therefore needs to develop complex solutions and/or make several assumptions to deal with this issue. See for instance Li et al. (2009) or Allcott and Wozny (2013) who only examine the impact of gasoline prices on the second-hand market. Third, the product is simple compared to cars and less subject to subjective feelings. This is a major benefit as dealing with taste shocks and unobserved product characteristics, that tend to be correlated with energy performance, is a major methodological difficulty. Note also that energy labelling is mandatory since 1995 for all refrigerators sold in the European Union, meaning that information asymmetry on energy performance is partly mitigated.
7 A consequence is that there is no “rebound effect” in this case. The work by Sallee, West, and Fan (2009) is an example of effective efforts to circumvent that problem with controls for odometer readings.
16
In our base specification, we estimate that consumers underestimate future energy savings by 35%. Even though this clearly indicates investment inefficiencies, their size is reasonable as it implies an implicit discount rate of 8.7%. There are several methodological reasons why our implicit discount rate is lower compared to what has been reported previously (from 39% to 300%, see the literature review in Section 2). The most important one is that we rely on panel data that allows better controls of unobserved product characteristics. In this respect, when using a hedonic pricing model on a cross section of models, the approach adopted by Hausman for instance (1979), we find a discount rate of 72%. Recent studies on cars using panel data also find rates of magnitude similar to ours (for instance, see Allcott and Wozny, 2014).
But as argued before, the most significant contribution of the paper is to estimate both demand- and supply-side effects. We confirm the theoretical prediction of an asymmetric price response to electricity price increases with producers decrease less the price of energy-inefficient models than that of efficient models. We also find a significant impact of electricity prices on the probability for a given model to be supplied in the market.
We are then able to calculate the relative size of the different demand and supply adjustments. More precisely, we use our estimates to simulate the impact of an increase in electricity price on the average annual electricity consumption of sold appliances. The simulation includes three stages: first, we predict the impact of electricity price shocks on purchasing decisions, holding the purchase price and the set of products available in the market constant. Second, we predict the impact of electricity price increases on the refrigerator purchase prices and adjust market shares accordingly. Third, we correct the market shares of commercialized products according to their probability of being commercialized, which we estimate with our probit model on product offer.
We find that, holding constant the supply behaviour, a 10% electricity price increase on demand induces a 3.2% decrease in energy use. In the second stage, price adjustments lead to almost cancel this impact – reduction falls down to 0.04% - as producers cushion the impact of electricity price changes by subsidizing selectively the least efficient products. Note that this effect would not occur if the refrigerator market was perfectly competitive. Under perfect competition, prices are equal to marginal production costs, implying zero price adjustments if marginal costs are constant, which sounds a reasonable assumption as our scenario does modify drastically the quantities produced. In the third stage, producers
17
however partly compensate this impact by offering more energy-efficient models in the market, leading to a long-term reduction of energy use of 0.9%.
What lessons can be drawn from these figures? To start with, the inefficiencies due to consumer myopia and imperfect competition are far from being negligible: in the absence of consumer myopia and price adjustments, the long run reduction would be 7.1%, that is, seven times larger. We also able calculate the size of each inefficiency by simulating a scenario where only one of each is present. The simulation shows that imperfect competition reduces more the effectiveness of energy price increases than myopia: The long term impact of energy use would -1.5% if consumers were perfectly rational under perfect competition while it would be – 4.5% with myopic consumers under imperfect competition. Supply-side issues cannot be ignored when analysing the links between energy efficiency and energy prices.
As inefficiencies are sizeable, this calls for complementing policy solutions based on energy price changes (e.g., energy taxation) with other instruments. The focus on demand is then clearly not sufficient when designing the policy mix. As an illustration, energy labelling can constitute a (partial) solution to demand-side failures, but it does not mitigate the asymmetric pricing problem. It can even exacerbate it as producers have more incentives to subsidize inefficient models if consumers pay more attention to energy efficiency. Going further by evaluating the welfare properties of the different policy options is clearly beyond the scope of this paper, in particular because we use reduced-form supply equations. In any case, our results suggest that focusing on demand behavior and consumer surplus is not sufficient to derive robust policy recommendations.
The rest of this paper is structured as follows. In the following section, we briefly review the literature. In Section 3, we develop a conceptual framework and address identification issues. Section 4 presents the data. We then present and interpret the estimated results in the following section. In Section 6, we run simulations to predict the impacts of a 10% increase of the price of electricity. In Section 7 we summarize our findings and formulate policy implications.
2. Related literature
The empirical literature on the impact of energy prices on energy efficiency is well developed. To the best of our knowledge, there exists however no work which studies the
18
impact of energy price changes on the entire sequence of demand and supply responses (quantity, price, and innovation).
As explained above, the majority of the papers focus on demand and consumer myopia. Following the work of Hausman (1979) on room air conditioners, earlier research found implicit discount rates that are substantially larger than real financial discount rates. In the case of electric appliances, rates reported for refrigerators range from 39% to 300% (Revelt and Train, 1998; Hwang et al., 1994; McRae, 1985; Meier and Whittier, 1983; Gately, 1980; Cole and Fuller, 1980); for air conditioners between 19% to 77% (Matsumoto, 2012; Train and Atherton, 1995; Hausman, 1979; Kooreman, 1995); and for water heaters between 67% and 84% (Hwang et al., 1994; Goett and McFadden, 1982).
Most recent works lead to revise downward these estimates. For refrigerators, Tsvetanov and Segerson (2014) find discount rates in the range 13-22% in a paper which looks at the impact on consumer surplus of energy labeling. The same pattern is found in recent papers dealing with gasoline prices and fuel efficiency. Allcott and Wozny (2014) whose methodological approach is similar to ours find a discount rate of 16%; Busse et al. (2013) produce several estimates under different assumptions, none of these exceed 20% and many are close to zero. The same pattern is found by Goldberg (1998). As evoked above, the main difference between these new results and the earlier literature is the use of panel data which allows controlling some of the unobserved product characteristics that tend to be correlated with energy performance.
A few papers look both at price and quantity adjustments. An example is the recent paper by Houde (2014a) on the producer and consumer response to energy labeling in the US refrigerator market. Busse et al. (2013)’s work on the car market examine both the level of the discount rate and the price response of car manufacturers and retailers to gasoline price changes. Interestingly, they show that the price adjustment is much higher in the used car market than in the market for new cars. Verboven (2002) is primarily concerned by the pricing behavior of car manufacturers.
Finally, there is a significant literature looking specifically at the impact of energy prices on innovation. A good example is the work by Jaffe et al. (1999) on energy-using consumer durables or by Popp (2002).
Why is it then useful to combine the study of all adjustments as we do in this paper? The answer is very simple: it allows an assessment of the relative importance of the different
19
issues. Among other things, it then shows that the usual focus on demand and consumer myopia is far too partial to get a full understanding on how energy prices influence energy use and the policy solutions that can be introduced to complement energy taxation.
3. Conceptual framework
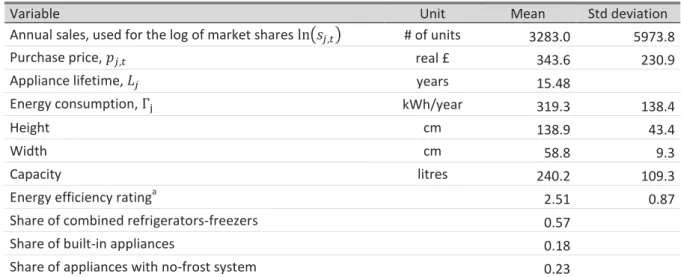
A simple modelTo begin with, we develop a simple discrete choice model of the refrigerator market derived from Berry (1994) to describe demand. There are T markets, each representing the UK refrigerator market during year t (with t = 1,…,T). For each market, we observe aggregate quantities sold, average prices, and product characteristics for J models of refrigerators.
Consumers choose the product that maximizes utility. The indirect utility function of consumer i purchasing a new refrigerator j in year t is equal to 𝑈𝑖𝑗𝑡= 𝑉𝑗𝑡+ 𝜖𝑖𝑗𝑡 where 𝑉𝑗𝑡 is the average utility and 𝜖𝑖𝑗𝑡 is consumer i’s unobserved heterogeneity that captures deviation from the average. The average utility8 is:
𝑉𝑗𝑡= 𝑢𝑗𝑡− 𝛼(𝑝𝑗𝑡+ γ𝐶𝑗𝑡)
In this expression, 𝑢𝑗𝑡 captures the value of usage of the refrigerator j over its lifetime which depends on product characteristics such as size, whether the fridge is built-in or freestanding. 𝑝𝑗𝑡 is its purchase price, 𝐶𝑗𝑡 is the discounted electricity cost of the product. 𝐶𝑗𝑡 has a negative impact on 𝑉𝑗𝑡 which is proportional to 𝛼, the marginal utility of money, and a parameter γ, which captures consumers’ perceptions about energy costs. If they are perfectly rational, we have γ = 1. If myopic, it is expected that they underestimate the disutility from energy costs so that γ < 1. Estimating this parameter is one crucial objective of the paper.9
8
This form of the indirect utility can be derived from a quasilinear utility function, which is free of wealth effects. This is a reasonable assumption for refrigerators, which usually represents a tiny share of individual income.
9
Here, the modeling strategy is to adopt the standard rational choice model, except but the parameter γ. An alternative approach could be to adopt a behavioral economics framework, but this will prevent the measurement of efficiency gap, which is just exactly the gap between actual behavior and perfect rationality. This approach is for example developed by Segerson and Tsvetanov (2014).
20
Next we decompose the value of usage in two additively separable terms: 𝑢𝑗𝑡= 𝑢𝑗+ 𝜉𝑗𝑡 where 𝜉𝑗𝑡 captures the time-varying component of the valuation of observed and unobserved product characteristics. Hence, we have:
𝑉𝑗𝑡 = 𝑢𝑗− 𝛼(𝑝𝑗𝑡+ γ𝐶𝑗𝑡) + 𝜉𝑗𝑡 Berry (1994) generalises McFadden’s (1973)’s discrete-choice demand model by transforming the logit model into a linear model that can be estimated with market-level data. In Berry’s framework the probability good j is purchased asymptotically corresponds to its market share at time t. Hence:
𝑠𝑗𝑡 ≡ 𝑒𝑉𝑗𝑡 ∑𝑘≠𝑗𝑒𝑉𝑘𝑡
A consumer can also choose an outside option indexed 0 that consists in purchasing no refrigerator. Normalizing its utility 𝑉𝑖0𝑡 to zero, the market share of product j at time t can be compared with the market share of the outside good so that 𝑠𝑗𝑡/𝑠0𝑡 = 𝑒𝑉𝑗𝑡. In logs, this simplifies to ln(𝑠𝑗𝑡) − ln(𝑠0𝑡) = 𝑉𝑗𝑡. The problem is that this equation rests on the hypothesis of irrelevance of independent alternatives (IIA) which generate implausible substitution patterns in segmented markets.
To relax this assumption, we adopt a nested logit framework in which consumers’ idiosyncratic preferences are correlated across refrigerators within the same “nest” (Corr(𝜖𝑖𝑗𝑡, 𝜖𝑖𝑘𝑡) ≠ 0), and zero otherwise10. The mutually exclusive nests are specified ex
ante by grouping together products the analysist thinks are closer substitutes. Under these
assumptions, Berry shows that:
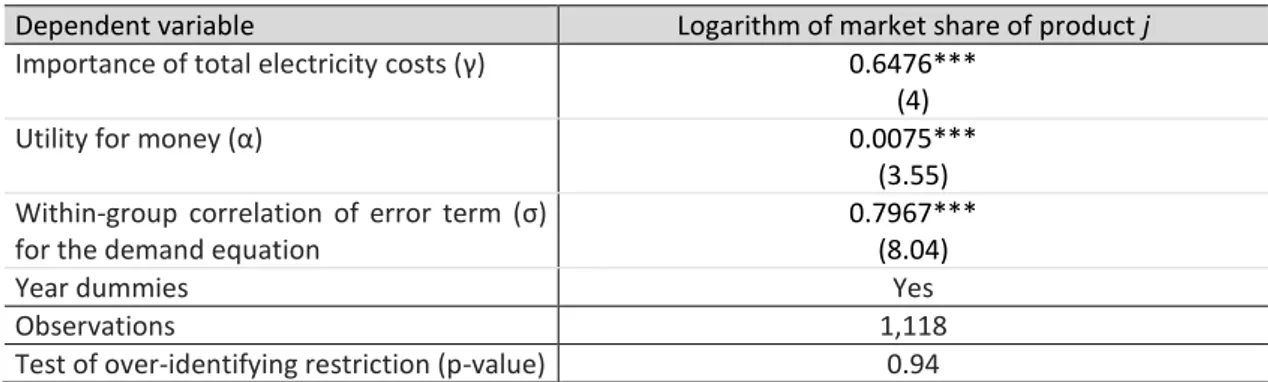
ln(𝑠𝑗𝑡) = 𝑢𝑗− 𝛼(𝑝𝑗𝑡+ γ𝐶𝑗𝑡) + 𝜎 ln(𝑠𝑗(𝑔)𝑡) + ln(𝑠0𝑡) + 𝜉𝑗𝑡 (1.1)
10
Goldberg (1995) and Allcott and Wozny (2014) are other examples where the nested logit model is used. A popular alternative is the random coefficient models. We believe the nested logit model is a good option here for several reasons. To start with, random coefficients cannot be eliminated through first-differencing we use in the subsequent analysis to control for unobserved quality and cost characteristics and the outside option. That means we would need to estimate a non-linear equation and we could not ignore the outside option, of which quantification is difficult and subject to measurement errors.
21
where 𝑠𝑗(𝑔)𝑡 is the market share of product 𝑗 as a fraction of the total sales within group g that includes product j and 𝜎 ∈ [0,1] is a scalar which parameterizes the within-nest correlations. Note that, we get a standard logit equation if 𝜎 = 0.
In our specification, we construct the product groups based on two dimensions that create product segmentation in the refrigerator market: a binary capacity indicator (i.e. the refrigerator capacity is below or above the sample median capacity) and whether the appliance is a refrigerator or a combined refrigerator-freezer. This choice is based on a judgment of the degree of substitutability of different products. In this respect, we believe that consumers willing to purchase a refrigerator, unfortunately not available, are unlikely to go for a combined refrigerator-freezer instead. Similarly, the choice of the size is strongly influenced by family characteristics (size, food consumption habits…) and dwelling characteristics. In Appendix A1, we give results with alternative nest structures.
We now turn to the specification of the discounted lifetime electricity cost 𝐶𝑗𝑡. The attention parameter γ is inserted in Eq. (1.1) to capture potential behavioural failures. As a consequence, 𝐶𝑗𝑡 should not be viewed as representing the valuation of the electricity cost by real-world consumers. It is the cost they would consider if fully rational. They would then calculate the net present value of the electricity cost with the standard formula:
𝐶𝑗𝑡 = Г𝑗× ∑ 𝑞𝑡+𝑠 𝑓 (1 + 𝑟)𝑠 𝐿𝑗 𝑠=1 (1.2)
In this equation, 𝐿𝑗 is product j’s lifetime, Г𝑗 is the level of energy consumption per time period, 𝑞𝑡+𝑠𝑓 is the electricity price at time 𝑡 + 𝑠 that is forecasted at the time of purchase 𝑡 and 𝑟 is the discount rate. Note that forecasted electricity prices are unobserved as the data only include actual prices.
Recall that the calculation of 𝐶𝑗𝑡 is based on strong rationality assumptions. Accordingly, Г𝑗 and 𝐿𝑗 are product energy consumption and lifetime evaluated by experts which are assumed to be perfectly known by the consumer, 𝑟 is the privately-rational discount rate. In the following, we will use the discount rate offered in financial markets in year t (the bond deposit rate). Finally, 𝑞𝑡+𝑠𝑓 is the future electricity prise estimated with a sophisticated forecasting model.
22
In this latter respect, we consider that a perfectly rational consumer makes an educated guess about future electricity prices based on the entire series of past prices. We construct this guess by applying an autoregressive integrated moving-average model (ARIMA) on monthly data on real electricity prices.11 ARIMA models are frequently applied in time-series econometrics to generate forecasts. This technique allows us to recreate the entire flow of future expected electricity prices that enter Eq. (2.2).
The best fit with our data is obtained with an ARIMA process with one lag for the autoregressive term and one lag for the moving-average term:
𝑞𝑡 = 𝑎 + 𝑏𝑞𝑡−1+ 𝑐𝜗𝑡−1+ 𝜗𝑡
where 𝑎, 𝑏 and 𝑐 are parameters and 𝜗𝑡 is the error term at time t. The model can be used recurrently to make forecasts, using the predictions of the previous periods to make new predictions. We therefore run as many models as we have years covered with our data in line with the assumption of rational expectations. We then calculate the forecasted prices with the formula:
𝑞𝑡+𝑠𝑓 = 𝑎̂𝑡+ 𝑏̂𝑡𝑞𝑡+𝑠−1𝑓 (1.3) where 𝑎̂𝑡 and 𝑏̂𝑡 are estimates of 𝑎 and 𝑏 using all the data available on electricity prices up to time t.
The demand equation is specified by combining (1.1), (1.2) and (1.3). To derive an econometric specification for sales, we add year dummies 𝜏𝑡 to (1.1) and then take the first-differences in order to absorb the share of the outside option, the value of usage and any shift in the overall market share level. This leads to:
∆ln(𝑠𝑗𝑡) = −𝛼 (∆𝑝𝑗𝑡+ γ∆𝐶𝑗𝑡(𝑟)) + 𝜎 ∆ln(𝑠𝑗(𝑔)𝑡) + ∆𝜏𝑡+ ∆𝜉𝑗𝑡 (1.4) where ∆ is the first-difference operator and 𝜉𝑗𝑡 is now the econometric error term capturing unobserved time- and product-varying heterogeneity.
11
In a recent paper, Anderson et al.(2013) show that US consumers tend to believe that gasoline prices follow a random walk, so that the current price is a martingale. Again, we do not specify 𝐶𝑗𝑡 to
capture real-world expectations, so that we should not use a no-change forecast even if this belief also applies to UK electricity prices. We do however provide the results in Appendix under this alternative assumption as a robustness check. This leads to increase the size of γ (and thus to reduce myopia).
23
Price
In contrast with the demand equation, we rely on a reduced form equation to describe refrigerator price adjustments induced by electricity price changes. Developing a structural approach to describe the supply would require taking into account both pricing and product innovation behaviour of multi-product firms. We would thus need to introduce multiple assumptions on how competition works. Reduced form equations impose much less restrictions.
Recall that our interest is in the influence of electricity costs. Accordingly, our price equation12 is:
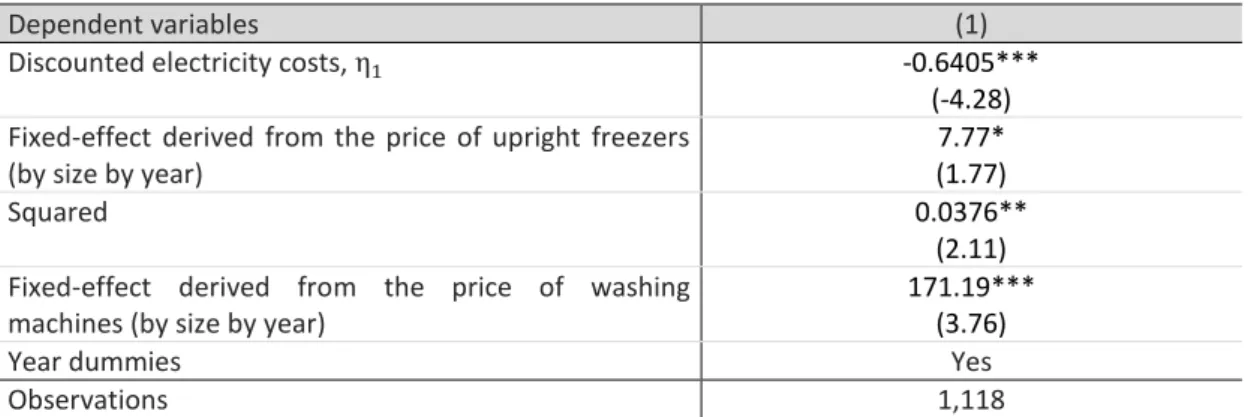
𝑝𝑗𝑡= 𝛽 − 𝜂𝐶𝑗𝑡+ 𝜃𝑋𝑗𝑡+ 𝜏𝑡+ 𝜇𝑗+ 𝜖𝑗,𝑡 (1.5) where 𝑋𝑗𝑡 is a vector of control variables to be described below. τ𝑡 and 𝜇𝑗 are year dummies and product fixed effects, respectively. Our objective here is to estimate 𝜂. Importantly, this parameter measures neither the characteristics of the demand curve nor those of the supply curve. Instead it estimates the impact of electricity costs on the equilibrium refrigerator price, once demand and supply responses are both taken into account, holding constant product offer. This estimate will thus allow deriving a mid-term elasticity after quantity and price adjustments.
Product offer
Turning next to product offer, we take advantage of the fact that the data describes the products sold in the market in year t. For many products, we thus observe when it has been launched and/or when it has been eventually withdrawn13. Again we expect an increase in electricity price would induce the launch of more energy-efficient models and the withdrawal of less efficient ones.
Let 𝑑𝑗𝑡∗ denote a binary variable indicating the availability of product j at time t. More specifically, 𝑑𝑗𝑡∗ = 1 if the product is on the market and zero otherwise. In addition, we
12
In a variant, we include both the electricity cost and its squared value to test for the existence of a non-monotonic relationship between product price and electricity costs. More specifically we could expect that energy price increases will decrease the price of the products consuming more energy while the price of energy-efficient models could increase if the total demand is inelastic. Results disconfirm this prediction; they are presented in Appendix A6.
13 The dataset also includes products that are observed every year. That is, products that have been launched before 2002 and that have not been withdrawn before 2007.
24
define 𝑑𝑗,𝑡 as the probability that product j is available at time t. We then use a dynamic probit equation which relates this probability to a set of explanatory variables:
𝑑𝑗𝑡 = Ф(𝑘𝑑𝑑𝑗𝑡−1∗ + 𝑘𝑝𝑝𝑗𝑡+ 𝑘𝑐𝐶𝑗𝑡+ τ𝑡+ 𝜇𝑗) (1.6) Ф(. ) is a cumulative normal function with zero mean and a variance equal to one and 𝑘𝑑, 𝑘𝑝 and 𝑘𝑐 are parameters. The two crucial variables are the purchase price 𝑝𝑗𝑡 and the operating cost 𝐶𝑗𝑡 which are both expected to decrease the dependent variable (𝑘𝑝, 𝑘𝑐< 0). We adopt a dynamic specification with 𝑑𝑗𝑡−1∗ as an independent variable in order to control for path dependency: launching a product in the market is more costly than withdrawing it.
Identification issues
Sales
A concern with the sales equation (1.4) is that the purchase price 𝑝𝑗𝑡 is endogenous as quantities and prices are simultaneously determined in the market equilibrium. It implies that unobserved product characteristics that vary over time are correlated with prices: [𝑝𝜉] ≠ 0. Or, to be precise, our problem is the time-varying valuation by consumers of product characteristics is correlated with the error term as the characteristics themselves are fixed. The log of the within-nest market share ln(𝑠𝑗(𝑔)𝑡) is also endogenous: mathematically, a higher value of 𝜉 causes more sales of refrigerator 𝑗 and because this product belongs itself to nest 𝑔, an increase in 𝑠𝑗𝑡 mechanically imply increases in 𝑠𝑗(𝑔)𝑡. The problem might not be too severe though as first differencing already controls for the correlation between prices and the linear component of product-specific unobserved quality that do not varies over time. As regards specifically the variable ln(𝑠𝑗(𝑔)𝑡), the source of bias is further limited by the fact there are a large number of product-by-year combinations in each nest. An instrumental variable approach is nevertheless adopted. Another reason for doing so is to circumvent a potential measurement error problem with the dependent variable as we do not observe transaction prices but a national average transaction price calculated by GfK (see detail below)14.
14 This problem is likely to be less severe than in the auto market where list prices can widely diverge from the prices that are actually paid after commercial negotiations.