HAL Id: hal-01088944
https://hal.inria.fr/hal-01088944
Submitted on 29 Nov 2014
HAL is a multi-disciplinary open access
archive for the deposit and dissemination of
sci-entific research documents, whether they are
pub-lished or not. The documents may come from
teaching and research institutions in France or
abroad, or from public or private research centers.
L’archive ouverte pluridisciplinaire HAL, est
destinée au dépôt et à la diffusion de documents
scientifiques de niveau recherche, publiés ou non,
émanant des établissements d’enseignement et de
recherche français ou étrangers, des laboratoires
publics ou privés.
Studying the energy consumption of data transfers in
Clouds: the Ecofen approach
Bogdan Florin Cornea, Anne-Cécile Orgerie, Laurent Lefèvre
To cite this version:
Bogdan Florin Cornea, Anne-Cécile Orgerie, Laurent Lefèvre. Studying the energy consumption of
data transfers in Clouds: the Ecofen approach. CloudNet: IEEE International Conference on Cloud
Networking, Oct 2014, Luxembourg, Luxembourg. �hal-01088944�
Studying the energy consumption of data transfers in
Clouds: the Ecofen approach
Bogdan Florin Cornea
∗, Anne-C´ecile Orgerie
†, Laurent Lef`evre
‡∗INRIA, IRISA, Rennes, France
†CNRS, IRISA, Rennes, France
‡Inria, Avalon, LIP Lab., ´Ecole Normale Sup´erieure de Lyon, University of Lyon, France
E-mails: {bogdan-florin.cornea ; anne-cecile.orgerie ; laurent.lefevre}@inria.fr
Abstract—Energy consumption is one of the main limiting factors for designing large scale Clouds. Evaluating the energy consumption of Clouds networking architectures and providing multi-level views required by providers and users, is a challenging issue. In this paper, we show how to evaluate and understand network choices (protocols, topologies) in terms of contributions to the energy consumption of the global Cloud infrastructures. By applying the ECOFEN model (Energy Consumption mOdel For End-to-end Networks) and the corresponding simulation framework, we profile and analyze the energy consumption of data transfers in Clouds.
Keywords—energy consumption, Cloud data transfers, ethernet networks, simulation
I. INTRODUCTION
Cloud computing is increasingly becoming an essential component for Internet service provision, yet at the same time its energy consumption has become a key environmental and economic concern. While Cloud computing is relying on numerous servers and storage facilities, it also intensively uses telecommunication networks. The ever-growing appetite of new applications for network resources leads to an unprece-dented electricity bill for these resources [1]. Moreover, for these bandwidth-hungry applications, networks can become a significant bottleneck [2].
In this context, Cloud computing actors need tools in order to design, to evaluate, and to improve their networking architectures. On one side, Cloud providers want to know the overall energy consumption of their networking infrastructures over time, depending on the incoming traffic. On the other end, Cloud users, like Platform-as-a-Service or Software-as-a-Service providers for instance, are interested in having a more detailed view of the energy consumption on a given equipment, or for a traffic pattern coming from a known application.
Evaluating the energy consumption of Cloud’s networking architectures and providing these multi-level views required by providers and users, is a challenging issue. In particular, having precise evaluations to be able to compare different topologies or different network protocols requires practically huge mon-itoring infrastructures and carefully controlled environments. To overcome these technical issues, one can rely on simulation tools. While networking research community has an extended experience on network simulators, only few of them consider the energy dimension and the particular use-case of Cloud computing infrastructures. Moreover, the simulators including this energy dimension only consider it for wireless equipment,
which is currently not suitable in the context of Cloud data centers.
In this paper, we propose to study the energy consumption of data transfers in Clouds from a simulation point of view. To achieve this goal, we use ECOFEN, an Energy Consumption mOdel For End-to-end Networks proposed in our previous paper [3]. This model has been implemented in NS-3 [4], a discrete-event simulator for Internet systems, targeted pri-marily for research and educational use. This free software is widely used in the community, like its predecessor NS-2 [5] which was used in our previous work [3].
The paper is organized as follows: Section II presents the related works. Section III introduces the ECOFEN model and simulator. Section IV provides preliminary results in order to evaluate the energy consumption of Cloud networks, and Section V shows results exploiting green levers in order to reduce the energy consumption of networking infrastructures. Section VI concludes this work and presents future work.
II. RELATED WORK
Energy efficiency is currently at the focus of attention of many research works in Cloud computing. Yet, telecom-munication networks, which are an integral part of theses Cloud infrastructures, are often not considered because of their complexity, their heterogeneity and their large-scale properties. However, it has been shown that networking infrastructures play a non-negligible role in the electricity’s consumption of data centers [1]. While the number of energy-aware compo-nents of large-scale architectures is increasing, the methods for evaluating the energy consumption are lagging behind. In many cases, direct measurements of the consumed energy are not possible due to lack of monitoring equipment, large-scale issues and the involvement of different providers.
In this context, simulation appears as an appealing solution allowing large-scale and fine-grained experiments. However, the community is lacking of such energy-aware simulators for wired networks. ECOFEN, an Energy Consumption mOdel For End-to-end Networks proposed in 2011 [3], has been imple-mented within the well-known network simulator NS-3 [4]. The ECOFEN simulator provides energy-aware simulations based on packet-based and per-Byte energy consumption mod-els based on experimental results from the literature [6], [7], [8], [9], [10].
Contrary to other work like the GreenCloud simulator based on NS-2 [11], this simulator aims also at providing
mod-els for energy-efficient network devices, i.e. able to dynami-cally adapt their link rate depending on the actual traffic [12], to switch on and off ports and entire devices [13], and to put them to sleep modes like in the 802.3az standard [14].
III. ECOFEN,AN ENERGY-MODULE FOR THENS-3
SIMULATOR
Proposed by Orgerie et al. [3], ECOFEN allows studying through simulation the energy consumption of wired network equipment. Initially, ECOFEN was developed as a module for NS-2 [5], and was later on re-written for NS-3 [4], which is mainly intended for scientists and academia. NS-3 is available by default in certain GNU/Linux distributions such as Fedora, thus allowing a simplified access to its functions, and to the energy module implicitly.
A. Characteristics of ECOFEN
The ECOFEN module brings to the NS-3 users community the possibility to analyze the energy profile of the network over time. Users can observe the global consumption of networks in a Cloud or can isolate and analyze a single network equipment. With a precision of the order of milliwatts for the power and milliseconds for the time, ECOFEN provides several energy models and profiles for network interface cards (NIC), switches, routers, and interfaces (ports): basic, linear, and complete, all inspired by experiments from the literature. For calculating the NIC consumption, the basic energy model is used, this allowing users to set the power (in watts) in On and in Off states. For calculating the interface con-sumption, any of the three models can be used. The linear model allows replacing the On setting with two states — Idle and ByteEnergy — for calculating the energy per processed byte. For even more precision, the complete model allows replacing the ByteEnergy with four states indicating the energy consumed (i) per received byte, (ii) per sent byte, (iii) per received packet, and (iv) per sent packet.
The basic model provides coarser-grain energy modeling, compared to the complete one, whereas the linear model is in between. A different energy model may be used for each network equipment — NIC, switch, router, interface — the choice of model depending only on the expected granularity of the result. In addition, green functions (levers) can be applied to existing energy models. For instance, models are provided for calculating energy consumption during state transitions, i.e., from On (or Idle) to Off and vice versa or when switching between available link rates. These models are used when simulating power saving schemes, but they can also be used to simulate power failures.
B. Limitations
The energy consumption of complex infrastructures de-pends of several factors. Despite the complexity of the ECOFEN module, most limitations are due to the NS-3 imple-mentation itself. For instance, simulation durations are driven by the packet-based nature of the simulator. Consequently, the time to simulate large scale systems with thousands of nodes, or millions of packets can be large. For some experiments (see Section IV-C), more than 5 hours of simulation are required to capture one minute of simulated network activity for a
large topology (over 1000 nodes in 9 data-centers) as part of combined data transfers of 112GB. ECOFEN adds energy details on top of the existing network models. ECOFEN is thus dependent on the NS-3 models for network protocols. The availability of measured power consumptions for network devices is required for configuring the simulator, but some values can be found in the literature or on manufacturer’s specifications.
IV. EVALUATING THE ENERGY CONSUMPTION OFCLOUD
NETWORKS THROUGH SIMULATION
In Cloud systems, the demand for computing and network-ing resources varies in time. The computnetwork-ing resources are out of the scope of this paper and, therefore, we focus on profiling the energy consumption of network resources under various scenarios.
The experimental work described in this paper uses energy characteristics found in related work. These values are used to configure the NS-3 simulator. The magnitude of the energy used during data transfers, compared to idle operating mode, is not the focus of our experiments, but we present use cases and consumption analyses available through the ECOFEN/NS-3 energy module. Users are, however, given the freedom to input the power consumption for the devices of their choice, based on measurements taken or found in the literature.
A. Point-to-point VM migration
For a first scenario, the focus is on a type of data transfer which occurs frequently in Cloud systems: migrating Virtual Machines (VM). For this purpose, we have measured the size, duration and physical link conditions during a real migration, and compared the acquired information with results obtain by means of simulation (see Table I). A summary of consumption values used for configuring the simulator during this scenario can be found in Table II. Migrating VMs was done on two computing nodes from the Luxembourg site of the Grid’5000 platform [15] (2 CPUs Intel@2.0GHz, 6 cores/CPU, 31GB RAM, 232GB disk). The measured size on disk for the VM
TABLE I. COMPARISON OF MEASUREDVMMIGRATION DURATION AND SIMULATED TIMES,AT DIFFERENT BAND WIDTHS.
Disk Bandwidth Measured Simulated time [s] Error2
size [M bps] time1 Ecofen module Ecofen module [%]
[GB] [s] disabled enabled 1.5 54 221.7 249.8 249.8 12.6 80 161 168.6 168.6 4.7 100 118 134.9 134.9 14.3 112 123 120.4 120.4 2.1
1Real measurements taken on Petitprince cluster of Grid’5000 site in
Luxembourg.2Error between measured and simulated time. *Equipment used:
NetFPGA 1G rev. 2 (for the NICend host), Nortel Ethernet Routing Switch 5510-24T
(for the switch), unknown model of edge LAN switch B at 100Mbps and at 1Gbps port capacity (for idle port), 1 Gigabit Ethernet (for ByteEnergy).
is 1.5GB, with a virtual size of 10GB. The migration process relies on libvirt with qemu and kvm. Although libvirt imposes 32MB/s maximum bandwidth, we overcame this by configuring Debian backports, and upgrading libvirt to ver. 1.2.1. However, our experiments revealed that the command for setting the maximum migration bandwidth only proved to be reliable between 54 and 112Mbps. For this reason, we chose to take VM migration measurements, in turn, at 54, 80, 100, and 112 Mbps migration bandwidths. For
configuring the simulator, interfaces were set to the smallest link rate that supports, in turn, each of these bandwidths.
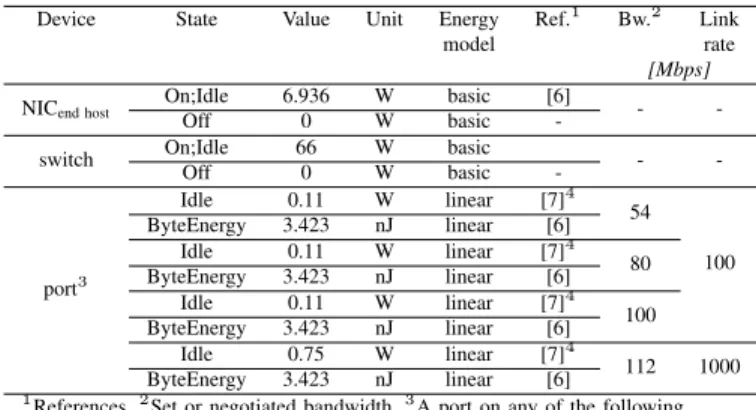
TABLE II. VALUES USED IN SIMULATION; VMMIGRATION.
Device State Value Unit Energy Ref.1 Bw.2 Link
model rate
[Mbps] NICend host
On;Idle 6.936 W basic [6]
-
-Off 0 W basic
-switch On;Idle 66 W basic -
-Off 0 W basic -port3 Idle 0.11 W linear [7]4 54 100 ByteEnergy 3.423 nJ linear [6] Idle 0.11 W linear [7]4 80 ByteEnergy 3.423 nJ linear [6] Idle 0.11 W linear [7]4 100 ByteEnergy 3.423 nJ linear [6] Idle 0.75 W linear [7]4 112 1000 ByteEnergy 3.423 nJ linear [6]
1References.2Set or negotiated bandwidth.3A port on any of the following
equipments: NIC, switch, router.4Extracted from [7].
We are interested in the data that is transferred (migrated) between two computing nodes, hence we consider one switch-ing device connectswitch-ing both hosts (see Figure 1). Performswitch-ing
A s-0 B
Fig. 1. Local transfer of a Virtual Machine between two computing nodes (from host A to host B) located on the same local area network.
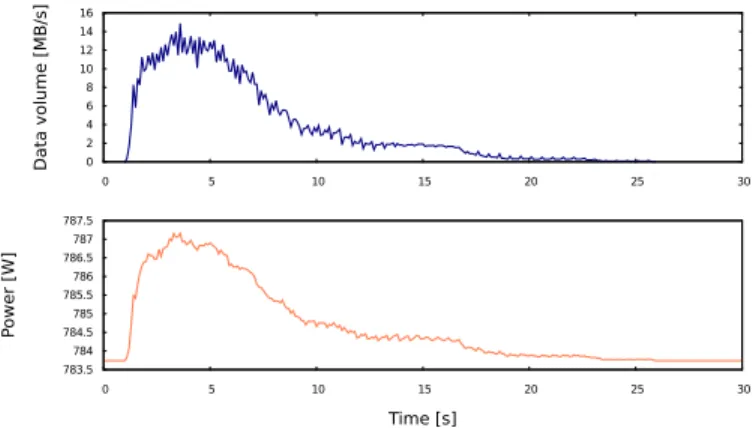
a VM migration provides information that helps configuring the simulator later: measurements of the migration duration and of the size of VM on disk, and traces of the network load during migration. We use this information to configure the ECOFEN module. The result can be seen in Figure 2, where the power profile at each second during the migration is showed. Since the power consumed during the data transfer appears in the upper half of Figure 2, a close-up is also showed in the lower half, were the 2mW variation becomes visible.
Fig. 2. VM migration. Simulated power profile of the network during the migration. Link rate is set at 100Mbps. Energy consumption is calculated every 100ms.
With respect to the energy used by the two hosts employed in migrating the VM, ECOFEN can provide an insight on the impact of bandwidth on the overall network consumption. Figure 3 shows an analysis made with ECOFEN throughout the migration of a 1.5GB VM disk. First, ECOFEN allows a quick look into the behavior of network equipment and provides users with comparative results, globally or by network equipment. Second, for longer data transfers between two
nodes in the Cloud, higher negotiated link rates mean lower energy consumption. Energy saving can be achieved at higher link rates once the transfer ends, as opposed to the slowest link rate that requires much more energy in time to finalize the migration. The experiment shows that only a small energy efficiency is observed for consecutive link rate, such as 100 and 1000Mbps, if the available bandwidth does not match the negotiated link rate, as in the case of 100 and of 112Mbps bandwidths. 8000 10000 12000 14000 16000 18000 20000 22000 54 80 100 112 Ener gy [J] Bandwidth [Mbps] Migrating 1.5 GB of data 20021.8 13516.7 10786.2 9969.07
Fig. 3. Energy profile when migrating a VM; labels indicate the energy. Time is listed in Table I.
We have shown how we can analyze the power and the energy in the case of a virtual machine migration, situation that often occurs in the Cloud. We move the focus on another aspect of the Cloud, i.e., the network activity at data-center level.
B. Data-center network
With respect to the network in data-centers, ECOFEN pro-vides the following types of information: a global view, and a detailed view of a network equipment or of a group of network devices. The results obtained from experimenting with ECOFEN are discussed in this section.
Table III contains the relevant values used to configure the
energy-aware network simulator. For NICend hosts, and linecards
on switches or routers, ECOFEN uses the basic energy model, which supports On/Idle and Off states. For the installed ports, on the other hand, ECOFEN has a complete model allowing a finer grained representation of states, as to account for the energy consumed per byte or per
packet of transmitted data (inbound or outbound). Another
relevant aspect in evaluating the energy consumption is the duration and the energy needed to switch a device (card or port) from one state to another. In addition to the values from Table III, we measured on Grid’5000 the intra– and inter– data-center latency of 0.12ms and 13.8ms, respectively. The simulated energy consumption is read every 100ms, unless specified otherwise.
Assuming that a data-center in the Cloud can be described in a simplified way as in Figure 4, using NS-3 and the ECOFEN module, we can obtain two types of information, (i) an overview on the global network power consumption dynamics and (ii) a detailed view of one network equipment or of a group. This information is being expressed using three different metrics: (a) the power, in watts, (b) the energy, in joules, and (c) the power with respect to the communication volume, in watts and MB/s, respectively.
In the current scenario, a number of 200 point-to-point communications take place between end hosts A to E. The communicating pairs of end hosts and the size of each com-munication were randomly generated, but fixed during the
TABLE III. VALUES USED IN SIMULATION;DATA-CENTER NETWORK ANDCLOUDFEDERATION.
Device State Value Unit Energy Ref.3 Link
model rate
[Gbps] NICend host
On;Idle 1.82 W basic [9]
1 ; 10
Off 0.7 W basic [9]
switch On;Idle 150 W basic [7]
Off 0 W basic
-router On;Idle 76.4 W basic [7]
Off 0 W basic
-port1
Idle 1.12 W complete [9]
1
Off 0 W complete
-Send/Recv byte 3.4 nJ complete [6]
Send/Recv packet 197.2 nJ complete [6]
Idle 0.53 W complete [9]
10
Off 0 W complete
-Send/Recv byte 14 nJ complete [8]
Send/Recv packet 1 504 nJ complete [8]
Device Action Value Unit Energy Ref.3 Link
model rate
[Gbps] NICend host Switch On/Off 0.91*10
−3 J complete [9]2
1 ; 10
0.5*10−3 s complete [10]
switch Switch On/Off 0.75 J complete [7]
2
1 ; 10
0.5*10−3 s complete [10]
port1 Switch On/Off 0.56*10
−3 J complete [6]2
1
0.5*10−3 s complete [10]
1One network port on end host NIC, switch or router.2Switching energy is
calculated as the Power for NICend host[9], for ports [9], or for switches [7],
throughout the switching duration [10].3References. * Equipment used: Gigabit
PT EXPI9300PTLPBLK (for the NICend host), unspecified edge LAN switch B at
Idle Power (for the switch), unspecified edge LAN switch D at Idle Power (for the router), Gigabit PT EXPI9300PTLPBLK (for idle 1G port), 10 Gigabit X520-T2 (for idle 10G port), NetFPGA 1G rev. 2 (send/recv byte or packet energy at 1Gbps), unspecified Gigabit Ethernet (send/recv byte or packet energy at 10Gbps),
Gigabit PT EXPI9300PTLPBLK (for switching On/Off NICend host), unspecified
edge LAN switch B (for switching On/Off a switch), Gigabit PT
EXPI9300PTLPBLK (for switching On/Off ports on any device). Idle port values are the difference between consumption of interface when down (cable unplugged) and interface when up (no transfer).
B D s-0 s-1 s-2 s-3 s-4 A E C
Fig. 4. Data-center configuration considered for this simulation scenario. The computing nodes are not considered, but only the network equipment of these end hosts, and the network infrastructure connecting them.
evaluation of different views and metrics. A reduced number of transfers is imposed for end host E, in order to observe the energy consumption when using energy saving techniques (green functions). Data size per communication is generated from the range 1024B to 10MB. The transport protocol in use is TCP and all network equipment is in On or Idle mode. For
all interfaces installed on NICend hosts and on switches, energy
consumption also considers the number of transmitted bytes or packets.
1) Dynamic analysis of the overall network infrastructure: As indicated previously, with the ECOFEN energy module users can obtain a simulation of the overall network in a data-center. The bottom curve in Figure 5 shows the power consumption over the total communication time in the data-center. At time t=0s and after time t=26s, the network has a constant consumption because it is in an Idle state. From
0 2 4 6 8 10 12 14 16 0 5 10 15 20 25 30 Data volume [MB/s] 783.5 784 784.5 785 785.5 786 786.5 787 787.5 0 5 10 15 20 25 30 P ower [W] Time [s]
Fig. 5. Global view of the network traffic and power for this Cloud data-center. Transport protocol in use: TCP. Energy consumption is calculated every 100ms; captured packet size (default NS-3): 578B
time t=3s to time t=4s into the simulation, consumption reaches a peak value due to all end hosts engaged into communication.
The top curve of Figure 5 shows the communication volume over time, with the purpose of understanding the variations in power consumption. It can be seen that there is no network load during the first second, which corresponds to an Idle power consumption of 783.7W.
By the way ECOFEN was designed, it automatically sup-ports energy consumption for any other transport protocol that NS-3 developers might consider adding to the simulator.
2) Dynamic analysis of end hosts NIC: A second type of
information available through ECOFEN is a detailed view over
the power and energy profile of any NICend host. Figure 6 shows,
for each end host, the data volume transferred per second (see upper figure), which shapes the power consumption profile (see the lower figure). This type of analysis result shows the
0 1 2 3 4 5 6 7 8 9 0 5 10 15 20 25 30 Data volume [MB/s] end host A end host B end host C end host D end host E 2.95 3 3.05 3.1 3.15 3.2 3.25 3.3 0 5 10 15 20 25 30 P ower [W] Time [s]
Fig. 6. Detailed view of network traffic and power for NICend hosts for the Cloud data-center considered for this scenario. Power is calculated every 100ms. Data volume and power for one NICend hostis drawn using the same color.
contribution of each communicating NICend host to the overall
energy consumption of the network. It also allows identifying which end host A to E draws a higher power per second, and which communicates a longer time. Taking end host
A as example, it has the highest number of simultaneous
communications in the range of 5 to 6s, while end host
E exchanges the most messages in the range 1.5 to 6s. On
the other hand, end host D is part of the largest number of data transfers in this scenario, communicating during the 1 to
C. Cloud Federation
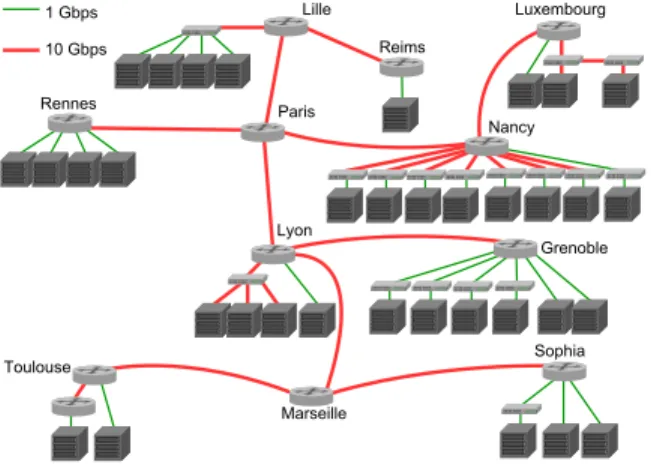
For analyzing a large-scale Cloud system with ECOFEN, we consider the illustrative network topology of the Grid’5000 French platform (see Figure 7). This topology contains over one thousand computing nodes (multi- and many-core) geo-graphically distributed on 9 sites, organized in 34 clusters. We
Grenoble Lille Luxembourg Lyon Nancy Paris Rennes Toulouse Marseille Sophia Reims 1 Gbps 10 Gbps
Fig. 7. Grid’5000 network topology used for our Cloud platform network configuration.
extend the previous experiment (see Section IV-B) to obtain the power profile for this network topology. The physical links connecting the data-centers have a transmission rate of 10Gbps. The link rates on each site are of 1 and 10Gbps. The communication protocol is TCP and 100 data transfers are simulated during this scenario. 80/100 transfers are of a random size of 10 to 20MB, and 20/100 transfers are of a random size of 1 to 10GB. A snapshot of one minute of the cloud network activity is shown in Figure 8. During this experiment, 100 transfers begin at random moments between
0 and 50s. Only some of the over 1000 computing nodes
participate in data transfers and the figure shows the network equipment consumption, without taking into account cooling energy and computing nodes (except for their NICs).
75160 75180 75200 75220 75240 75260 75280 75300 75320 0 10 20 30 40 50 60 P ower [W] Time [s]
100 transfers: 80 of 10-20MB each & 20 of 1-10GB each
Fig. 8. Global power profile of a Cloud Federation Network, based on Grid’5000 topology. Power is calculated every 100ms.
With ECOFEN we can study and estimate the energy impact of one data-center switch, in case of a power failure or scheduled maintenance shutdown. Using values from Table III. for the data-center in Rennes, having one switch with 129 active 1 Gigabit and 1 active 10 Gigabit ports, we expect
observing an energy saving of 145W if switching Off all ports, or 221.4W if switching Off the entire equipment. The next section details the use of green levers in ECOFEN.
V. GREEN LEVERS INCLOUD NETWORKS
What is the impact of energy-efficient equipment in Cloud Networks? For this study, we enable green levers in the data-center seen in Figure 4, then set TCP as transport protocol. Similarly to section IV, ECOFEN supplies the information about the consumption at network level or per equipment.
The green, or energy-aware, model of ECOFEN sup-ports the On (Idle), and Off modes for every network equipment. In addition, the consumption of switching devices depends on (i) the number of transmitted bytes or packets, and (ii) the duration and the energy for switching between two states, e.g., from On to Off, or vice versa.
A. Analysis of energy-aware (green) devices – Global view Based on Figures 5 and 6, we can apply energy-saving
techniques on the NICend hostE, at any time after 6s. From
this point, the end host network card is in Idle operating mode and switching it On or Off would not cause any data loss, as no communication is in progress. In Figure 9, ECOFEN provides an insight on the power profile for the overall network (see system power all ON). We study once
780 781 782 783 784 785 786 787 788 0 5 10 15 20 25 30 P ower [W] Time [s]
end host E: card o switch 4: 1 port o system power all ON
Fig. 9. Global power profile for the data-center network in Figure 4. Power is calculated every 100ms.
more the power drawn by the network when the NICend hostE
is switched Off for a duration of 5 seconds, starting at time
t=10s (see end host E: card off ). Similarly, we analyze
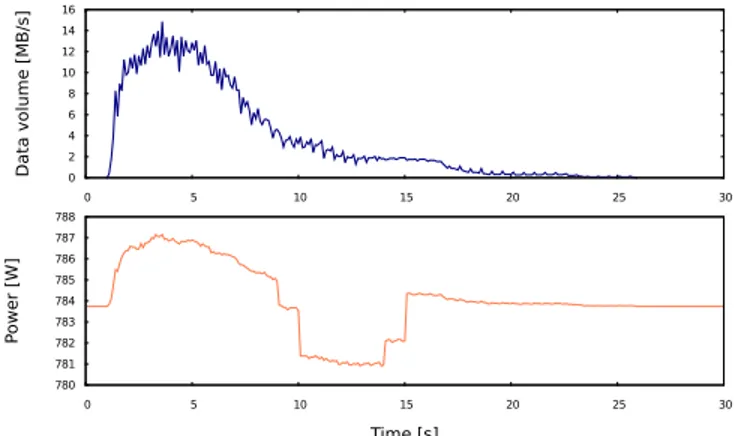
the power profile by modifying the number of active ports, hence the number of active links. Based on the simulation configuration for obtaining Figures 5 and 6, we add a condition regarding one port on switch 4 that connects to the end host E, i.e., we test the shutting down of the port at time t=9s, for a duration of 5 seconds. This is allowed because during this time interval, there is no communication to/from end host E through this port of the switch (green color). Figure 9 shows the initial profile of the global network, as well as the power saving achievable by switching Off ports (1.12W) or NICs (1.82W). These three results are grouped together such that the power saving can be shown from a different perspective in Figure 10. In the lower figure is shown the network power when the two devices mentioned previously are switched Off as part of the green functions. These are later switched back On. One port on switch 4 is switched Off safely at time
t=9s followed by a switching Off on the NICend hostE at
time t=10s. This results in a total power saving of about 3W, until time t=14s when the switch port is turned back On, followed by the change of state On for the network card. For this scenario, each change in port state means a consumption
or saving of 1.12W, whereas the power change per NICend host
0 2 4 6 8 10 12 14 16 0 5 10 15 20 25 30 Data volume [MB/s] 780 781 782 783 784 785 786 787 788 0 5 10 15 20 25 30 P ower [W] Time [s]
Fig. 10. Global network profile for the considered data-center. One port then one card are switched Off, then back On. Power is calculated every 100ms.
B. Analysis of energy-aware (green) devices – at switch level Based on the results shown in the previous figure, we isolate the energy consumption of switches and present a detailed view of their power profile. If one is interested in the energy behavior of switching equipment, a simple filter set on the simulator output produces the profiles shown in Figure 11. Two types of information are identified in this figure: power consumption groups together switches, and power savings are easy to observe. We observe the variation in power requirement
152 152.5 153 153.5 154 154.5 155 155.5 0 5 10 15 20 25 30 P ower [W] Time [s] switch 0 switch 1 switch 2 switch 3 switch 4
Fig. 11. Power profile per switching device. One port on switch 4 is set to Offat 9s and to On at 14s. Power is calculated every 100ms.
for switches 0 through 4, as expected for the data-center net-work topology in Figure 4. There are three consumption levels in our data-center. The first group — switches 0, 1, 4 — have a higher power consumption due to four active ports on each. Switch 3 has three active ports, while switch 2 has only two active ports. In this figure, ECOFEN provides additional information on the activity of switch 4, which turns Off one of its ports at 9 seconds to save energy. During this time, switch 4 will have three active ports, hence joining the group of switch 3. The port is then turned
On at 14 seconds.
VI. CONCLUSION AND PERSPECTIVES
Energy consumption of networking devices must be taken into account in order to better compute energy consumption of Clouds infrastructures. This allows Clouds designers to propose realistic and precise models and algorithms. This paper presents the usage of the ECOFEN model (Energy Consumption mOdel For End-to-end Networks) and the corre-sponding simulation framework (designed as an NS-3 module). This approach permits global and complete (end to end) view of energy consumption of network devices. With ECOFEN, we can obtain two types of information, (i) an overview on the global network power consumption dynamics and (ii) a detailed view of one network equipment or of a group. ECOFEN allows the study of the impact of data transfers,
in terms of static and dynamic energy consumption, in the Cloud. Moreover, with ECOFEN, network Cloud designers can evaluate the impact and manageability of Green leverages.
As future works, we are currently evaluating the precision of simulation results compared to measurements taken using wattmeters installed on the power supply of the corresponding physical network devices.
ACKNOWLEDGMENT
This work is funded by the INRIA HEMERA large-scale initiative. Experiments presented in this paper were carried out using the Grid’5000 testbed, supported by a scientific interest group hosted by Inria and including CNRS, RENATER and several Universities as well as other organizations (see https://www.grid5000.fr). We thank Ismael Cuadrado-Cordero at INRIA/Myriads (France) for providing us with part of the measurements (Section IV-A) for configuring our simulator.
REFERENCES
[1] R. Bolla, R. Bruschi, F. Davoli, and F. Cucchietti, “Energy Efficiency in the Future Internet: A Survey of Existing Approaches and Trends in Energy-Aware Fixed Network Infrastructures,” IEEE Communications Surveys and Tutorials, vol. 13, no. 2, pp. 223–244, 2011.
[2] M. Chowdhury, M. Zaharia, J. Ma, M. Jordan, and I. Stoica, “Managing data transfers in computer clusters with orchestra,” in SIGCOMM, 2011, pp. 98–109.
[3] A.-C. Orgerie, L. Lefevre, I. Guerin-Lassous, and D. Pacheco, “Ecofen: An end-to-end energy cost model and simulator for evaluating power consumption in large-scale networks,” in World of Wireless, Mobile and Multimedia Networks (WoWMoM), 2011 IEEE International Symposium on a, June 2011, pp. 1–6.
[4] NS-3 Consortium, “The NS-3 Network Simulator.” [Online]. Available: http://www.nsnam.org
[5] S. McCanne and S. Floyd, “NS Network Simulator.” [Online]. Available: http://www.isi.edu/nsnam/ns
[6] V. Sivaraman, A. Vishwanath, Z. Zhao, and C. Russell, “Profiling per-packet and per-byte energy consumption in the netfpga gigabit router,” in Computer Communications Workshops (INFOCOM WKSHPS), 2011 IEEE Conference on, April 2011, pp. 331–336.
[7] P. Mahadevan, P. Sharma, S. Banerjee, and P. Ranganathan, “A power benchmarking framework for network devices,” in NETWORKING 2009, ser. Lecture Notes in Computer Science. Springer Berlin Heidelberg, 2009, vol. 5550, pp. 795–808.
[8] A. Vishwanath, J. Zhu, K. Hinton, R. Ayre, and R. Tucker, “Estimating the energy consumption for packet processing, storage and switch-ing in optical-ip routers,” in Optical Fiber Communication Confer-ence/National Fiber Optic Engineers Conference 2013. Optical Society of America, 2013, p. OM3A.6.
[9] M. H¨ahnel, B. D¨obel, M. V¨olp, and H. H¨artig, “ebond: energy saving in heterogeneous r.a.i.n,” in e-Energy, 2013, pp. 193–202.
[10] M. Gupta and S. Singh, “Dynamic ethernet link shutdown for energy conservation on ethernet links,” in Communications, 2007. ICC ’07. IEEE International Conference on, June 2007, pp. 6156–6161. [11] D. Kliazovich, P. Bouvry, and S. U. Khan, “GreenCloud: a packet-level
simulator of energy-aware cloud computing data centers,” Journal of Supercomputing, vol. 62, no. 3, pp. 1263–1283, 2012.
[12] C. Gunaratne, K. Christensen, and S. Suen, “Ethernet Adaptive Link Rate (ALR): Analysis Of A Buffer Threshold Policy,” in IEEE Global Telecommunications Conference (GLOBECOM), 2006, pp. 1–6. [13] L. Chiaraviglio and I. Matta, “GreenCoop: Cooperative Green Routing
with efficient Servers,” in International Conference on Energy-Efficient Computing and Networking (e-Energy), 2010.
[14] K. Christensen, P. Reviriego, B. Nordman, M. Bennett, M. Mostowfi, and J. Maestro, “IEEE 802.3az: the road to Energy Efficient Ethernet,” IEEE Communications Magazine, vol. 48, no. 11, pp. 50–56, 2010. [15] Grid’5000, “Official website.” https://www.grid5000.fr.