HAL Id: hal-02303729
https://hal.archives-ouvertes.fr/hal-02303729
Submitted on 2 Oct 2019HAL is a multi-disciplinary open access archive for the deposit and dissemination of sci-entific research documents, whether they are pub-lished or not. The documents may come from teaching and research institutions in France or abroad, or from public or private research centers.
L’archive ouverte pluridisciplinaire HAL, est destinée au dépôt et à la diffusion de documents scientifiques de niveau recherche, publiés ou non, émanant des établissements d’enseignement et de recherche français ou étrangers, des laboratoires publics ou privés.
compounds on building materials: Part 1 – Methodology
developed for field applications
Malak Rizk, Marie Verriele, Sébastien Dusanter, Coralie Schoemaecker,
Stéphane Le Calvé, Nadine Locoge
To cite this version:
Malak Rizk, Marie Verriele, Sébastien Dusanter, Coralie Schoemaecker, Stéphane Le Calvé, et al.. Fast sorption measurements of volatile organic compounds on building materials: Part 1 – Method-ology developed for field applications. Building and Environment, Elsevier, 2016, 99, pp.200-209. �10.1016/j.buildenv.2015.12.017�. �hal-02303729�
Accepted Manuscript
Fast sorption measurements of volatile organic compounds on building materials: Part 1 - Methodology developed for field applications
M. Rizk, M. Verriele, S. Dusanter, C. Schoemaecker, S. Le calve, N. Locoge PII: S0360-1323(15)30215-8
DOI: 10.1016/j.buildenv.2015.12.017 Reference: BAE 4348
To appear in: Building and Environment Received Date: 22 September 2015 Revised Date: 14 December 2015 Accepted Date: 20 December 2015
Please cite this article as: Rizk M, Verriele M, Dusanter S, Schoemaecker C, Le calve S, Locoge N, Fast sorption measurements of volatile organic compounds on building materials: Part 1 - Methodology developed for field applications, Building and Environment (2016), doi: 10.1016/j.buildenv.2015.12.017. This is a PDF file of an unedited manuscript that has been accepted for publication. As a service to our customers we are providing this early version of the manuscript. The manuscript will undergo copyediting, typesetting, and review of the resulting proof before it is published in its final form. Please note that during the production process errors may be discovered which could affect the content, and all legal disclaimers that apply to the journal pertain.
M
AN
US
CR
IP
T
AC
CE
PT
ED
Graphical abstractM
AN
US
CR
IP
T
AC
CE
PT
ED
1Fast sorption measurements of volatile organic
1compounds on building materials: Part 1 - Methodology
2developed for field applications
34
M. RIZK1,2,4*, M. VERRIELE1,2, S. DUSANTER1,2, C. SCHOEMAECKER3, S. LE CALVE4, N.
5
LOCOGE1,2
6 7
1
Mines Douai, SAGE, F-59508 Douai, France
8
2
Université de Lille, F-59000, Lille, France
9
3
Université de Lille 1, Laboratoire de Physico-chimie des Processus de Combustion et de
10
l'Atmosphère, Villeneuve d'Ascq, France
11
4
Université de Strasbourg/CNRS. Institut de Chimie et Procédés pour l’Energie,
12
l’Environnement et la Santé (ICPEES), UMR 7515, F-67087, Strasbourg.
13
*
Corresponding author present address: Mines Douai, 941 Rue Charles Bourseul, CS 10838,
14
59508 Douai Cedex France ; Phone : +33 27 71 26 33 ; e-mail : malak.rizk@mines-douai.fr
15
Abstract
16
Several physicochemical processes occurring within buildings are key drivers of indoor
17
concentrations of Volatile Organic compounds VOCs. Many models and experimental studies
18
have been proposed to predict VOCs concentration indoors given these processes. However,
19
there is a lack of representative data in literature to present gas-surface interaction in order to
20
validate mathematical models. This work is divided in two parts and aims to develop and
21
validate a method to perform fast measurements of VOC sorption parameters on the field by
22
coupling a Field and Laboratory Emission Cell (FLEC) to a Proton Transfer Reaction-Mass
23
Spectrometer (PTR-MS). In the part 1 of the work, sorption coefficients of aromatic
24
compounds on a gypsum board and vinyl flooring were investigated at ppb levels to test and
25
evaluate the proposed methodology. Sorption coefficients in the range of 0.03-1.88 m.h-1 for
26
ka and 2.04-17.32 h-1 for kdwere successfully measured within a (0.5-8 hours) for the two
27
materials. Robustness tests highlight that the determination of sorption coefficients does not
28
depend on operating conditions. While sorption coefficients for the gypsum board were
29
measured with a PTR-MS time resolution of 20 seconds, the vinyl flooring material required
30
measurements at a higher time resolution of 2 seconds due to its lower sorption properties.
31
Limits of applicability assessed for this method indicate that sets of sorption parameters (ka,
32
kd) of (0.01 m.h-1; 0.01 h-1) and (0.09 m.h-1; 0.09 h-1) can be measured with an accuracy better
33
than 10% at time resolutions of 2 and 20 seconds respectively.
34
Keywords
35
Field and laboratory emission cell (FLEC), Proton transfer reaction-mass spectrometer
(PTR-36
MS), Sorption, VOCs, Building materials.
M
AN
US
CR
IP
T
AC
CE
PT
ED
2 1. Introduction 38Volatile organic compounds VOCs are the main pollutants in indoor environment, which
39
present a strong impact on human health, comfort and productivity [1-3]. Several
40
physicochemical processes occurring within buildings are key drivers of indoor
41
concentrations of VOCs [4]. These processes include heterogeneous and gas-phase chemical
42
reactions, air exchange with outdoor and gas-surface interactions. A good understanding of
43
these processes is important to develop efficient strategies to reduce human exposure to
44
indoor air pollution. The available methods developed in literature to study the concentrations
45
of VOCs indoors, given the above-mentioned processes fall into two categories, modeling
46
approaches and experimental investigation under well-controlled environments.
47
Under the first category, several models have been developed to simulate the VOC
48
emission/sorption by indoor surfaces. As far as the sorption process is concerned, some
49
models considered the adsorption (ka) and desorption (kd) rates [5-7] while, other accounted
50
for the diffusion coefficient (Dm) in the building material and represents the sorption with a
51
partitioning coefficient (K) between the air and the material through a diffusion-controlled
52
mass transfer model proposed by Little [8]. Later Deng [9] proposed an improved model that
53
considers for the convective mass transfer coefficient (hm) through the boundary layer present
54
on the surface of a material as well as the diffusion and the partitioning coefficients. For the
55
emission process, the diffusion-controlled mass transfer model proposed by Little [8]
56
promoted the development of the emissions mass transfer model such as the model of Xu [10]
57
applied for single-layer building material, the model of Lee [11] applied for porous materials
58
and the model of [12, 13] applied for multilayer building materials. A general model was
59
developed by Xiong [14] to characterize both emission and sorption process in ventilated and
60
airtight chambers taking into account the convective mass transfer coefficient, the diffusion
61
coefficient (Dm) and the partitioning coefficient (K). All these models are presented in the
62
reviews of Liu [13] and a comparison between some of the typical models is given elsewhere
63
[15] . Nevertheless, all the mentioned-above models consider only the gas-surface interactions
64
and neglect the chemical reactions that can take place indoors in both homogenous and
65
heterogeneous phases. Therefore, some studies [16, 17] proposed indoor air quality models
66
which accounts for the effect of ventilation, deposition of inorganic species on surfaces,
67
emission and photochemistry reactions with a consideration for a perfect mixing of the air
68
inside simulated room. However, these photochemistry models neglects the sink behavior of
69
surfaces.
70
Concerning the experimental investigations, only laboratory studies have provided adsorption
71
(ka) and desorption (kd) rate coefficients for VOCs on surfaces, to describe the role of these
72
interactions on VOCs indoors concentrations. The experimental procedure is based on the
73
exposure of sample materials, inside an emission test chamber, to artificially polluted
74
atmospheres containing several ppm of VOCs [7, 18-20]. The mixing ratios of VOCs used in
75
these experiments are several orders of magnitude higher than those observed in indoor
76
environments at ppb levels [21] and are then not representative. These works were conducted
77
considering either a single organic compound and a single material [7, 18, 22, 23] or mixtures
78
of VOCs and combinations of materials [5, 24, 25]. To extract the parameters of interest,
M
AN
US
CR
IP
T
AC
CE
PT
ED
3experimental concentration profiles, usually measured by gas chromatography techniques, are
80
fitted by a relevant model, more or less complex as already presented above, depending on the
81
processes considered (sorption processes, diffusion into the material, and diffusion through
82
the boundary layer formed above the material surface) and the type of material (homogenous
83
or porous media). .
84
However, when sorption coefficients derived from chamber experiments was incorporated in
85
indoor air quality (IAQ) models , a significant differences as high as a factor of 9 [6] was
86
shown between modeled concentrations and ambient observations made in test houses. This
87
disagreement may be due to sorption coefficients for real indoor surfaces that are different
88
than those measured during laboratory experiments [6] because the implementation of a
89
material in a real environment and its aging due to varying environmental conditions can
90
affect its sorption properties compared to those observed in laboratory chambers. In addition,
91
the use of inappropriate models to describe real situations can leads to this disagreement as
92
already highlighted by Xu [10] .
93
Given the studies mentioned above, there is actually a need to:
94
• Develop a model that account for all physical and chemical processes occurring indoors
95
such as emission, outdoor input, chemical reactivity and also sorption on the surface of
96
building materials and,
97
• Validate proposed models using more representative experimental data from real
98
environment to determine the influence of each process on the VOCs concentration
99
indoors.
100
Consequently, a research project called MERMAID (Mesures Expérimentales Représentatives
101
et Modélisation Air Intérieur Détaillée / Representative Experimental Measurement-Indoor
102
Air Detailed Model) was designed to address the leaks found in literature as already
103
mentioned above [26]. The originality of the MERMAID project is the combination between
104
an experimental approach based on several types of measurements for VOCs, inorganic gases,
105
particulate matter and reactive species to a modeling approach based on a detailed indoor air
106
quality model called INCA-Indoor, including the physical and chemical processes.
107
Concerning the sorption processes, the INCA-indoor model proposed by Mendez [27] treats
108
the sorption of VOCs on the surface of building materials through the adsorption (ka) and
109
desorption (kd) coefficients represented as a function of the mass transfer coefficient (hm) in
110
the boundary layer. However, the INCA-Indoor model neglects the diffusion or the mass
111
transfer in the inner of the material since several inputs parameters are needed which is
112
difficult to determine on the field (effective diffusion coefficients, initial concentration in the
113
materials...etc) and which also requires computational efforts to solve diffusion equations.
114
Nevertheless, the emission rate coefficient is taken into account to represent the mass transfer
115
in the inner of the material. To meet the objective of the MERMAID project, this study aims
116
to develop a methodology suitable to perform in-situ fast measurements of VOC sorption
117
coefficients in indoor environments and under real conditions. Derived experimental
118
parameters will be useful as data inputs to INCA-indoor air quality model.
M
AN
US
CR
IP
T
AC
CE
PT
ED
4This work aims to develop a method to determine in a fast and simple way the sorption
120
parameters on the surface of a material present in indoor environment. Therefore this work is
121
divided in three steps:
122
(1) Develop a new device based on a field and laboratory emission cell (FLEC) coupled to a
123
proton transfer reaction mass spectrometer (PTRMS);
124
(2) Validate the proposed methodology during laboratory experiments to assess the feasibility
125
of fast in-situ measurements and the limitations of the method applicability; and
126
(3) Compare this method to the traditional emission test chamber method used usually in
127
literature to perform sorption measurements.
128
Only the findings of the first two steps are presented in this part of the study and the
129
comparison with the traditional method is presented in the part 2 which includes a discussion
130
on the usage of the experimental data in the INCA-Indoor model. Therefore, in this first part
131
of the work the sorption properties of a mixture of aromatic VOCs at ppb levels were
132
investigated on an unpainted gypsum board and vinyl flooring presenting contrasting sorption
133
behavior [18]. These VOCs are considered as ubiquitous compounds in indoor environments
134
and presents a large fraction of total VOC concentrations [21, 28-30]. Moreover, BTEX were
135
chosen to test the proposed methodology, because they can be easily purchased in certified
136
cylinders and are not prone to memory effects on sampling materials.
137
2. Materials and Methods
138
2.1. Chemicals
139
For all the experiments, the BTEX mixture was provided by Air products and contained the
140
following VOC in the mixing ratio of 2 for benzene, 6 for toluene, 1 for ethyl benzene, 2 for
141
p-xylene and 1 for o-xylene.
142
2.2. Test materials
143
An unpainted 12.5-mm thick gypsum board and a 2.4-mm thick piece of vinyl flooring were
144
used. Several samples of each material were stored at 4°C for three months before the
145
experiments to ensure that replicate measurements are performed on samples having the same
146
aging history.
147
2.3. Experimental setup
148
The setup used in this study is based on coupling a FLEC (Chematec) and a high resolution
149
PTR-MS (PTR-ToFMS, Kore technology) and presented in Figure 1. The FLEC inlet is
150
connected to two gas generation systems using a three-way valve. The first generation system
151
is composed of a dry zero air generator (Claind) and a humidificator made of a water bubbler
152
and mass flow controllers (MKS). This system is used to supply the FLEC with humid clean
153
air at constant flow rate (200-500 ml.min-1) and stable relative humidity (50±5 % at 23±2°C).
154
The second generation system is made of a VOC cylinder connected to a dilution system (Gas
155
Calibration Units - Ionicon Analytik), which is used to dilute the VOC mixture at a constant
M
AN
US
CR
IP
T
AC
CE
PT
ED
5relative humidity of 50%. The FLEC’s outlet is connected to the PTR-MS to quantify VOC
157
concentrations exiting the cell. An exhaust is left at atmospheric pressure to prevent a pressure
158
build-up in the FLEC apparatus.
159
160
Figure 1. Experimental setup for measuring adsorption and desorption coefficients of VOCs on 161
building materials. 162
The FLEC can be easily handled and fixed on surfaces and the PTR-MS instrument was
163
designed for easy and safe transportation. In fact, the deployment of PTRMS instruments has
164
been demonstrated during field campaigns in ambient air [31] and for indoor studies [32].
165
This setup exhibits reasonable dimensions to be used during intensive field campaigns for
166
research purposes in buildings but is not proposed as a tool for quick indoor air diagnostics
167
due to its high price and high weight.
168
FLEC. The FLEC® is a portable tool commercialized by CHEMATEC, which can be
169
exposed on flat and non-porous surfaces to investigate gas-surface interactions. Technical
170
details have been provided elsewhere [33]. When the cell is exposed on a flat material, it
171
covers a surface area of 177 cm2, leading to a loading factor of 506 m2.m-3. It has a small
172
internal volume (35 mL), which allows conducting fast sorption experiments (a few hours)
173
compared to laboratory emission test chambers of several liters (a few days).
174
PTR-MS. The PTR-MS was chosen as a fast analytical tool to accurately monitor the
175
fast variations of VOC concentrations at the sub ppb level [34] with time resolutions in the
176
range of 2-20 seconds. As shown in the result section, the measurement time resolution is a
177
critical parameter to correctly describe fast sorption processes taking place at the material
178
surface inside the FLEC apparatus. The PTR-MS technique has been described in detail
179
elsewhere [34]. As proposed by De Gouw [34], signals of protonated VOCs are normalized to
180
H3O+ and H3O+(H2O) to correct for a small humidity dependence of the PTR-MS response.
M
AN
US
CR
IP
T
AC
CE
PT
ED
6H3O+(H2O) is an ionic cluster that is formed when humid samples are analyzed. Detected
182
VOC signals are then converted to concentrations (µg.m-3) using calibration coefficients
183
determined experimentally for each targeted species. In the following, ethylbenzene and
o/p-184
xylene are referred as C8-aromatics due to their detection as a sum of isobaric compounds
185
with the PTR-MS. Calibration coefficients were measured before each experiment using zero
186
air and a standard mixture of VOCs provided by IONICON. Response factors measured over
187
a period of 3 months indicate a good stability of the PTR-MS instrument with a relative
188
standard deviation for each species in the range 9-10%. In addition, the stability of the
PTR-189
MS response over the time of a sorption experiment (only a few hours) is estimated to be
190
better than 3% from differences observed between subsequent calibrations performed every
2-191
3 days. VOCs background signals measured using zero air were used to estimate detection
192
limits (LOD) as three times the standard deviation on the zero measurements. Measured
193
LODs are less than 3.4, 4.7 and 11 µg m-3 for a time resolution of 20, 10 and 2 seconds
194
respectively and which is low enough to measure accurately the concentrations used in this
195
study (See Table 1- [15]).
196
2.4. Experimental protocols
197
First of all, a blank experiment is carried out on a Pyrex glass before each sorption experiment
198
on a tested material and using the same procedure. This experiment, referred as “No sink” in
199
the following, allows evaluating sorption processes on internal surfaces of the FLEC
200
apparatus and the Teflon tubing. A sorption experiment involves a 3-step procedure as
201
described in the following. The FLEC is first exposed on a material and supplied with
202
humidified zero air. When concentrations reach relatively steady state, the FLEC is supplied
203
with humid air containing targeted VOCs. This second phase is named “adsorption phase” as
204
illustrated inFigure 2. During this step, VOCs concentrations increase until an equilibrium is
205
reached where the concentrations are equal to those registered for the adsorption phase
206
already performed on the Pyrex glass. Once the VOCs concentrations are stable (Figure 2:
207
teq), humidified zero air is provided to the cell instead of the VOCs mixture. This third phase
208
is named “desorption phase”. During this step, VOC concentrations decrease until steady
209
concentrations similar to those reached in the end of the first phase, are observed (Figure 2).
210
Standard operating conditions were defined as an air temperature of 23 ± 2°C and a relative
211
humidity of 50 ± 5 % for all experiments described in this study.
212
The feasibility of measuring sorption parameters with the FLEC/PTR-MS coupling was first
213
investigated by repeating the same experiment on a gypsum board and a piece of vinyl
214
flooring (FLEC inlet flow rate = 400 mL.min-1; PTR-MS time resolution = 20 s). The VOCs
215
concentrations used for the adsorption phase were closed to 565 µg.m-3 for toluene, 434 µg.m
-216
3
for C8 aromatics, and 160 µg.m-3 for benzene. The VOC steady-state-concentrations
217
measured before the sorption experiment by exposing the material to humidify zero air, are
218
negligible and represent less than 3% of Ce. A second set of experiments was carried out on
219
the gypsum board to test the robustness of this method. It consisted in assessing (1) the
220
repeatability on 5 different samples (of the same board); (2) the repeatability of 4 tests
221
performed consecutively on the same sample; (3) the influence of VOCs concentrations
M
AN
US
CR
IP
T
AC
CE
PT
ED
7(threefold variation); and (4) the influence of different inlet flow rates (threefold variation)
223
keeping VOCs concentrations unchanged. Experimental conditions are listed in Table 1.
224
Table 1. Experimental conditions used to perform tests of robustness on an unpainted gypsum 225
board at a PTR-MS time resolution of 20sec. 226
Test Flow rate
(mL.min-1)
Air exchange rate (h-1)
Specific flow rate per unit of
surface [m3/(h.m2)] Concentration (µg.m-3) Benzene C8 aromatics Toluene R (n=5) 300 514 1.0 106 289 377 M (n=4) 300 514 1.4 106 289 377 F (n=3) 300 400 500 514 686 857 1.0 1.4 1.7 106 289 377 C (n=3) 400 686 1.4 479 868 1131 319 434 565 106 289 377
n: number of experiments; R= Repeatability tests performed on different samples of the same board; M=
227
Multiple successive measurements (replicates on the same sample); F= Inlet flow rate tests performed using
228
three different air flow and C = Concentrations tests performed using three different concentrations.
229
3. Theory and data treatment
230
The data analysis yields values for Cse the mass of VOCs in the sink per unit area of the
231
material at equilibrium (µg.m-2), ka the adsorption rate constant (m.h-1), kd the desorption rate
232
constant (h-1) and Ke (ka/kd) the equilibrium constant (m) described in the following.
233
3.1. Determination of Cs 234
Based on the experimental procedure described above, the mass of VOCs adsorbed on the
235
material is in steady state at time teq. The total mass adsorbed or desorbed by a material
236
corresponds to the area between the sorption curves (FLEC exposed on a material) and the
237
“no sink” curve (FLEC exposed on pyrex), for the adsorption and the desorption phases
238
respectively (Figure 2).
239
Equations (1) and (2) were used to calculate the absorbed and the desorbed mass of VOC
240 respectively. 241 dt A F C C eq t t g se
∫
× = 0 ( 1 ) 242 dt A F C C f eq t t g se∫
× = ( 2 ) 243where, F is the flow rate at the FLEC’s inlet (m3.h-1), A the surface area of the material
244
covered by the cell (177×10-4 m2), and t the exposure time to the VOCs mixture (h).
245
3.2. Determination of ka and kd 246
M
AN
US
CR
IP
T
AC
CE
PT
ED
8The model used to derive sorption parameters from experimental data is the Tichenor model
247
based on the Langmuir theory [7]. This model is based on the assumption that the
248
concentration of a species in bulk air is homogeneous and proportional to the surface
249
concentration. However, this model neglects the diffusion (Dm) inside the material and the
250
mass transfer coefficient (hm) between the surface of the material and the bulk air. Despite
251
these limits, this model is suitable for this work to determine ka and kd coefficients, for the
252
reasons detailed below. Zhang [35] studied the flow filed in the FLEC cavity and calculated
253
the local Sherwood number ShL for the different flow rates (186 to 509 mL.min-1). According
254
to this work, the mass transfer coefficient was calculated in the FLEC cavity for the different
255
flow rates used in Table 1 (See Figure 1 in [36]). The flow field in the FLEC is laminar
256
because the Reynolds number Re varies between 1.4 and 2.3 for.316 mL/min and 509 mL/min
257
respectively (Re<2000 for laminar flow). The mass transfer coefficient is very high on the
258
FLEC periphery and decreases in the center to reach a value varying between 1.4 and 2.3
259
m.h-1. The mass transfer coefficient hm, is always higher than the specific flow rate per unit of
260
surface (Table 1) which means that the that any substance present on the surface of the
261
material is immediately diffused in the transverse direction of the flow by molecular diffusion
262
as already highlighted by Zhu [37]. Therefore, the effect of the mass transfer coefficient is not
263
significant on the concentrations in the FLEC cavity and the concentration measured in the
264
FLEC is considered uniform in the entire cavity (Cg) as Zhang [35] confirmed previously by
265
conducting experimental and numerical studies of the fluid flow and the convective mass
266
transfer coefficients in a FLEC. They concluded that the air becomes nearly saturated shortly
267
after it begins to flow on the emission surface, due to the small spacing between the cap and
268
the bottom surface. Concerning the diffusion in the inner of the material, this parameter is
269
neglected in this work and supposed to be slower than the instantaneous adsorption on the
270
surface of the material, since the FLEC-PTRMS method is dedicated to fast in-situ
271
measurements and the INCA-indoor model neglects the diffusion in the inner of the material.
272
It worth to note that further works will use a model that considers the diffusion coefficient in
273
the inner of the material to determine the diffusion coefficient and this point will be discussed
274
later in this paper.
275
Giving the reasons above, the concentration variations (dCg/dt and dCs/dt) observed in a
276
chamber depends on the adsorption (ka) and desorption (kd) coefficients, as shown in the
277 following equations: 278
L
C
k
L
C
k
NC
NC
dt
dC
s d g a g in g=
−
−
+
( 3 ) 279 s d g a sk
C
k
C
dt
dC
−
=
( 4 ) 280where, N is the air exchange rate (h-1), Cin the VOC concentration at the chamber inlet 281
performed (µ g.m-3), Cg the gas-phase VOC concentration inside the chamber (µg.m-3), ka the 282
adsorption rate constant (m.h-1), kd the desorption rate constant (h-1), Cs the surface 283
concentration (µg.m-2), and L the loading factor (m2.m-3).
M
AN
US
CR
IP
T
AC
CE
PT
ED
9The model used to fit the experimental observations is characterized by equations (3) and (4).
285
Analytical solutions given in equations (5) and (6) can be derived for the desorption phase
286
using the following initial conditions at teq: t = 0 ; Cg(0) = Ce and Cs(0)=Cse=Ce(ka/kd). 287
(
)
(
)
2 1 1 2 ] [ ) ( 2 1 r r e r N e r N C t C t r t r e g − − − − = − − ( 5 ) 288 ) ( ] [ ) ( 2 1 2 1 1 2 r r k e r e r k C t C d t r t r a e s − − = − − ( 6 ) 289 where, 2 ] 4 ) [( ) ( 2 1/2 2 , 1 d d a d aL k N k L k Nk k N r = + + ± + + − 290To determine ka and kd, the concentration time profiles Cg (t) measured from teq to the end of
291
the test (desorption phase) is fitted using equation (5) and a non-linear least square regression
292
procedure in SigmaPlotTM. Ce is the average concentration observed in the gas-phase at the
293
end of the adsorption phase. N, L and Ce are experimental parameters so that they are
294
constrained during the fit.
295
4. Results
296
4.1. Technical feasibility
297
Time-resolved concentration profiles obtained for toluene are shown in Figure 2 for two
298
experiments performed on a gypsum board and a piece of vinyl flooring. Concentration
299
profiles of other compounds are given elsewhere (see Figure 2 in [15]) and exhibit the same
300
behavior.
301
302
Figure 2.Concentration profiles measured during sorption experiments on a gypsum board and a 303
piece of vinyl flooring for benzene, C8 aromatics and toluene. The “no sink” plot is also shown for 304
comparison. 305
The concentration profiles indicate that the duration of a sorption experiment is about (0.5-8
306
hours), which is faster than that observed for regular chamber experiments, usually few days
307
[7, 18]. The experimental no sink profile obtained using Pyrex glass indicate that VOC
308
sorption on the FLEC internal walls is negligible since no difference can be observed with the
M
AN
US
CR
IP
T
AC
CE
PT
ED
10theoretical no sink profile obtained according to the equation
C
gt
C
ee
Nt−
=
)
(
. In addition,310
these results figure out different sorption behaviors for the 2 materials as seen from the total
311
mass adsorbed on the material at equilibrium and the time needed to reach this equilibrium.
312
Similar concentration profiles are observed for vinyl flooring and pyrex, suggesting low
313
sorption properties for this material. As a consequence, experiments discussed below to
314
characterize the proposed methodology were only performed using the gypsum board, which
315
exhibit significant sorption properties. Values of ka and kd were evaluated for the gypsum
316
board by fitting Equation (4) to concentration profiles acquired during the desorption phase as
317
described in the theory and data treatment section. Obtained values for ka and kd are
318
respectively (3.2 m.h-1-24 h-1) for benzene, (1.3 m.h-1-1.6 h-1) for C8 aromatics and (1.7 m.h-1
-319
5.5 h-1) for toluene. The modeled curves shown in Figure 3 are in good agreement with
320
experimental observations because the correlation coefficient R2 is very close to 1 (0.96 for
321
benzene, 0.97 for C8 aromatics and 0.97 for toluene). This good agreement is also observed
322
for the first minutes of the experiments (Figure 3 (d)) contrary to some previous studies made
323
using emission chambers [7, 38].
324
325
326
Figure 3. Analysis of the desorption phase for the gypsum board: Benzene (a), C8 aromatics (b), 327
and toluene (c, d). The “no sink” curve is also shown in grey for comparison. The first minutes of 328
the toluene decay are expended in panel (d) to evaluate the “best-fit” curve. 329 4.2. Robustness 330 (a) (d) (c) (b)
M
AN
US
CR
IP
T
AC
CE
PT
ED
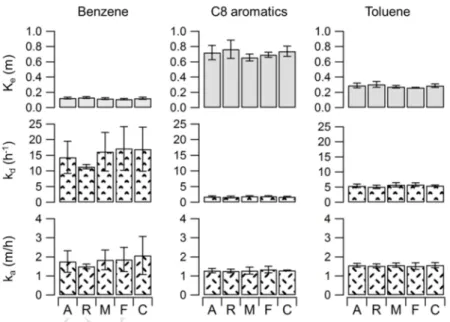
11Figure 4 shows mean values of ka, kd and Ke measured for the targeted VOCs for the Gypsum
331
board and using experimental conditions described above in Table 1. The first set of
332
experiments made on different samples of the same gypsum board (R in Figure 4) indicates a
333
good repeatability for the 5 tests, with RSD (1σ) values lower than 17% for ka, kd, and Ke.
334
Four adsorption/desorption cycles (M in Figure 4) made successively on the same sample also
335
show a good repeatability for Ke, ka, and kd, with RSD values lower than 12%, except for
336
benzene for which the RSD reaches 38% for kd. The high uncertainty seen on the
337
determination of benzene sorption parameters is due to the fact that the benzene profile is
338
close to that obtained on pyrex glass, having negligible sorption effect. The uncertainty on the
339
determination of low sorption values will be discussed later in this work. Tests performed at
340
different VOCs concentrations (C in Figure 4), as well as different inlet flow rates (F in
341
Figure 4), give consistent results for sorption parameters with RSD values lower than 12% for
342
C8 aromatics and toluene but around 40% for benzene. These results highlight that the
343
determination of sorption coefficients does not depend on operating conditions such as the
344
VOCs concentration used, the inlet flow rate, and the number of measurements made
345
previously on the investigated material.
346
347
Figure 4.Average results for ka, kd and Ke measured on the gypsum board using a mixture of
348
aromatic compounds (A=All experiments; R=Repeatability experiments; M = Multiples adsorption-349
desorption experiments on the same piece of material; F = different air flow rates at the FLEC 350
inlet; C = different concentrations of VOCs). Error bars correspond to 1 standard deviation. 351
5. Discussion
352
5.1. Method evaluation
353
Based on the results shown above, the FLEC/PTR-MS coupling appears as a promising setup
354
to measure sorption coefficients of VOCs on building materials within a few hours (1-16
355
hours). Compared to common test chamber experiments usually conducted over 27-600 hours
356
(i.e. over 1-24 days) [18-20, 38, 39], the experimental time is reduced by a factor of 54-75.
357
This method exhibits also a good repeatability and the determination of sorption coefficients
358
is independent on gas concentration or the number of tests investigated on the same sample.
M
AN
US
CR
IP
T
AC
CE
PT
ED
12In addition, derived parameters are independent on flow rates conditions, which validated the
360
choice of the Langmuir model to extract sorption parameters from experiments performed
361
using an enclosure where the gas-phase concentration above the material is homogenous
362
under the conditions of this study.
363
The applicability of the Langmuir isotherm was verified by investigating the partitioning of
364
VOCs between the gas and adsorbed phases when the equilibrium is reached. The relationship
365
between Cse (calculated from equations 1 and 2) and Ce (experimental measurements) for the
366
Gypsum board and target VOCs, shows a linear trend with a correlation coefficient of 0.92,
367
0.80 and 0.94 respectively for benzene, C8 aromatics and toluene (See Figure 3 in [15]).
368
According to the relation (Cse=Ce×Ke), the slope of the regression line should be equal to Ke.
369
The slope determined for benzene (0.16), C8 aromatics (0.66) and toluene (0.29) is in
370
excellent agreement with the average Ke value derived from 15 measurements presented in
371
Figure 4. This linear relationship confirms that Langmuir equilibrium can be applied at the
372
concentrations used in this study (106-1131 µ g.m-3).
373
In order to test the robustness of the fitting procedure, multiple fits have been performed for
374
several sorption experiments by varying the end-time of desorption phase (Table 2). All
375
desorption phases were performed for 450 minutes and then were analyzed for three different
376
time durations of 450, 300, and 200 minutes.
377
Table 2. Comparison between ka and kd values derived from the fitting procedure applied to the
378
gypsum board. All experimental measurements were made for duration of 450 minutes. 379
Mathematical fits were performed using an end-time set at 450, 300, and 200 minutes of the 380
desorption phase. Errors correspond to 1σ standard deviation. Number of replicates = 5. 381
Time of desorption phase (min)
Benzene C8 aromatics Toluene
ka (m.h -1 ) kd (h -1 ) ka (m.h -1 ) kd (h -1 ) ka (m.h -1 ) kd (h -1 ) 450 1.8±0.57 16±5.2 1.3±0.11 2,0±0.24 1.6±0.11 6.2±0.59 300 1.6±0.16 12±1.1 1.3±0.10 1.8±0.32 1.6±0.05 5.2±0.35 200 1.7±0.24 15±3.4 1.2±0.13 2.1±0.35 1.6±0.04 5.8±0.69 382
This test indicates that determinations of ka and kd are robust for these 3 experimental
383
durations. Deviations between individual calculated values and mean values (of all sorption
384
experiments) are within the experimental RSD displayed in Figure 4 (10-17 %). This result
385
also indicates that the time of a sorption experiment, including adsorption and desorption
386
phases, can be adjusted to less than 7 hours for this type of material.
387
5.2. Limitations of applicability
388
While the setup described in this study is suitable for fast measurements of sorption
389
coefficients in laboratory and indoor environments, this setup exhibits some drawbacks. On
390
the first hand, it is important to avoid high leakage between the cell and the material. For
391
homogenous and flat materials, the cell can be directly exposed on the surface. However,
392
porous or rough surfaces cannot be sampled directly and need to be introduced in a sub unit
393
(cylindrical container) made of aluminum, with the FLEC exposed on the top of the container.
394
Even if this method is destructive in the case of porous materials, it still exhibits the
M
AN
US
CR
IP
T
AC
CE
PT
ED
13advantage of reducing the measurement time compared to test chambers. In addition,
396
measurements of sorption coefficients require a fast analytical tool such as the PTR-MS
397
instrument used in this study. In addition, PTR-MS instruments can only measure a limited
398
number of VOCs present in indoor environments and some species such as formaldehyde
399
cannot be measured due to a proton affinity that is only slightly higher than the water proton
400
affinity [34]. Further studies should focus on coupling the FLEC apparatus to other fast
401
analyzers, such as a formaldehyde analyzer to study interactions of this important indoor
402
pollutant with indoor surfaces. Fast analytical tools that are currently under development in
403
several laboratories, designed to measure different compounds, may offer a more compact and
404
lighter alternative than the PTR-MS.
405
On the other hand, the Langmuir model used to extract sorption parameters neglects the
406
diffusion inside material which is an important key parameter for indoor air quality models.
407
Nevertheless, Jorgensen [40] used previously the Langmuir model and a diffusion model to
408
analyze sorption experiments performed in emission test chambers. They found that the
409
adsorption and desorption coefficients still unchanged between the two models even if the
410
diffusion models determined a supplementary diffusion coefficients. Further works will be
411
conducted to analyze experimental data obtained by the FLEC-PTRMS method, using a
412
model that accounts for the diffusion in the inner of the material, to determine the VOCs
413
diffusion coefficient.
414
In order to determine the lower values of sorption parameters that could be measured with this
415
method, measurements made on a piece of vinyl flooring exhibiting sorption properties close
416
to that observed for a Pyrex glass, were investigated at different PTR-MS time resolutions.
417
Indeed, an adsorption experiment made at a time resolution of 20 seconds showed that it was
418
not possible to extract sorption coefficients from the desorption phase using equation (5) due
419
to a fast decrease of VOCs concentrations (over a few minutes). Additional experiments were
420
performed at resolution times of 10 and 2 seconds. These experiments showed that ka and kd
421
values could only be extracted from measurements performed at the fastest time resolution of
422
2 seconds (Table 3).
423
Table 3.Average values of ka, kd, and Ke for a piece of vinyl flooring at a PTR-MS time resolution of
424
2 seconds. Number of replicates = 5. 425
VOC Toluene C8 aromatics Benzene
Sorption parameters ka (m.h-1) kd (h-1) Ke (m) ka (m.h-1) kd (h-1) Ke (m) ka (m.h-1) kd (h-1) Ke (m) Average 0,06 11 0,01 0,18 17 0,01 0,03 8,3 0,01 Std 0,02 5,2 0,01 0,03 5,2 0,01 0,02 9,0 0,01 RSD (%) 28 46 26 18 30 16 57 109 119
RSD values calculated from 5 replicates range from 15-110% and are higher than values
426
determined for the gypsum board due to higher noise levels on the PTR-MS measurements at
427
faster time resolutions (Table 3). These results highlight that large uncertainties are associated
428
to the determination of weak sink effects. However, materials exhibiting very weak sink
429
effects will have minor influences on the variation of VOCs concentrations in indoor
430
environments.
M
AN
US
CR
IP
T
AC
CE
PT
ED
14As mentioned above, faster measurements lead to higher noise levels on measured signals,
432
and thus lead to a degradation of the measurement precision. Therefore, the best conditions
433
correspond to a compromise between temporal resolution and noise levels. To determine the
434
best operating conditions of the proposed setup, a set of curves, characteristic of the
435
desorption phase, was simulated at 3 different time resolution (2, 10 and 20 seconds) using
436
equation (4), an air exchange rate of 514 h-1 and several values of adsorption (ka) and
437
desorption (kd) coefficients. To reduce the number of couples for ka and kd, the same value
438
was used for both parameters. The simulations were also performed using experimental values
439
measured for the vinyl flooring at a PTR-MS time resolution of 2 seconds. Equation (4) was
440
fitted on the simulated curves using Sigma Plot to check whether the mathematical fit is
441
capable of retrieving the values of ka and kd used to generate the curves. The accuracy of the
442
fit was calculated as the difference observed between values of ka and kd used to simulate the
443
curves and values determined by fitting the curve as shown in Table 4.
444
Table 4.Accuracy determined by simulation for low values of ka and kd for three PTR-MS temporal
445
resolutions. 446
Temporal resolution (sec) ka (m h-1) kd (h-1) Accuracy ka (%) Accuracy kd (%)
2 0.01 0.01 9.89 10.00 0.02 0.02 4.71 5.00 0.10 0.10 0.10 0.10 0.01 0.10 0.001 0.60 0.10 0.01 1.20 1.00 0.03 17.00 0.33 0.24 10 0.07 0.07 6.22 8.71 0.09 0.09 2.51 4.33 0.10 0.10 1.63 3.00 20 0.09 0.09 5.39 10.11 0.10 0.1 3.63 7.30 0.20 0.20 0.02 0.95
An accuracy lower than 10% is considered as satisfactory to accurately determine ka and kd. A
447
close inspection of Table 4 indicates that temporal resolutions of 20 and 10 seconds are fast
448
enough to accurately measure adsorption and desorption parameters (ka; kd) as low as
449
(0.09m.h-1; 0.09h-1) and (0.07m.h-1; 0.07h-1), respectively. Faster measurements (2 seconds
450
time resolution) are needed to determine lower values down to ka=0.01m.h-1 and kd=0.01h-1. It
451
is important to note that these results only provide an estimation of the lower values of ka and
452
kd that can be measured at a specific time resolution with the FLEC-PTRMS coupling since
453
combinations of different values of ka and kd are usually observed. Experimental values
454
derived for the vinyl flooring were also tested and they prove that more resolute
455
measurements are necessary to accurately determine sorption coefficients in this range. In
456
addition, these simulations indicated that the determination of low values of ka is more
457
impacted by the temporal resolution than kd because the value of ka is mainly determined by
458
using the first minutes of the experimental measurements.
459
5.3. Literature comparison
460
Won [6] measured sorption coefficients for a gypsum board exposed to toluene and
461
ethylbenzene. Tichenor et al. [7] also report sorption coefficients of toluene for the same type
M
AN
US
CR
IP
T
AC
CE
PT
ED
15of material. To the best of our knowledge, there is no measurement of sorption coefficients for
463
benzene available in the literature. Sorption coefficients measured in this study are in the
464
same order of magnitude of previous studies and show a difference by a factor of 2-3 times
465
for Ke parameter (Table 5). However, a difference is also reported between previous works for
466
the same type of material with ethylbenzene. For the vinyl flooring the difference is more
467
important. This difference can be due to the composition of the tested material as reported by
468
Won [41]. The aging of the surface, or its physicochemical properties may also introduce
469
some variability in the results as observed by Meininghaus [42]. From the other hand, this
470
difference can be due to the inappropriate use of the Tichenor model for emission test
471
chambers used for sorption experiments. The effect of the mass transfer due to the presence of
472
a boundary layer on the surface of the tested material can have an important effect on the
473
determination of sorption parameters. The companion paper (part 2 of this work), will present
474
a comparison using an emission test chamber and the same type of material and the same
475
VOCs mixture. Therefore, different type of models will be used to determine sorption
476
parameters with a consideration for the effect of the mass transfer coefficient and the effect of
477
the boundary layer.
478
Table 5. Comparison of literature values of Ke for a gypsum board with results from this 479 study. 480 VOCs ka (m.h -1 ) kd (h -1 ) Ke (m) References
Benzene 1.8 ± 0.57 14 ± 5.2 0.12 ± 0.01 This work
Toluene 0.21 1.7 0.12 [6]
1.6 ± 0.11 5.4 ± 0.59 0.29 ± 0.03 This work
Ethylbenzene 0.21 0.87 0.24 [6]
0.45 1.50 0.30 [7]
C8 aromatics 1.3 ± 0.11 1.8 ± 0.24 0.72 ± 0.09 This work
6. Conclusions
481
The proposed experimental approach, based on a FLEC-PTRMS coupling, has been used
482
successfully to measure sorption coefficients of aromatic compounds on different types of
483
materials. This method presents the advantage to be transportable and non-destructive method
484
for flat and homogeneous material to perform fast measurements in real environments and
485
under indoor conditions. Moreover, this new setup exhibits the advantage of reducing the
486
measurement time to 0.5-8 hours compared to emission test chambers that require several
487
days of measurements and allows measuring low sorption values. The FLEC/PTR-MS
488
coupling allows measuring low sorption values and will be used for in-situ measurements in
489
energy efficient buildings. Sorption coefficients determined on the field will be then used as
490
inputs for a new indoor air quality model (INCA-indoor) that takes into account the boundary
491
layer effect and the mass transfer coefficient, to predict VOCs concentrations in indoor
492
environments (see companion paper). The FLEC-PTRMS method will be compared in the
493
part 2 of this work, to the traditional emission test chamber method used previously in
494
literature to measure sorption parameters only on the laboratory scale. Further works, will use
495
a more complex model to take into account for the diffusion inside building materials.
496
Acknowledgments
M
AN
US
CR
IP
T
AC
CE
PT
ED
16The authors would like to thank the French Environment and Energy Management Agency
498
ADEME (Agence De l'Environment et de la Maîtrise de I'Energie) for their financial support
499
in this study, through the MERMAID project (PRIMEQUAL Program).
500
References
501
[1] Jung, C.C., H.J. Su and H.H. Liang, Association between indoor air pollutant exposure and 502
blood pressure and heart rate in subjects according to body mass index. Science of The Total 503
Environment, 2016. 539: p. 271-276. 504
[2] Vanker, A., W. Barnett, P.M. Nduru, R.P. Gie, P.D. Sly, and H.J. Zar, Home environment and 505
indoor air pollution exposure in an African birth cohort study. Science of The Total 506
Environment, 2015. 536: p. 362-367. 507
[3] Patelarou, E., N. Tzanakis and F.J. Kelly, Exposure to indoor pollutants and wheeze and 508
asthma development during early childhood. International Journal of Environmental 509
Research and Public Health, 2015. 12(4): p. 3993-4017. 510
[4] Weschler, C.J., Chemistry in indoor environments: 20 years of research. Indoor Air, 2011. 511
21(3): p. 205-218. 512
[5] Singer, B.C., K.L. Revzan, T. Hotchi, A.T. Hodgson and N.J. Brown, Sorption of organic gases in 513
a furnished room. Atmospheric Environment, 2004. 38(16): p. 2483-2494. 514
[6] Won, D.Y., D.M. Sander, C.Y. Shaw, R.L. Corsi and D.A. Olson, Validation of the surface sink 515
model for sorptive interactions between VOCs and indoor materials. Atmospheric 516
Environment, 2001. 35: p. 4479-4488. 517
[7] Tichenor, B.A., Z. Guo, J.E. Dunn, L.E. Sparks and M.A. Mason, The Interaction of Vapour 518
Phase Organic Compounds with Indoor Sinks Indoor air 1991. 1(1): p. 23-35. 519
[8] Little, J.C. and A.T. Hodgson, A strategy for characterizing homogenous, diffusion-controlled 520
indoor sources and sinks. ASTM STP 1287, 1996: p. 293-304. 521
[9] Deng, B., R. Tian and C. Kim, An analytical solution for VOCs sorption on dry building 522
materials. Heat and Mass Transfer, 2007. 43(4): p. 389-395. 523
[10] Xu, Y. and Y. Zhang, An improved mass transfer based model for analyzing VOC emissions 524
from building materials. Atmospheric Environment, 2003. 37(18): p. 2497-2505. 525
[11] Lee, C.S., F. Haghighat and W. Ghaly, A study on VOC source and sink behavior in porous 526
building materials–analytical model development and assessment. Indoor Air, 2005. 15(3): p. 527
183-196. 528
[12] Hu, H.P., Y.P. Zhang, X.K. Wang and J.C. Little, An analytical mass transfer model for 529
predicting VOC emissions from multi-layered building materials with convective surfaces on 530
both sides. International Journal of Heat and Mass Transfer, 2007. 50(11-12): p. 2069-2077. 531
[13] Liu, Z., W. Ye and J.C. Little, Predicting emissions of volatile and semivolatile organic 532
compounds from building materials: A review. Building and Environment, 2013. 64: p. 7-25. 533
[14] Xiong, J., C. Liu and Y. Zhang, A general analytical model for formaldehyde and VOC 534
emission/sorption in single-layer building materials and its application in determining the 535
characteristic parameters. Atmospheric Environment, 2012. 47: p. 288-294. 536
[15] M. Rizk , M. Verriele, S. Dusanter , C. Schoemaecker, S. Le Calve , and N. Locoge, Fast sorption 537
measurements of volatile organic compounds on building materials: Part 1 - Methodology 538
developed for field applications. Data in brief, Submitted, 2016. 539
[16] Carslaw, N., A new detailed chemical model for indoor air pollution. Atmospheric 540
Environment, 2007. 41(6): p. 1164-1179. 541
[17] Sarwar, G., R. Corsi, Y. Kimura, D. Allen and C.J. Weschler, Hydroxyl radicals in indoor 542
environments. Atmospheric Environment, 2002. 36(24): p. 3973-3988. 543
[18] An, Y., J.S. Zhang and C.Y. Shaw, Measurements of VOC adsorption/desorption characteristics 544
of typical interior building materials. HVAC&R Research: International Journal of Heating, 545
Ventilating, Air- Conditioning and Refrigerating Research, 1999. 5(4): p. 297-316. 546
M
AN
US
CR
IP
T
AC
CE
PT
ED
17 [19] Colombo, A., M. De Bortoli, H. Knoppel, E. Pecchio and H. Vissers, Adsorption Of Selected 547Volatile Organic Compounds On A Carpet, A Wall Coating, And A Gypsum Board In A Test 548
Chamber. INDOOR AIR, 1993. 3(4): p. 276-282. 549
[20] Popa, J. and F. Haghighat, The impact of VOC mixture, film thickness and substrate on 550
adsorption/desorption characteristics of some building materials. Building and Environment, 551
2003. 38(7): p. 959-964. 552
[21] Schripp, T., T. Salthammer, C. Fauck, G. Bekö and C.J. Weschler, Latex paint as a delivery 553
vehicle for diethylphthalate and di-n-butylphthalate: Predictable boundary layer 554
concentrations and emission rates. Science of The Total Environment, 2014. 494–495: p. 299-555
305. 556
[22] Bouhamra, W. and A. Elkilani, Development of a Model for the Estimation of Indoor Volatile 557
Organic Compounds Concentration Based on Experimental Sorption Parameters. 558
Environmental Science & Technology, 1999. 33(12): p. 2100-2105. 559
[23] Kirchner, S., F. Maupetit, D. Quenard, P. Rouxel and D. Giraud, Characterization of 560
adsorption/desorption of volatile organic compounds on indoor surface materials. Healthy 561
Buildings 95, proceedings of a conference held Milan, 1995: p. 953-958. 562
[24] Jorgensen, R.B. and O. Bjorseth, Sorption behaviour of volatile organic compounds on 563
material surfaces - The influence of combinations of compounds and materials compared to 564
sorption of single compounds on single materials. Environment International, 1999. 25(1): p. 565
17-27. 566
[25] Wouda, P., P.M. Bluyssen, H.J.M. Cornelissen, A.W. Hoogeveen and J.F.V.d. Wal, Chemical 567
and sensory evaluation of sorption effects of chemicals on combined indoor materials in 568
comparison to sorption effects on the individual materials. Proceedings of Healthy Buildings 569
’97, Washington DC, 1997. 2: p. 225-230. 570
[26] Schoemaecker, C., M. Verriele, B. Hanoune, D. Petitprez, N. Leclerc, M. Rizk, S. Dusanter, S. 571
Le Calve, M. Millet, P. Bernhardt, M. Mendez, N. Blond, D. Hauglustaine, A. Clappier, P. 572
Blondeau, M. Abadie, and N. Locoge, Experimental and modeling characterizations of indoor 573
air quality in low energy public buildings in france - The mermaid program. Proceedings to 574
Indoor Air 2014: p. 573-580. 575
[27] Mendez, M., N. Blond, P. Blondeau, C. Schoemaecker and D.A. Hauglustaine, Assessment of 576
the impact of oxidation processes on indoor air pollution using the new time-resolved INCA-577
Indoor model. Atmospheric Environment, 2015. 122: p. 521-530. 578
[28] Pekey, H. and D. Arslanbaş, The Relationship Between Indoor, Outdoor and Personal VOC 579
Concentrations in Homes, Offices and Schools in the Metropolitan Region of Kocaeli, Turkey. 580
Water, Air, and Soil Pollution, 2008. 191(1-4): p. 113-129. 581
[29] Sarigiannis, D.A., S.P. Karakitsios, A. Gotti, I.L. Liakos and A. Katsoyiannis, Exposure to major 582
volatile organic compounds and carbonyls in European indoor environments and associated 583
health risk. Environment International, 2011. 37(4): p. 743-765. 584
[30] Sofuoglu, S.C., G. Aslan, F. Inal and A. Sofuoglu, An assessment of indoor air concentrations 585
and health risks of volatile organic compounds in three primary schools. International Journal 586
of Hygiene and Environmental Health, 2011. 214(1): p. 36-46. 587
[31] Blake, R.S., P.S. Monks and A.M. Ellis, Proton-Transfer Reaction Mass Spectrometry. Chemical 588
Reviews, 2009. 109(3): p. 861-896. 589
[32] Schripp, T., S. Etienne, C. Fauck, F. Fuhrmann, L. Märk, and T. Salthammer, Application of 590
proton-transfer-reaction-mass-spectrometry for Indoor Air Quality research. Indoor Air, 2014. 591
24(2): p. 178-189. 592
[33] Wolkoff, P., An emission cell for measurement of volatile organic compounds emitted from 593
building materials for indoor use - the field and laboratory emission cell FLEC. Gefahrstoffe-594
Reinhaltung der Luft, ALLEMAGNE, 1996a. 56: p. 151-157. 595
[34] De Gouw, J. and C. Warneke, Measurements of volatile organic compounds in the earth's 596
atmosphere using proton-transfer-reaction mass spectrometry. Mass Spectrom Rev, 2007. 597
26(2): p. 223-57. 598
M
AN
US
CR
IP
T
AC
CE
PT
ED
18 [35] Zhang, L.Z. and J.L. Niu, Laminar fluid flow and mass transfer in a standard field and 599laboratory emission cell. International Journal of Heat and Mass Transfer, 2003. 46(1): p. 91-600
100. 601
[36] M. Rizk , M. Verriele, M. Mendez , N. Blond , S. Dusanter , C. Schoemaecker, P. Blondeau , S. 602
Le Calve , and N. Locoge, Fast sorption measurements of volatile organic compounds on 603
building materials: Part 2 - Comparison between FLEC and CLIMPAQ Methods Data in brief, 604
Submitted, 2016. 605
[37] Zhu, Q., S. Kato, S. Murakami and K. Ito, 3D-CFD analysis of diffusion and emission of VOCs in 606
a FLEC cavity. Indoor Air, 2007. 17(3): p. 178-188. 607
[38] Liu, X., Z. Guo, L.E. Sparks and N.F. Roache, VOC sink behaviour on building materials-model 608
evaluation. Indoor and Built Environment, 2012. 20(6): p. 661-676. 609
[39] Meininghaus, R., L. Gunnarsen and H.N. Knudsen, Diffusion and Sorption of Volatile Organic 610
Compounds in Building Materials−Impact on Indoor Air Quality. Environmental Science & 611
Technology, 2000. 34(15): p. 3101-3108. 612
[40] Jorgensen, R.B., T.H. Dokka and O. Bjorseth, Introduction of a Sink-Diffusion Model to 613
Describe the Interaction between Volatile Organic Compounds (VOCs) and Material Surfaces, 614
2000, Munksgaard International Publishers. p. 27-38. 615
[41] Won, D., R.L. Corsi and M. Rynes, New Indoor Carpet as an Adsorptive Reservoir for Volatile 616
Organic Compounds. Environmental Science & Technology, 2000. 34(19): p. 4193-4198. 617
[42] Meininghaus, R. and E. Uhde, Diffusion studies of VOC mixtures in a building material. Indoor 618
Air, 2002. 12(4): p. 215-222. 619
M
AN
US
CR
IP
T
AC
CE
PT
ED
Highlights• Development of a new methodology to measure in-situ VOCs sorption on building materials
• Evaluation of sorption parameters under real conditions within few hours
• Measurement of low sorption properties with 10% of accuracy