Validation of x-ray microfocus computed tomography as an imaging tool for
porous structures
G. Kerckhofs, J. Schrooten, T. Van Cleynenbreugel, S. V. Lomov, and M. Wevers
Citation: Rev. Sci. Instrum. 79, 013711 (2008); doi: 10.1063/1.2838584
View online: http://dx.doi.org/10.1063/1.2838584
View Table of Contents: http://rsi.aip.org/resource/1/RSINAK/v79/i1
Published by the American Institute of Physics.
Related Articles
Combined resistive and laser heating technique for in situ radial X-ray diffraction in the diamond anvil cell at high pressure and temperature
Rev. Sci. Instrum. 84, 025118 (2013)
The Oxford-Diamond In Situ Cell for studying chemical reactions using time-resolved X-ray diffraction Rev. Sci. Instrum. 83, 084101 (2012)
Synchrotron-based ultrafast x-ray diffraction at high repetition rates Rev. Sci. Instrum. 83, 063303 (2012)
Shortening x-ray pulses for pump-probe experiments at synchrotrons J. Appl. Phys. 109, 126104 (2011)
High-pressure and high-temperature x-ray diffraction cell for combined pressure, composition, and temperature measurements of hydrides
Rev. Sci. Instrum. 82, 065108 (2011)
Additional information on Rev. Sci. Instrum.
Journal Homepage: http://rsi.aip.org
Journal Information: http://rsi.aip.org/about/about_the_journal
Top downloads: http://rsi.aip.org/features/most_downloaded
Validation of x-ray microfocus computed tomography as an imaging tool
for porous structures
G. Kerckhofs,1,a兲J. Schrooten,1T. Van Cleynenbreugel,2,3S. V. Lomov,1and M. Wevers1 1
Department of Metallurgy and Materials Engineering, Katholieke Universiteit Leuven, Kasteelpark Arenberg 44-bus 2450, B-3001 Leuven, Belgium
2
Division of Biomechanics and Engineering Design, Katholieke Universiteit Leuven, Celestijnenlaan 300C, B-3001 Leuven, Belgium
3
Materialise Dental NV, Technologielaan 15, B-3001 Leuven, Belgium
共Received 24 September 2007; accepted 3 January 2008; published online 31 January 2008兲 X-ray microfocus computed tomography 共micro-CT兲 is recently put forward to qualitatively and quantitatively characterize the internal structure of porous materials. However, it is known that artifacts such as the partial volume effect are inherently present in micro-CT images, thus resulting in a visualization error with respect to reality. This study proposes a validation protocol that in the future can be used to quantify this error for porous structures in general by matching micro-CT tomograms to microscopic sections. One of the innovations of the protocol is the opportunity to reconstruct an interpolated micro-CT image under the same angle as the physical cutting angle of the microscopic sections. Also, a novel thresholding method is developed based on matching micro-CT and microscopic images. In this study, titanium porous structures are assessed as proof of principle. It is concluded for these structures that micro-CT visualizes 89% of the total amount of voxels共solid and pore兲 correctly. However, 8% represents an overestimation of the real structure and 3% are real structural features not visualized by micro-CT. When exclusively focusing on the solid fraction in both the micro-CT and microscopic images, only an overestimation of about 5% is found. © 2008 American Institute of Physics. 关DOI:10.1063/1.2838584兴
I. INTRODUCTION
Porous materials are ubiquitous in modern life: in chemi-cal industry as filter materials, in buildings as insulation or heat exchangers, or even in the human body as cancellous bone or porous scaffolds for tissue engineering. In order to understand and simulate the functional behavior of these ma-terials, a correct visualization and description of the mor-phology is desired. X-ray microfocus computed tomography 共micro-CT兲 is recently put forward by many researchers to qualitatively and quantitatively characterize the internal structure of porous materials. It provides a means to acquire a complete three-dimensional 共3D兲 image of the structure visualizing the internal architecture at the microscopic level in a nondestructive way. Additionally, the micro-CT images enable subsequent image analysis, resulting in a 3D quanti-fication of the internal structure. However, although micro-CT is widely used in diverse scientific fields1–8 and most advantages and limitations are known,9,10 one of the prerequisites for correct analysis of the micro-CT data is to ensure and quantify the accuracy and reliability of the im-ages used. It is known that artifacts such as the partial vol-ume effect共PVE兲 are inherently present in micro-CT images, thus resulting in a visualization error with respect to reality. But how large is this error and how does it express itself?
The accuracy of micro-CT depends on various factors. When the equipment itself is concerned, the focal spot as well as the detector can limit the attainable spatial resolution. Also, the specimen size and selected region of interest共ROI兲 influence the voxel size of the images. Since for example the PVE depends directly on the resolution, the accuracy of the images goes down with lower resolution. Currently, attain-able spatial resolutions lie in the range of 10m for
stan-dard micro-CT, in the range of 1 – 2m for high resolution standard, and synchrotron micro-CT, and in the range of 0.4– 0.6m for nano-CT.11Currently, standard micro-CT is still the most widely used form of micro-CT and is applied in this work. For cancellous bone, having a global porosity be-tween 50% and 90% and having trabeculae with thicknesses between 100 and 200m, the spatial resolution of standard micro-CT is sufficient to accurately visualize the surface of individual trabeculae, as stated by Muller et al.12 However, architectures with structural features in the same order of magnitude as the focal spot or voxel size, for example, thin struts or micropores, are difficult to be visualized accurately leading to an erroneous analysis.
The image quality 共e.g., the contrast in the images兲 de-pends among other things on the material and architecture of the specimen. Metals, for example, generally cause artifacts such as streaks, beam hardening, PVE, and scattering13,14 more pronounced than ceramics, resulting in less image qual-ity meaning less accuracy. Low densqual-ity polymers, on the a兲Author to whom correspondence should be addressed. Tel:⫹32 16321193.
FAX:⫹32 16321990. Electronic mail: [email protected]. Postal address: Kasteelpark Arenberg 44 bus 2450, 3001 Heverlee, Belgium.
other hand, need quite extreme acquisition parameters共low voltage and current兲, leading to less contrast and hence also to less image quality.
The best-known validation technique for micro-CT when applied to porous structures is the case of bone where com-parison is made with histology by comparing the structural parameters.15–23Although this validation protocol is consid-ered as the “golden standard,” it still contains several short-comings. First, histological sectioning and staining is used for the assessment of biological tissues. Thus, when porous materials in general are addressed, for example, aluminium heat exchangers, it cannot be applied but similar metallo-graphic sample preparation and image analysis need to be performed. Additionally, it was found in literature that up to now, when the physical cutting angle of the histological sec-tions does not coincide with the reconstruction angle of the micro-CT images, no interpolation is made. Instead, the micro-CT image that resembles the histological section the best is considered for the matching. This can already give rise to a mismatch.15,16,18 Also, most studies compare micro-CT to histology based on structural parameters. How-ever, as also stated by Stoppie et al.,23it is a misunderstand-ing that a good correlation between structural parameters should necessarily mean identical images.
Thus, although micro-CT is extensively used for the characterization of porous materials, the accuracy and the reliability of the images still needs quantification. The goal of this work is to establish a protocol for the validation of micro-CT as an imaging tool for porous structures by match-ing micro-CT tomograms to microscopic sections. A set of validation parameters can be defined per set of acquisition parameters, determined for a particular sample共material, ge-ometry, and dimensions兲 on a particular micro-CT device, and for images with a comparable spatial resolution. One of the innovations of the protocol is the possibility to recon-struct an interpolated micro-CT image under the same angle as the physical cutting angle of the microscopic sections. Additionally, a novel thresholding method is developed based on matching the micro-CT and microscopic images.
II. MATERIALS AND METHODS A. Sample material
In this study, cylindrical porous titanium structures with thin struts 共Fig. 1兲 are selected as a first material to investigate the validation protocol. These cylinders have a
mean radius of 3.00⫾0.05 mm and a mean height of 10.0⫾0.1 mm 关supplied by VITO 共Mol, Belgium兲兴. They are produced by gel casting,24,25 resulting in porous structures with struts ranging from 20 to 100m, pores ranging from 50 to 500m and a global porosity of about 80%. The broad range in strut thickness and pore size is preferred to address structural elements much larger than the attainable spatial resolution together with the smallest possible structural ele-ments to be visualized by micro-CT in the same sample.
B. Micro-CT equipment
In micCT, contrary to medical CT, the sample is ro-tated between a fixed x-ray source and detector. The source generates a polychromatic spectrum where the x-ray inten-sity is a function of the photon energy. The spectrum depends on the acquisition parameters, namely, the voltage, the cur-rent, and the applied filter material. The polychromatic x-rays pass through the sample where they are attenuated. The intensities of the attenuated x-rays are measured by the detector, and by applying a mathematical algorithm26 on these measurements, gray-level images representing the at-tenuation inside the sample are reconstructed. In case of 8-bit images, the gray levels range from 0 to 255 representing the minimum and maximum intensities respectively. The result-ant images are two-dimensional共2D兲 and show the geometry of the sample in the plane of the cross section. A series of 2D images can then be combined to create a 3D representation of the sample. A more detailed description of the technique can be found in Refs.26–28. For this study, a Philips HOMX 161 x-ray system withAEA TOMOHAWKCT software is used.
TableIshows the characteristics of the device.
C. Validation protocol
The validation protocol can be divided into six parts, as shown in Fig.2, namely,共1兲 acquisition of a set of micro-CT images of the full sample,共2兲 metallographic preparation of the sample and digitizing by microscopy, 共3兲 fitting a micro-CT image to the microscopic image, followed by the reconstruction of an interpolated micro-CT image when required,共4兲 registration of the microscopic to the interpo-lated micro-CT image, 共5兲 binarization of the interpolated micro-CT image, and 共6兲 matching the interpolated micro-CT to the microscopic image. In the following, the six steps are elaborated when applied to the selected titanium porous structures.
FIG. 1. 共a兲 A typical cylindrical porous titanium structure with a mean radius of 3.00⫾0.05 mm, a mean height of 10.0⫾0.1 mm, and a global porosity of about 80%, and 共b兲 an optical light microscopy image of a typical cross section of such a sample.
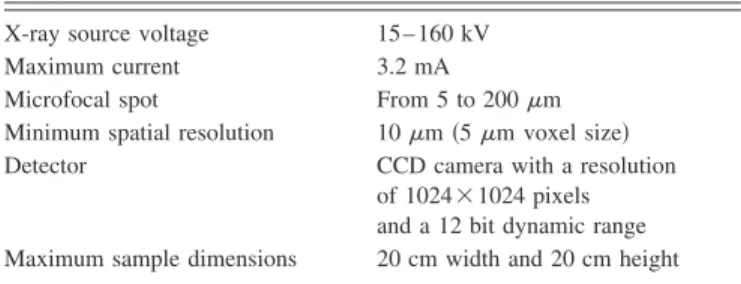
TABLE I. Characteristics of the Philips HOMX 161 x-ray system withAEA TOMOHAWKCT software.
X-ray source voltage 15– 160 kV
Maximum current 3.2 mA
Microfocal spot From 5 to 200m
Minimum spatial resolution 10m共5m voxel size兲
Detector CCD camera with a resolution
of 1024⫻1024 pixels and a 12 bit dynamic range Maximum sample dimensions 20 cm width and 20 cm height
1. Data acquisition by means of micro-CT
The sample is mounted on a sample holder and posi-tioned on the rotation table ensuring that the cylinder axis coincides with the rotation axis of the scanner rotation table. An upgrade of a CT simulator,29 originally developed by De Man et al.,13 is applied as an objective method to select optimal acquisition parameters 共voltage, current, and filter material兲 and, thus, overcoming a trial and error approach. TableIIsummarizes the applied acquisition parameters. The radiographic images are 16-bit tiff files with gray values in the range of 0–65 536, while the reconstructed axial micro-CT images are 8-bit bitmaps with gray values ranging from 0 to 255.
2. Metallographic preparation
After scanning, the sample is embedded in a resin 共Epofix 4004兲 and sectioned in three parts with a Buehler Isomet low speed precision sectioning saw. The created sur-faces are grinded and polished, and digitized using a Leitz Metalloplan optical light microscope resulting in images with a spatial resolution of 3.0m. It should be mentioned that, for example, for materials with a low contrast ratio be-tween material and resin or when a higher resolution is de-sired, scanning electron microscopy共SEM兲 can also be ap-plied. The obtained microscopic images are considered the “exact” architecture and are compared to the micro-CT
im-ages in the same plane as the sections. The resulting micro-scopic images are manually segmented which is straightfor-ward because of the distinct difference in gray levels between the pore space and the material.
3. Image interpolation
Due to the possible difference between the physical cut-ting angle of the metallographic sections and the reconstruc-tion angle of the micro-CT images, a mismatch can already appear between the microscopic and the corresponding micro-CT image. Therefore, the position and inclination of the microscopic image within the micro-CT data set need to be identified to be able to reconstruct an interpolated micro-CT image at the same position under the same angle. This is done inMATLABusing the image processing toolbox. The in-house developed routine asks the user to point out markers in the micro-CT data set which are also present in the microscopic image, for example, certain pores or particu-lar struts. By fitting a least squares fit plane through these markers, an interpolated micro-CT image is reconstructed.
4. Image registration
The microscopic images have a spatial resolution which is about nine times higher than the interpolated micro-CT images. Also, the in-plane orientation of the microscopic im-ages can differ from the one of the interpolated micro-CT images. Hence, a so-called “registration” is performed to match the spatial resolution, to reorient and/or to translate the microscopic images according to the interpolated micro-CT images. Maes et al.,30,31 have developed an auto-matic image registration tool based on mutual information which allows two images to be automatically and user inde-pendently registered. This image registration tool is applied in this study to register the microscopic to the corresponding, interpolated micro-CT images.
FIG. 2. Schematic overview of the validation protocol, consisting of six parts: 共1兲 acquisition of a set of micro-CT images of the full sample, 共2兲 metallographic preparation of the sample and digitizing by microscopy, 共3兲 fitting a micro-CT image to the microscopic image, followed by the reconstruction of an interpolated micro-CT image when required,共4兲 registration of the microscopic to the interpolated micro-CT image, 共5兲 binarization of the interpolated micro-CT image, and 共6兲 matching the microscopic to the interpolated micro-CT image.
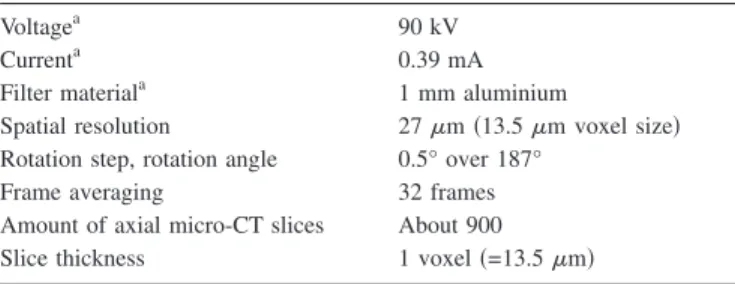
TABLE II. Acquisition parameters for porous titanium structures on a Philips HOMX 161 x-ray system withAEA TOMOHAWKCT software.
Voltagea 90 kV
Currenta 0.39 mA
Filter materiala 1 mm aluminium
Spatial resolution 27m共13.5m voxel size兲 Rotation step, rotation angle 0.5° over 187°
Frame averaging 32 frames
Amount of axial micro-CT slices About 900
Slice thickness 1 voxel共=13.5m兲
5. Image segmentation
Because micro-CT images are gray-level images, the most critical part in the validation protocol is finding the optimal threshold for binarization. As shown in Refs.16and 32–34, the threshold has a significant influence on the image-based structural analysis. The most widely applied threshold techniques use a global threshold. A single threshold value is selected, in this study ranging between 0 and 255, which typically represents the intensity value that optimally distin-guishes the pore from the solid phase. As a result, a binary image is generated. Many thresholding methods and algo-rithms were developed over the years, depending on the ma-terial used, the application, the quality, and/or noise level of the images, etc.32,35–38 Several review articles discuss and evaluate a range of threshold methods.39–42However, they all conclude the same: that finding the optimal threshold is not a trivial issue and that there is no single threshold algorithm that is successful for all possible image variations in the spa-tial domain.
In this study, a novel thresholding method is developed based on matching microscopic with their corresponding, in-terpolated micro-CT images. Microscopic images are 2D en-tities consisting of pixels 共picture elements兲. Micro-CT im-ages, on the other hand, are 3D entities expressed in voxels 共volume elements兲 with a certain thickness. As mentioned in TableII, in this research the thickness of the micro-CT im-ages is kept minimal which results in cubic voxels, thus no averaging is made over the thickness. To prevent confusion, from now on the pixels in the microscopic images and the voxels in the micro-CT images are referred to as “elements.” When overlaying both the microscopic and their corre-sponding, interpolated micro-CT images, the optimum is rep-resented by a maximum in coinciding and a minimum in noncoinciding solid elements. By altering the threshold value for the micro-CT images, this optimum can be approximated. Per set of microscopic and corresponding, interpolated micro-CT image 共=image set兲, the threshold approximating the optimum the closest, named the “best” threshold, is de-termined. By averaging the “best” threshold values over a significant amount of image sets, the “optimal” threshold is defined. This “optimal” threshold is only valid for the se-lected material, micro-CT device and acquisition parameters. If one of these settings changes significantly, a new “opti-mal” threshold needs to be determined.
One of the major advantages of this novel thresholding method is that it accounts for closed pores, in contrast with the Archimedes method.32,43Also, since the physical visual-ization of the structure is taken as a reference, it results in binary images closely representing the real structure. It is a time-consuming procedure, but once the “optimal” threshold is determined for certain settings, it can be used for further research. Still, an important limitation of the method is that it is a global thresholding method and, hence, it does not lo-cally account for the errors present in micro-CT images due to the limited spatial resolution, PVE, etc. However, since this thresholding method is linked to the proposed validation protocol, this error can be quantified.
6. Matching
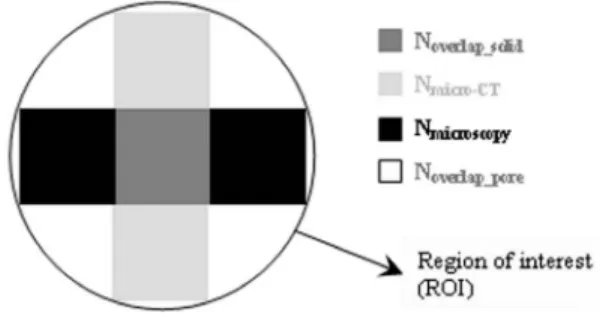
Both the binarized microscopic and corresponding, inter-polated micro-CT images are matched and overlaid, resulting in images displaying the overlapping solid elements in dark gray, the noncoinciding solid elements in the microscopic image in black and the noncoinciding solid elements in the micro-CT image in light gray. The white background repre-sents pore space. Figure3shows a simplification of an over-lay image. The number of elements in each color is counted, yielding the amount of solid elements in the micro-CT image not coinciding with the solid elements in the microscopic image共Nmicro-CT兲, the amount of solid elements in the
micro-scopic image not coinciding with the solid elements in the micro-CT image共Nmicroscopy兲, the amount of coinciding solid
elements 共Noverlap_solid兲, and the amount of coinciding pore
elements 共Noverlap_pore兲. Ntotalrepresents the total amount of
elements present in the ROI. In this case, the ROI is defined as the circle with a radius of 3.00 mm surrounding the ma-terial present in both the microscopic and the corresponding, interpolated micro-CT image.
The following parameters are defined:
• total amount of solid elements present in the micro-CT image共elements兲,
Nmicro-CTtot = Noverlap_solid+ Nmicro-CT; 共1兲
• total amount of solid elements present in the microscopic image共elements兲,
Nmicrocopytot = Noverlap_solid+ Nmicroscopy; 共2兲
• percentage in solid overlap共%兲, Overlapsolid=
冋
Noverlap_solid
Nmicroscopytot
册
· 100; 共3兲• percentage in solid micro-CT mismatch共%兲,
Mmicro-CT_solid=
冋
Nmicro-CT
Nmicroscopytot
册
· 100; 共4兲• percentage in solid microscopic mismatch共%兲,
Mmicroscopy_solid=
冋
Nmicroscopy
Nmicroscopytot
册
· 100; 共5兲FIG. 3. Simplification of an overlay image where the overlapping solid elements are displayed in dark gray, the noncoinciding solid elements in the microscopic image in black and the noncoinciding solid elements in the micro-CT image in light gray. The white background represents pore space. The ROI is in this case defined as the circle with a diameter of 3.00 mm surrounding the material present in the both the microscopic and the corre-sponding, interpolated micro-CT image.
• percentage in total solid mismatch共%兲,
Mtotal_solid= Mmicro-CT_solid+ Mmicroscopy_solid; 共6兲 • percentage in total overlap共%兲,
Overlaptotal=
冋
Noverlap_solid+ Noverlap_pore
Ntotal
册
· 100; 共7兲
• percentage in total micro-CT mismatch共%兲,
Mmicro-CT_total=
冋
Nmicro-CT
Ntotal
册
· 100; 共8兲
• percentage in total microscopic mismatch共%兲,
Mmicroscopy_total=
冋
NmicroscopyNtotal
册
· 100; 共9兲
• percentage in total mismatch共%兲,
Mtotal= Mmicro-CT_total+ Mmicroscopy_total. 共10兲
For the determination of the “optimal” threshold, only the solid elements in both the microscopic and the micro-CT images are considered for matching since artifacts like beam hardening and the PVE reflect only on the solid elements
共when biphasic images are assessed兲. The solid elements in the microscopic image are taken as reference 关Eq. 共3兲–共6兲兴. However, since image-based structural analysis is performed on the total image containing solid and pore elements, the total overlap and mismatch are determined inside the ROI taking into account the pore elements. The total amount of elements inside the ROI is then taken as reference 关Eq.共7兲–共10兲兴.
III. RESULTS
In total 36 interpolated micro-CT images are matched to their corresponding microscopic images. Figure4 shows an example of共a兲 a microscopic image of a metallographic sec-tion, 共b兲 the corresponding, interpolated micro-CT image, and共c兲 the resulting match of both.
A. Statistical analysis
All results are expressed as mean⫾standard deviation. The normality of the variables is assessed using the Kolmogorov–Smirnov test. Values smaller than 1.5 times the interquartile range共IQR兲 and larger than three times the IQR are defined as outliers and are, in this study, excluded for assessing the mean⫾standard deviation. The IQR computes the difference between the 75th and the 25th percentiles of variable. The IQR is a robust estimate of the spread of the data, since changes in the upper and lower 25% of the data do not affect it. The correlation between two variables is assessed using the Pearson’s correlation test. Statistical analysis is done using a statistical software add-in for
MICROSOFT® EXCEL® for Windows, namely, ANALYSE-IT
version 1.73.
B. “Optimal” threshold
As mentioned before, the “best” threshold is defined where the solid overlap minus total solid mismatch reaches its maximum. Figure5共a兲indicates for one particular image set that the total solid mismatch reaches a minimum at a certain threshold value, in this study defined as the “refer-ence” threshold. Since the solid overlap always decreases with increasing threshold 关Fig. 5共a兲兴, only a decrease with
FIG. 4. For a particular titanium porous sample共⌽ 6 mm兲: 共a兲 the micro-scopic image of a metallographic slice,共b兲 the corresponding, interpolated micro-CT image, and共c兲 the resulting match of both.
FIG. 5. 共A兲 Definition of the “refer-ence” threshold for one particular image set. Only a decrease in thresh-old with respect to the “reference” threshold is concerned for the deter-mination of the “best” threshold.共B兲 Influence of the threshold on the solid overlap, solid microscopic, solid micro-CT and total solid mis-match, the solid overlap minus total solid mismatch, and determination of the ‘best’ threshold for one particular image set with respect to the “refer-ence” threshold.
respect to the “reference” threshold is considered for deter-mining the “best” threshold per image set. When assessing the 36 image sets, a mean “reference” threshold of 127⫾6 is found. The values are normally distributed.
Figure5共b兲shows for one particular image set the influ-ence of the threshold on the solid overlap, solid micro-CT mismatch, solid microscopic mismatch, and total solid mis-match. Where the difference between the solid overlap and the total solid mismatch reaches its maximum, meaning a maximum in coinciding and a minimum in noncoinciding solid elements, the “best” threshold is defined being 115 for this particular set. Per image set, the “best” threshold is de-termined. The 36 “best” threshold values are normally dis-tributed and result in a mean “best” threshold value of 111⫾6, named the ‘optimal’ threshold.
C. Match for the “optimal” threshold
The “optimal” threshold is then applied on all 36 image sets for binarization. The mean percentage in solid overlap, solid micro-CT mismatch, solid microscopic mismatch, and total solid mismatch are determined based on Eq.共3兲–共6兲and are summarized in TableIII. The mentioned variables are all normally distributed.
To get an overall view of the error made by micro-CT and binarization, all elements共solid and pore兲 are accounted for. Again, the “optimal” threshold value is applied to bina-rize the 36 interpolated micro-CT images. For all 36 image sets the total overlap, total CT mismatch, total micro-scopic mismatch, and total mismatch are determined accord-ing to Eq.共7兲–共10兲 and the results are summarized in Table IV. The mentioned variables are all normally distributed.
D. Influence of the interpolation step
As mentioned before, the difference between the physi-cal cutting angle of the metallographic sections and the re-construction angle of the corresponding micro-CT images introduces a certain mismatch. The current study diminishes this mismatch by providing a tool to interpolate a micro-CT image under the same angle as the physical cutting angle. To prove the importance of the interpolation step, the proposed protocol is as well performed on not interpolated micro-CT images. Therefore, the micro-CT images resembling the mi-croscopic sections the best are considered for matching.
In total, 18 image sets are assessed for both the interpo-lated and the not interpointerpo-lated micro-CT images. A “refer-ence” threshold of 129⫾7 and 135⫾15, respectively, and an “optimal” threshold of 113⫾6 and 113⫾5, respectively, are found. The resultant total overlap, total CT and micro-scopic mismatch, and total mismatch are summarized in TableV. It can be seen that, although for both the
interpo-lated and not interpointerpo-lated micro-CT images the “optimal” threshold remains the same, a larger mismatch is found when no interpolation is performed. Since the interpolation related mismatch depends on the difference between the cutting and the reconstruction angle and since this difference varies be-tween the image sets, more outliers are excluded when no interpolation is performed and the resultant standard devia-tion still remains larger.
E. Image analysis—solid fraction
The fraction of the solid present in both the microscopic and the corresponding, interpolated micro-CT images is de-termined by dividing the amount of solid elements by the total amount of elements共solid and pore兲 in the ROI. The 36 interpolated micro-CT images are binarized using the “opti-mal” threshold. On average, the absolute difference in solid fraction between micro-CT and microscopy is共4.7⫾1.9兲%. The positive value indicates that micro-CT, when applying the “optimal” threshold for binarization, overestimates the real solid structure by about 5%.
Figure 6 shows the correlation between the fraction of the solid calculated from the micro-CT images and from the microscopic images共p⬍0.001, Pearson’s correlation—t ap-proximation兲. Pearson’s correlation between both shows an r statistic of 0.93. Again, it can be seen that the real solid fraction is overestimated by about 5% absolute in the bina-rized micro-CT images.
F. Image analysis—strut thickness
Quantification of the PVE for a heterogeneous porous structure with a broad range in strut and pore size is not straightforward and is not the subject of this research. How-ever, to get a global idea of the influence of the PVE in function of the threshold and, additionally, to globally quan-tify the PVE for the determined “optimal” threshold, a study of the average strut thickness in function of the threshold with reference to the real structure共represented by the mi-croscopic image兲 is performed. Figure7 sketches this study. It can be seen that, depending on the chosen threshold, the structure edge shifts towards or away from the real structure. The 36 interpolated micro-CT images are binarized start-ing from the “reference threshold,” namely, 127, and with decreasing threshold values in steps of 2. Both for the mi-croscopic and the interpolated micro-CT images, the average strut thickness is calculated. Then, since the microscopic im-age is taken as the reference, the averim-age strut thickness de-termined for the microscopic images is subtracted from the one of the interpolated micro-CT images and divided by 2 to quantify the PVE. In Fig.7, this is can be seen as
TABLE III. Mean percentage in solid overlap, solid micro-CT mismatch, solid microscopic mismatch, and total solid mismatch.
Overlapsolid 共83.4⫾4.5兲%
Mmicro-CT_solid 共44.2⫾9.9兲%
Mmicroscopy_solid 共16.6⫾4.5兲%
Mtotal_solid 共61.0⫾8.3兲%
TABLE IV. Mean percentage in total overlap, total micro-CT mismatch, total microscopic mismatch, and total mismatch.
Overlaptotal 共89.1⫾1.4兲%
Mmicro-CT_total 共7.8⫾1.5兲%
Mmicroscopy_total 共2.8⫾0.7兲%
Mtotal 共10.9⫾1.4兲%
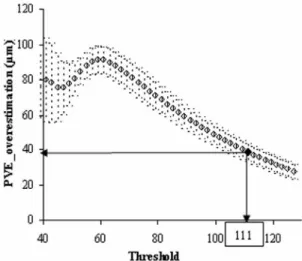
PVE _ overestimation =b共or c兲 − a 2
Figure8shows the results. The overestimation due to the PVE in function of the threshold is quasilinear up to about 60 where it reaches its maximum. When the threshold is further diminished, a minimum is reached at about 47 to increase again with decreasing threshold. The drop in the function is mainly due to the background noise in the micro-CT images which is accounted for in the analysis starting from threshold value 60 and lower. When the “optimal” threshold is applied, namely, 111, an average overestimation due to the PVE of 38.8m is found which equals to about 3 voxels. It has to be pointed out that this is only an average value. The PVE will be larger for thin struts and small pores and smaller for fea-tures significantly larger than the spatial resolution.
IV. DISCUSSION
When using microscopy for characterizing porous struc-tures, one is limited by its 2D character and a critical, time-consuming sample preparation. Therefore, micro-CT is put forward as the solution for 3D characterization of porous structures. However, to ensure and quantify the reliability and the accuracy of the micro-CT images, a validation pro-tocol is developed by matching micro-CT tomograms to mi-croscopic images. Microscopy is chosen as the “golden
stan-dard” because of its physical character, its well-known procedure, and its better resolution with respect to standard micro-CT. When high resolution micro-CT or nano-CT 共stan-dard or synchrotron兲 images are validated, SEM images can be applied to guarantee a superior resolution with respect to the CT images. The main advantages of the proposed valida-tion protocol are, first, the opportunity to interpolate a micro-CT image under the same angle as the physical cutting angle of the microscopic sections; second, the novel thresh-olding method; and, third, the more precise and detailed quantification of the visualization and binarization error present in the micro-CT images.
In this study, as a proof of principle, the validation pro-tocol is applied to porous titanium structures. When scanning the samples on a Philips HOMX 161 x-ray system withAEA TOMOHAWK CT software applying the scanning parameters mentioned in Table II and binarizing the micro-CT images with the determined “optimal” threshold, a total overlap of about 89% and a total mismatch of about 11% are found. The total mismatch consists of about 8% total micro-CT mis-match and about 3% total microscopic mismis-match. Thus, it is concluded that micro-CT visualizes about 89% of the solid and pore phase correctly. However, the images overestimate the structure by about 8%. Additionally, they do not visualize about 3% of the real structure. Possible reasons for both the overestimation and the inability to visualize some features are elaborated below.
It has to be mentioned that, if only the solid fraction
TABLE V. Mean percentage in total overlap, total micro-CT mismatch, total microscopic mismatch, and total mismatch for 18 image sets with and with-out interpolation of the micro-CT images.
With interpolation Without interpolation Overlaptotal 共88.5⫾2.0兲% 共85.2⫾4.3兲% Mmicro-CT_total 共7.9⫾1.5兲% 共10.0⫾3.7兲% Mmicroscopy_total 共2.8⫾0.8兲% 共4.8⫾1.8兲% Mtotal 共11.5⫾2.0兲% 共14.8⫾4.3兲%
FIG. 6. Correlation between the solid fraction calculated from the micro-scopic images and the solid fraction calculated from the micro-CT images 共p⬍0.001, Pearson’s correlation—t approximation, r statistic=0.93兲.
FIG. 7. Influence of the threshold value for the micro-CT images on the overestimation of the strut thickness. This phenomenon is applied for the global quantification of the PVE.
FIG. 8. Overestimation of the average strut thickness divided by 2 共PVE_o-verestimation兲 in function of the threshold. The “optimal” threshold corre-sponds to a PVE_overestimation of 38.8m共about 3 voxels兲.
would be considered for validating micro-CT, one would conclude that micro-CT only overestimates the structure by about 5%.
A. Partial volume effect related error
The PVE is implicitly present in micro-CT images. It causes gray values共intensities in the images兲 to differ from what they ideally should be. For example, micropores in the range of the attainable resolution should ideally be repre-sented by voxels with a gray value of 0, which is not the case due to the PVE. Factors affecting this phenomenon are as follows: 共i兲 the limited spatial resolution, 共ii兲 the size and shape of the struts/pores, and 共iii兲 the image sampling or thickness of the slices. Thus, as will be stated in the next section, the lower the resolution, the more blurring and less sharp the material edges and, hence, the lower the image quality will be. Also, when the features are in the range of the spatial resolution or if the shape is complex, the influence of the PVE is larger共also see Sec. IV D兲. When the thickness of the micro-CT slices exceeds one cubic voxel, the PVE also plays a role in the third dimension 共z direction兲. To minimize this effect in the current work, the thickness of the micro-CT slices is kept minimal共1 cubic voxel兲.
B. Resolution related error
The resolution of the micro-CT images is limited not only by the device used, but also by the dimensions of the sample. It is known that, to reduce artifacts and noise, the complete sample width should be in the field of view while scanning. Hence, the resolution of the resulting images is restricted. When the resolution exceeds the dimensions of, for example, micropores or very thin struts, they are not vi-sualized correctly by micro-CT, leading to filling of the mi-cropores and/or a reduction of connecting struts. This gives rise to both an overestimation of the structure and the lack of visualizing small features. Also, since the PVE increases with decreasing resolution, image accuracy goes down.
C. Acquisition and material related error
Due to the high attenuating character of metals, artifacts such as beam hardening, streaks, noise, and PVE are quite pronounced in their micro-CT images. To partially tackle or suppress these artifacts, optimal acquisition parameters are in this study determined by using a micro-CT simulator. How-ever, since not all artifacts can be removed, a mismatch be-tween the micro-CT and the microscopic images exists. Thus, when the material under investigation is known to cause pronounced artifacts or, in addition, when wrong or nonoptimal acquisition parameters are used, a significant mismatch can be expected.
D. Structure related error
The more complex the structure and the broader the range in dimensions of the structural features, the larger the mismatch will get. Indeed, as mentioned before, the closer the feature dimensions approach the attainable spatial reso-lution, the larger the influence of the PVE and, hence, the larger the mismatch.
E. Interpolation related error
As stated in the Introduction, when histology is used to validate micro-CT and when the physical cutting angle of the microscopic sections does not coincide with the reconstruc-tion angle of the micro-CT images, no interpolareconstruc-tion is made. As indicated in literature and proven in this study, this can give rise to an induced mismatch. Also, since the difference between the cutting and the reconstruction angle of the mi-croscopic and the micro-CT images, respectively, is not equal for all image sets, a larger scatter on the results is expected. In the proposed validation protocol, this problem is tackled by providing an interpolation tool to reconstruct an interpolated micro-CT image under the same angle as the physical cutting angle. However, one might think that a small mismatch could be introduced by the interpolation process itself. Therefore, to prove the accuracy and reliability of the interpolation tool, repeated interpolation of one micro-CT image was carried out by different users. For each repetition, the solid overlap and the solid microscopic and micro-CT mismatch were calculated, resulting in a standard deviation of 0.4% for all variables. Additionally, a standard deviation of 0.1% on the absolute difference in surface fraction be-tween the microscopic and the micro-CT image was found. Thus, the interpolation tool is proven to be user independent, objective, and accurate.
F. Threshold related error
The influence of the threshold on the solid overlap, the total solid mismatch, and the absolute difference in solid fraction between the micro-CT and microscopic images is proven to be significant and has to be accounted for.
By the authors’ knowledge, currently only one study re-ports the comparison of the spatial distribution of the solid between microscopic sections and their micro-CT homologs by matching both images instead of comparing structural pa-rameters. Stoppie et al.23found an overall matching of 89% between micro-CT slices and histological sections of bone around screw-type titanium implants. However, it has to be mentioned that the overall matching was determined on the solid elements only and that the remaining noncoinciding solid elements in the micro-CT images were determined dif-ferently compared to this study. When applying the same approach as Stoppie et al., this study results an overall matching of about 83% and a percentage of remaining non-coinciding solid elements in the micro-CT images of about 35%, while Stoppie et al. found about 89% and 29%, respec-tively.
An interstudy comparison can be made since Stoppie
et al. used the same micro-CT device, applied similar
acqui-sition parameters, had micro-CT images with a similar spa-tial resolution, and used the same reconstruction algorithms. Also, they analyzed titanium samples. However, those samples, which were surrounded by bone, were of much less complexity. The samples assessed in this study have a much broader range in structural feature dimensions. Hence, as mentioned before, the more complex the structure and the more structural features with dimensions in the range of the spatial resolution, the larger the mismatch between micro-CT
and microscopy. Thus, the results of both studies can be compared taking into account the difference in morphologi-cal sample complexity.
V. CONCLUSIONS
For cancellous bonelike structures, literature has already confirmed the ability of micro-CT to image the 3D architec-ture correctly, and the visualization error inherently present in the micro-CT images is quantified. However, when other porous structures are assessed, literature could not yet pro-vide quantitative data concerning the accuracy and reliability of the micro-CT images. Therefore, in this study, a validation protocol is developed which can be applied to porous mate-rials in general. It compares CT tomograms to micro-scopic images by matching them and renders parameters to quantify the error made when applying the micro-CT images for further analysis. One of the innovations of the protocol is the opportunity to reconstruct an interpolated micro-CT im-age under the same angle as the physical cutting angle of the microscopic sections. Also, a novel thresholding method is developed where the optimal threshold is determined at the maximum in coinciding and the minimum in noncoinciding solid elements when overlaying micro-CT and microscopic images.
As proof of principle, the validation protocol is applied to porous titanium structures, scanned on a Philips HOMX 161 x-ray system withAEA TOMOHAWKCT software with a spatial resolution of 27m. It is concluded that, despite the morphological complexity of the titanium samples and the variety in structural feature dimensions, a good match is found between microscopy and micro-CT. Additionally, the mismatch is quantified in a detailed manner providing the percentage of overestimation and the percentage of the struc-ture not visualized by micro-CT. It is shown that metal po-rous structures can be analyzed with sufficient accuracy by means of standard micro-CT. However, due to, for example, the limited spatial resolution and the high attenuating char-acter of the metallic samples, a significant mismatch is found which needs to be accounted for when performing image-based structural analysis.
ACKNOWLEDGMENTS
This work is done in collaboration with the Guided Bone Engineering project 共www.tissue-engineering.be兲, an inter-disciplinary research project funded by IWT-Flanders under the programme for strategic basic research共GBOU-020181兲. The research is funded by the Flemish Government through the Research Council of K. U. Leuven共OT-3E040097兲. The authors wish to thank VITO 共Mol, Belgium兲 for supplying the materials.
1A. H. Benouali, L. Froyen, J. F. Delerue, and M. Wevers, Med. Imaging
Technol. 18, 489共2002兲.
2R. C. Atwood, J. R. Jones, P. D. Lee, and L. L. Hench, Scr. Mater. 51,
1029共2004兲.
3S. V. N. Jaecques, H. Van Oosterwyck, L. Muraru, T. Van Cleynenbreugel,
E. De Smet, M. Wevers, I. Naert, and J. Vander Sloten, Biomaterials 25, 1683共2004兲.
4A. C. Jones, B. Milthorpe, H. Averdunk, A. Limaye, T. J. Senden, A.
Sakellariou, A. P. Sheppard, R. M. Sok, M. A. Knackstedt, A. Brandwood, D. Rohner, and D. W. Hutmacher, Biomaterials 25, 4947共2004兲.
5R. A. Ketcham and W. D. Carlson, Comput. Geosci. 27, 381共2001兲. 6K. S. Lim and M. Barigou, Food Res. Int. 37, 1001共2004兲.
7H. B. Shen, S. Nutt, and D. Hull, Compos. Sci. Technol. 64, 2113共2004兲. 8L. Salvo, P. Cloetens, E. Maire, S. Zabler, J. J. Blandin, J. Y. Buffiere, W.
Ludwig, E. Boller, D. Bellet, and C. Josserond, Nucl. Instrum. Methods Phys. Res. B 200, 273共2003兲.
9G. R. Davis and J. C. Elliott, Mater. Sci. Technol. 22, 1011共2006兲. 10S. T. Ho and D. W. Hutmacher, Biomaterials 27, 1362共2006兲.
11V. Cnudde, B. Masschaele, M. Dierick, J. Vlassenbroeck, L. Van
Hoorebeke, and P. Jacobs, Appl. Geochem. 21, 826共2006兲.
12R. Muller, T. Hildebrand, H. J. Hauselman, and P. Ruesegger, Technol.
Health Care 4, 113共1996兲.
13B. De Man, J. Nuyts, P. Dupont, G. Marchal, and P. Suetens, IEEE Trans.
Nucl. Sci. 46, 691共1999兲.
14B. De Man, J. Nuyts, P. Dupont, G. Marchal, and P. Suetens, IEEE Trans.
Nucl. Sci. 47, 977共2000兲.
15J. L. Kuhn, S. A. Goldstein, L. A. Feldkamp, R. W. Goulet, and G. Jesion,
J. Orthop. Res. 8, 833共1990兲.
16R. J. Fajardo, T. M. Ryan, and J. Kappelman, Am. J. Phys. Anthropol. 118,
1共2002兲.
17R. Muller, M. Hahn, M. Vogel, G. Delling, and P. Ruegsegger, Bone
共N.Y.兲 18, 215 共1996兲.
18R. Muller, H. Van Campenhout, B. Van Damme, G. Van Der Perre, J.
Dequeker, T. Hildebrand, and P. Ruegsegger, Bone共N.Y.兲 23, 59 共1998兲.
19J. A. Stadler, W. Cortes, L. L. Zhang, C. C. Hanger, and A. K. Gosain,
Plast. Reconstr. Surg. 118, 626共2006兲.
20J. S. Thomsen, A. Laib, B. Koller, S. Prohaska, L. Mosekilde, and W.
Gowin, J. Microsc. 218, 171共2005兲.
21T. Uchiyama, T. Tanizawa, H. Muramatsu, N. Endo, H. E. Takahashi, and
T. Hara, Calcif. Tissue Int. 61, 493共1997兲.
22D. Chappard, N. Retailleau-Gaborit, E. Legrand, M. F. Basle, and M.
Audran, J. Bone Miner. Res. 20, 1177共2005兲.
23N. Stoppie, J. P. van der Waerden, J. A. Jansen, J. Duyck, M. Wevers, and
I. E. Naert, Clinical Implant Dentistry and Related Research 7共2兲, 87 共2005兲.
24F. Snijkers, S. Mullens, J. Luyten, W. Vandessel, S. Impens, J. Schrooten,
and J. Van Humbeeck, Proceedings of the Acers Meeting, Cocoa Beach, Florida, USA, January 2005共unpublished兲.
25S. Impens, S. Mullens, J. Luyten, I. Thijs, J. Van Humbeeck, T. Van
Cleynenbreugel, A. Bakker, F. P. Luyten, and J. Schrooten, Proceedings of the 19th European Conference on Biomaterials, Sorrento, Italy, 11–15 September 2005共unpublished兲.
26L. A. Feldkamp, L. C. Davis, and J. W. Kress, J. Opt. Soc. Am. A 1, 612
共1984兲.
27A. Y. Sasov, J. Microsc. 147, 179共1987兲. 28A. Y. Sasov, J. Microsc. 147, 169共1987兲.
29P. Van Marcke and R. Swennen, Proceedings of the second International
Workshop on the Application of X-ray CT for Geomaterials共GeoX 2006兲, Aussois, France, 4–7 October 2006共unpublished兲.
30F. Maes, A. Collignon, D. Vandermeulen, G. Marchal, and P. Suetens,
IEEE Trans. Med. Imaging 16, 187共1997兲.
31F. Maes, D. Vandermeulen, and P. Suetens, Proc. IEEE 91, 1699共2003兲. 32M. Ding, A. Odgaard, and I. Hvid, J. Biomech. 32, 323共1999兲. 33T. Hara, E. Tanck, J. Homminga, and R. Huiskes, Bone 共N.Y.兲 31, 107
共2002兲.
34D. Mitton, E. Cendre, J. P. Roux, M. E. Arlot, G. Peix, C. Rumelhart, D.
Babot, and P. J. Meunier, Bone共N.Y.兲 22, 651 共1998兲.
35W. Oh and W. B. Lindquist, IEEE Trans. Pattern Anal. Mach. Intell. 21,
590共1999兲.
36N. Otsu, IEEE Trans. Syst. Man Cybern. 9, 62共1979兲.
37J. H. Waarsing, J. S. Day, and H. Weinans, J. Bone Miner. Res. 19, 1640
共2004兲.
38A. P. Sheppard, R. M. Sok, and H. Averdunk, Physica A 339, 145共2004兲. 39J. S. Weszka, Comput. Vis. Graph. Image Process. 7共2兲, 259 共1978兲. 40M. Sezgin and B. Sankur, J. Electron. Imaging 13, 146共2004兲. 41N. R. Pal and S. K. Pal, Pattern Recogn. 26, 1277共1993兲.
42S. Rajagopalan, L. C. Lu, M. J. Yaszemski, and R. A. Robb, J. Biomed.
Mater. Res. 75, 877共2005兲.
43M. Ding, M. Dalstra, C. C. Danielsen, J. Kabel, I. Hvid, and F. Linde, J.