Wheat yield estimates at NUTS-3 level using MODIS data: an
approach based on the decreasing curves of green area index
temporal profiles
L. Kouadio1, G. Duveiller2, B. Djaby1, P. Defourny2 and B. Tychon1 1
Department of Environmental Sciences and Management, Université de Liège, Arlon, Belgium.
Email: [email protected].
2
Earth and Life Institute, Université catholique de Louvain, Louvain-la-Neuve, Belgium.
Abstract
Wheat is the most widely-grown food crop in the world and the most important cereal crop traded on international markets. An early prediction of its yield prior to harvest at regional, national and international scales can play a crucial role in global markets, policy and decision making. Many models for yield forecasting are available with varying levels of complexity and empiricism. The use of remote sensing technology for monitoring crop condition and predicting crop yields at regional scales have been studied extensively during these last decades. Earth observation data, owing to their synoptic, timely and repetitive coverage, have been recognized as a valuable tool for yield and production forecasting.
At field level, studies on crop breeding showed that a close correlation exists between green leaf area (GAI) during maturation and grain yield in wheat. Thus, the onset and rate of senescence appeared as important factors for determining grain yield of this crop. The aim of this research is to explore a simplified approach for wheat yield forecasting at the European NUTS-3 administrative level, based on metrics derived from the senescence phase of GAI estimated from remote sensing data. This study takes advantage of considerable recent methodological improvements in which imagery with coarse/medium spatial resolution but high revisit frequency is exploited to derive crop specific GAI time series by selecting pixels whose ground-projected instantaneous field of view is constituted by a high cover fraction of winter wheat.
This approach is testing on one crop growing season over a 300 by 300 km study site comprising Belgium and northern France within the framework of the GLOBAM (GLOBal Agricultural Monitoring systems by integration of earth observation and modelling techniques) project. The validation of such an approach will involve the comparison with official wheat yield data at NUTS-3 level.
Keywords: Yield estimates; NUTS-3 level; Green Area Index; Senescence; Wheat
1 Introduction
Over the last decade, studies on crop breeding, especially winter wheat (Triticum aestivum L), showed that there is a close relation between leaf area during maturation and grain yield in wheat (Gooding et al., 2000; Reynolds et al., 2000 ; Richards, 2000 ; Dimmock et al., 2002 ; Blandino et al., 2009). Some of them also revealed that fungicides have been associated with yield increases due to the maintenance of the photosynthetic life of the canopy during grain filling. The onset and rate of senescence are important factors for determining grain yield in winter wheat. The basic assumption underlying these studies is that flag leaf photosynthesis in wheat contributes to about 30–50% of the assimilates for grain filling (Sylvester-Bradley et al., 1990). Due to the fact that only flag leaves are considered, these studies might be difficult
to implement in a large-scale monitoring framework. Indeed, very few studies directly link parameters quantifying the decrease in green leaf area to final winter wheat yield.
Several methods of direct and indirect leaf area (LAI) measurements have been developed (Gower et al., 1999 ; Jonckheere et al., 2004 ; Weiss et al., 2004). For the types of vegetation cover in which it is often difficult to separate leaves and other organs below due to plant architecture, the concepts of Plant Area Index (PAI) (Neumann et al., 1989 ; Bréda, 2003 ; Hosoi et al., 2009) or Green Area Index (GAI) (Olesen et al., 2002) are used.
Satellite remote sensing can supply observations over large spatial extents with a regular revisit frequency. High observation frequency (e.g every 1-7 days) is necessary for crop growth monitoring, especially when anomalies due to climatic variability are to be detected. However, several agricultural landscapes require spatial resolution to be finer than that offered by current Earth observation instruments with the adequate revisit frequency and swarth (Duveiller and Defourny, 2010). To overcome the problems of coarser spatial resolution and area heterogeneity, data from medium spatial resolution sensors such as the Moderate Resolution Imaging Spectroradiometer (MODIS) can be used so long as the adequacy between target and observation support is assured (Duveiller et al., 2009). Information concerning the location of the target crop must therefore be known in order to identify which MODIS pixels can be considered crop specific.
An early prediction of wheat yield prior to harvest at regional, national or international scales can play a crucial role in global markets, policy and decision making. Many models for yield forecasting are available with varying levels of complexity and empiricism (Supit, 2000; Duchemin et al., 2008; Becker-Reshef et al., 2010). The aim of this research is to explore a simplified approach for wheat yield forecasting at the European NUTS-3 administrative level, based on metrics derived from the senescence phase of green area index (GAI) retrieved from remote sensing data.
2 Methodology
2.1 GAI retrieval from MODIS time series
The method for extracting wheat specific GAI time series from MODIS daily reflectance is detailed in Duveiller et al. (2009). This approach consists in first assuring the adequacy between the MODIS 250m grid and the wheat fields over the study area. To do so, a kernel modelling the MODIS spatial response is convolved over a fine spatial resolution (30m) winter wheat crop mask realized in the framework of the GLOBAM project. The result is a pixel purity map, relating the pixel-target adequacy between MODIS pixels and surfaces covered by winter wheat, that is used to select the pixels whose ground-projected instantaneous field of view is covered by winter wheat by at least 80%.
Once daily NIR and RED reflectance time series are isolated, GAI is derived from them using the algorithm developed for the CYCLOPES products (Baret et al., 2007). This algorithm is based on the inversion of the PROSAIL radiative transfer model using a neural network approach. PROSAIL is a combination of the SAIL canopy model developed by Verhoef (1984) and the PROSPECT leaf model developed by Jacquemoud and Baret (1990). The use of a radiative transfer model helps the methodology to be applicable in different agro-ecological contexts. Indeed, the biophysical variable retrieval is based on physics rather than locally adjusted empirical relationships. Using a neural network to achieve the inversion procedure helps rendering the approach computationally efficient. Both these characteristics are interesting in an operational monitoring perspective.
2.2 Decreasing curves of GAI profiles
The method presented here is tested on winter wheat (Triticum aestivum L) for a single crop season in the year 2009 over a 300 by 300 km study site comprising Belgium and northern France. A preliminary analysis of several GAI profiles showed some noise on them. In order to correct these noises, filters corresponding to criteria listed herein are used:
Number of observations (> 10 over the crop growth)
Pre-season GAI (< 1.5) and Post-harvest GAI (<1.0)
Maximum GAI in accordance to the day of year of maximum value of CSDM (Canopy Structural Dynamic Model) fit, Day of year of the maximum GAI (> 135)
RRMSE (relative root mean square error) between CSDM fit and observations (temporal consistency)
The CSDM is a simple semi-mechanistic model which describes the combined effect of growth and senescence with respect to thermal time by means of a mathematical expression. The CSDM used to interpolate GAI in time was developed by Baret (1986) and improved by Lauvernet (2005).
After applying these filters, 'pure' pixels are globally distributed on 10 NUTS2 in Belgium and 6 NUTS3 in Northern France (Fig.1). Note that Nomenclature of Territorial Units for Statistics (NUTS) are administrative units within the European Union for which agricultural statistics are collected. NUTS3 is the finest spatial level at which agricultural statistics are available that allows the investigation of yield variability across a broad geographical range. Due to the size of NUTS at country level, for countries such as Belgium NUTS2 scale is preferred.
Figure 1: Spatial 'Pure' pixels distribution on Northern European site A. Before applying filters. B: After applying filters
2.3 Climatic variables
Meteorological input for the thermal time calculation is based on grid which dimensions are 10 x 10km. The methodology for data interpolation is the same used in CGMS (Crop Growth Monitoring System) (Supit, 2000). Weather data from weather stations are obtained from the Belgium CGMS system for the Belgian territory and from the European CGMS outside Belgium.
2.4 Curves fitting
In our study, GAI curves are fitted using two functions proposed by Gooding et al. (2000): modified Gompertz model (Eq. 1) and Logistic model (Eq. 2).
(1) (2) Where G = GAI, A= initial percentage of GAI, m = position of the inflexion point in the decreasing part of the GAI curve, k = relative senescence rate, and t = time.
When A is fixed at 100 (GAI maximum value), the inflexion point appears when G = 37% in the case of modified Gompertz model (resp. 50% for the logistic model). The time step considered is the thermal time expressed in growing degree-days. In this analysis time period begins at the date where GAI equal to GAImax. Thermal time at this date is set to 0, and then cumulated for the next days. Thermal time for each 'pure' pixel is calculated with data from grid in which it falls in. Quality of curve fitting is measured by the variance accounted for (VAF): VAF (%) = 100*(1-(residual mean square/total mean square)).
2.5 Yield estimate modelling
The determination of models is done referring to the curve-fitting function used (modified Gompertz or logistic). Models are calculated by multi-linear regression. Inputs are the derived metrics (m and k), GAImax and official statistical yield data. Models then selected for validation are those having at least two variables (variables are not correlated). Official statistical yield data concerned NUTS3 level for France and NUTS2 level for Belgium.
Aggregation at NUTS level is done by taking the mean value of parameter for each NUTS. Regarding to the VAF obtained after fitting, a threshold is taking account to aggregate data. Statistical treatments for curve-fitting and modelling (regression and bootstrap) are carried out respectively with Proc NLIN and Proc GENMOD procedures of SAS® software.
3 Results
3.1 GAI decreasing curves fitting
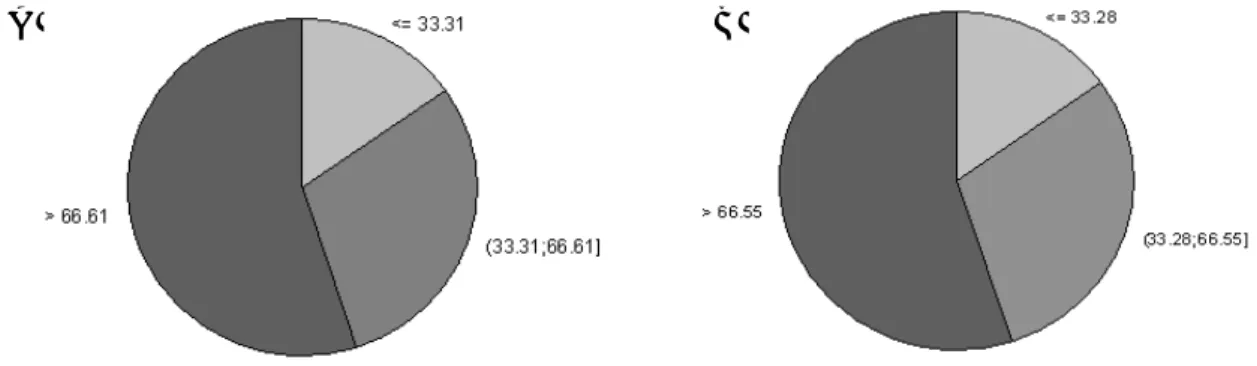
The VAF obtained after curve fitting differ from one point to another. In general, VAF are more than 70% both in the two cases (Fig. 2). For modeling, a threshold of 70% is taking into account to value the quality of adjustments and avoid influence of bad values on the quality of results.
Figure 2: VAF (%) classes obtained after curve fitting A : by modified Gompertz function ; B : by Logistic function
3.2 Regression-based models
Correlations analyses between independent variables for models showed that metrics Mgomp and Kgomp (modified Gompertz function), respectively Mlog and Klog (logistic function) are correlated. Four models are then deduced to perform next analyses. There are : Mod1 : Yield= fct(Mgomp, GAImax) ; Mod2 : Yield= fct(Kgomp, GAImax) ; Mod3 : Yield= fct(Mlog, GAImax) and Mod4 : Yield= fct(Klog, GAImax).
Table 1 and 2 reveal that models involving either Mgomp or Mlog and GAImax as explanatory variables, give best estimators for wheat yield (small value of the intercept, good RMSE and adjusted r²).
Table 1: Characteristics of selected models
Adj R² RMSE Mean_residuals
SD of residuals Lower 95% CL for Mean_residuals Upper 95% CL for Mean_residuals Mod1 0.67 0.29 0.26 0.24 0.25 0.26 Mod2 0.44 0.33 0.33 0.34 0.32 0.34 Mod3 0.70 0.29 0.24 0.24 0.23 0.24 Mod4 0.54 0.32 0.31 0.28 0.3 0.32 A B
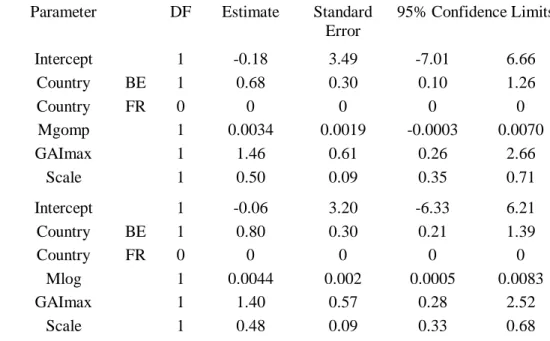
Table 2: Analysis of maximum likelihood parameter estimates
Parameter DF Estimate Standard
Error 95% Confidence Limits Mod1 Intercept 1 -0.18 3.49 -7.01 6.66 Country BE 1 0.68 0.30 0.10 1.26 Country FR 0 0 0 0 0 Mgomp 1 0.0034 0.0019 -0.0003 0.0070 GAImax 1 1.46 0.61 0.26 2.66 Scale 1 0.50 0.09 0.35 0.71 Mod 3 Intercept 1 -0.06 3.20 -6.33 6.21 Country BE 1 0.80 0.30 0.21 1.39 Country FR 0 0 0 0 0 Mlog 1 0.0044 0.002 0.0005 0.0083 GAImax 1 1.40 0.57 0.28 2.52 Scale 1 0.48 0.09 0.33 0.68
Regression-based models are performed, taking into account Country effect. Based on the least squares means analysis (not shown in this paper), good significances of estimation are obtained. Through this kind of analysis, wheat yield can be estimated easily.
4 Discussions
Studies on crop growth monitoring by remote sensing showed that a logistic model based on a simple combination of three parameters for the leaf senescence modelling can be used (Baret et al., 1986). This study shows that the decrease part of GAI can be adequately described by modified Gompertz or logistic function used for flag leaves. Based on the conclusion of the study of Gooding et al. (2000) and extending this approach to a large scale, results presented here show that final yield could be estimated from the GAImax and the inflexion point in the decrease part of the GAI. This conclusion is partly that of Baret et al. (1986) that wheat production could be estimated from the senescence rate and other parameters.
The main objective of this study was to develop a regression-based model that was transferable and directly applicable at other regional and national levels. Our study suggest the possibility of obtaining good levels of precision in terms of wheat yield estimates based on the GAI decreasing curve.
Extending this approach, future studies to assess the degree of precision which can be achieved, compared to other existing operational systems. Wheat yield can be estimated from metrics derived from the GAI decreasing curves and its maximum value, based on an empirical approach. One of the main drawbacks of such empirically-based models for estimating crop yield has been that their application is valid only for the area they have been calibrated for. Nonetheless, they are often the preferred approach owing to their limited data requirements and simplicity to implement (Doraiswamy et al., 2005 ; Moriondo et al., 2007; Becker-Reshef et al., 2010).
5 Conclusion
Results of this preliminary study show that wheat yield could be estimated at NUTS3 level from metrics derived from GAI temporal profiles.
Further research by applying the approach to other areas and years of GAI measurements is expected to confirm these results.
6 Acknowledgments
This study takes place within the framework of the GLOBAM project (GLObal Agricultural Monitoring systems by integration of earth observation and modelling techniques), funded by the Belgian Science Policy (BELSPO). G. Duveiller is funded by a PhD grant provided by the by the Belgian Fond de la Recherche Scientifique – FNRS.
7 References
BARET, F. (1986). Contribution au suivi radiométrique de cultures de céréales, Ph.D thesis, Université de Paris-Sud.
BARET, F. and GUYOT, G. (1986). Radiométrie de la maturation de couverts de Blé dans le visible et le proche infra-rouge. Agronomie 6(6): 509-516.
BARET, F., HAGOLLE, O., GEIGER, B., BICHERON, P., MIRAS, B., HUC, M., BERTHELOT, B., NIÑO, F., WEISS, M., SAMAIN, O., ROUJEAN, J. L. and LEROY, M. (2007). LAI, fAPAR and fCover CYCLOPES global products derived from VEGETATION: Part 1: Principles of the algorithm. Remote Sensing of Environment 110(3): 275-286.
BECKER-RESHEF, I., VERMOTE, E., LINDEMAN, M. and JUSTICE, C. (2010). A generalized regression-based model for forecasting winter wheat yields in Kansas and Ukraine using MODIS data. Remote Sensing of Environment 114(6): 1312-1323.
BLANDINO, M. and REYNERI, A. (2009). Effect of fungicide and foliar fertilizer application to winter wheat at anthesis on flag leaf senescence, grain yield, flour bread-making quality and DON contamination. European Journal of Agronomy 30(4): 275-282.
BRÉDA, N. J. J. (2003). Ground-based measurements of leaf area index: a review of methods, instruments and current controversies. Journal of Experimental Botany
54(392): 2403-2417.
DIMMOCK, J. P. R. E. and GOODING, M. J. (2002). The effects of fungicides on rate and duration of grain filling in winter wheat in relation to maintenance of flag leaf green area. The Journal of Agricultural Science 138(01): 1-16.
DUVEILLER, G., DEFOURNY, P., BARET F., WEISS M., PICCARD I., QINGHAN D., 2009. Crop specific monitoring of biophysical variables at regional scale using MODIS imagery, In: Proceedings of the 33rd International Symposium on Remote Sensing of Environment : Sustaining the Millennium Develoment Goals, Stresa, Lago Maggiore, Italy, May 4-8, 2009.
DUVEILLER, G. and DEFOURNY, P., 2010 A conceptual framework to define the spatial resolution requirements for agricultural monitoring using remote sensing. Remote Sensing of Environement (in press)
DORAISWAMY, P. C., SINCLAIR, T. R., HOLLINGER, S., AKHMEDOV, B., STERN, A. and PRUEGER, J. (2005). Application of MODIS derived parameters for regional crop yield assessment. Remote Sensing of Environment 97(2): 192-202.
DUCHEMIN, B., MAISONGRANDE, P., BOULET, G. and BENHADJ, I. (2008). A simple algorithm for yield estimates: Evaluation for semi-arid irrigated winter wheat monitored with green leaf area index. Environmental Modelling & Software 23(7): 876-892.
GOODING, M. J., DIMMOCK, J. P. R. E., FRANCE, J. and JONES, S. A. (2000). Green leaf area decline of wheat flag leaves: the influence of fungicides and relationships with mean grain weight and grain yield. Annals of Applied Biology 136(1): 77-84.
GOWER, S. T., KUCHARIK, C. J. and NORMAN, J. M. (1999). Direct and Indirect Estimation of Leaf Area Index, fAPAR, and Net Primary Production of Terrestrial Ecosystems - a real or imaginary problem? Remote Sensing of Environment 70: 29-51. HOSOI, F. and OMASA, K. (2009). Estimating vertical plant area density profile and growth
parameters of a wheat canopy at different growth stages using three-dimensional portable lidar imaging. ISPRS Journal of Photogrammetry and Remote Sensing 64(2): 151-158.
JACQUEMOUD, S. and BARET, F., 1990. PROSPECT: A model of leaf optical properties spectra, Remote Sensing of Environment, 34 (2), 75{91
JONCKHEERE, I., FLECK, S., NACKAERTS, K., MUYS, B., COPPIN, P., WEISS, M. and BARET, F. (2004). Review of methods for in situ leaf area index determination: Part I. Theories, sensors and hemispherical photography. Agricultural and Forest Meteorology
121(1-2): 19-35.
LAUVERNET, C. (2005). Assimilation variationnelle d'observations de télédétectiondans les modèles de fonctionnement de la végétation : utilisation du modèle adjoint et prise en compte de contraintes spatiales, Ph.D thesis, UniversitéJoseph Fourier - Grenoble MORIONDO, M., MASELLI, F. and BINDI, M. (2007). A simple model of regional wheat
yield based on NDVI data. European Journal of Agronomy 26(3): 266-274.
NEUMANN, H. H., DEN HARTOG, G. and SHAW, R. H. (1989). Leaf area measurements based on hemispheric photographs and leaf-litter collection in a deciduous forest during autumn leaf-fall. Agricultural and Forest Meteorology 45(3-4): 325-345.
OLESEN, J. E., PETERSEN, B. M., BERNTSEN, J., HANSEN, S., JAMIESON, P. D. and THOMSEN, A. G. (2002). Comparison of methods for simulating effects of nitrogen on green area index and dry matter growth in winter wheat. Field Crops Research 74(2-3): 131-149.
REYNOLDS, M. P., DELGADO B, M. I., GUTIÉRREZ-RODRÍGUEZ, M. and LARQUÉ-SAAVEDRA, A. (2000). Photosynthesis of wheat in a warm, irrigated environment: I: Genetic diversity and crop productivity. Field Crops Research 66(1): 37-50.
RICHARDS, R. A. (2000). Selectable traits to increase crop photosynthesis and yield of grain crops. J. Exp. Bot. 51(suppl_1): 447-458.
SUPIT, I. (2000). An exploratory study to improve the predictive capacity of the Crop Growth Monitoring System as applied by the European Commission. Heelsum, Treemail Publishers 180.
SYLVESTER-BRADLEY, R., SCOTT, R. K. and WRIGHT, C. E. (1990). Physiology in the Production and Improvement of Cereals. London, Home-Grown Cereals Authority Research Review. 18.
VERHOEF, W. (1984). Light scattering by leaf layers with application to canopy reflectance modeling: The SAIL model, Remote Sensing of Environment, 16 (2), 125-141
WEISS, M., BARET, F., SMITH, G. J., JONCKHEERE, I. and COPPIN, P. (2004). Review of methods for in situ leaf area index (LAI) determination: Part II. Estimation of LAI, errors and sampling. Agricultural and Forest Meteorology 121(1-2): 37-53.